Focused Salinity and Temperature Forecasts
This page provides information focused on specific locations. Current focus regions are:
- Salinity - Virginia Tributary Bottom and Surface: Maps of the bottom and surface salinity in the main Virginia tributaries
- Salinity - Lower Chesapeake Bay: Maps of the bottom and surface salinity in the lower Chesapeake Bay
- Water Temperature - Virginia Tributary Minimum and Maximum: Maps of the minimum and maximum water temperature in the water column in the main Virginia tributaries
- Water Temperature - Virginia Tributary Bottom and Surface: Maps of the bottom and surface water temperature in the main Virginia tributaries
- Water Temperature - Lower Chesapeake Bay: Maps of the bottom and surface water temperature in the lower Chesapeake Bay
Click on the headings below to view the real-time forecast information.
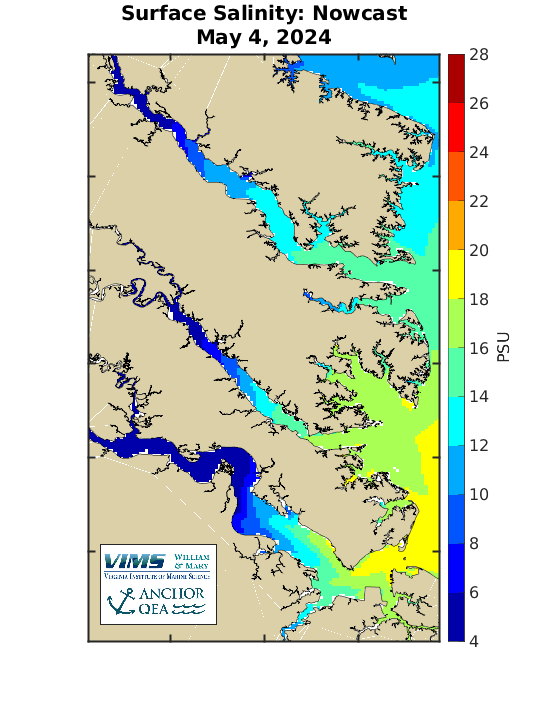
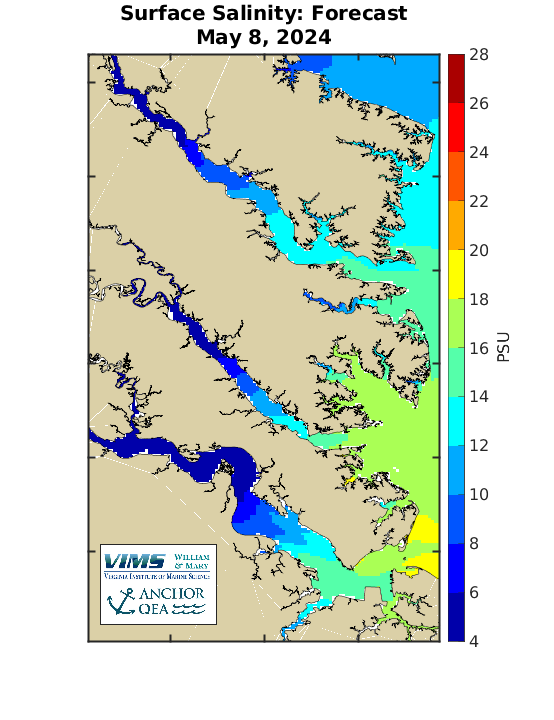
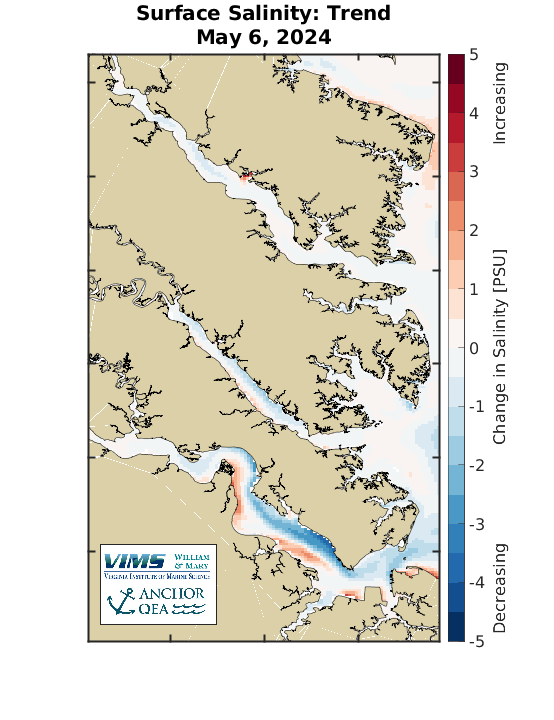
Salinity - Virginia Tributary Bottom and SurfaceThese maps show the Nowcast, Forecast, and Trend in salinity, with focus on the James, York, and Rappahannock rivers. The maps use the surface and bottom daily-averaged salinity. That is, the salinity from the forecast model is daily-averaged and then both the surface and bottom salinity are mapped.
|
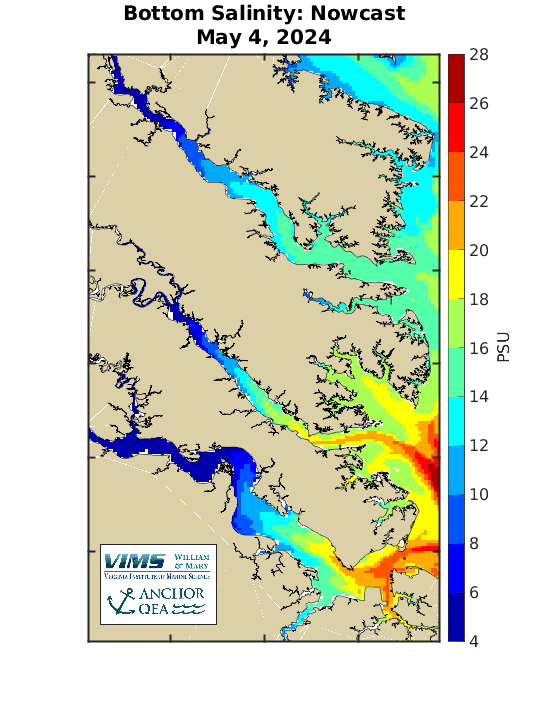
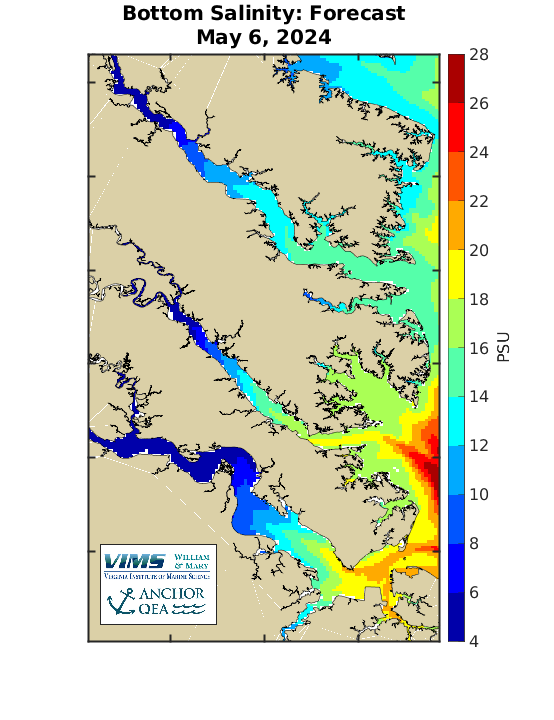
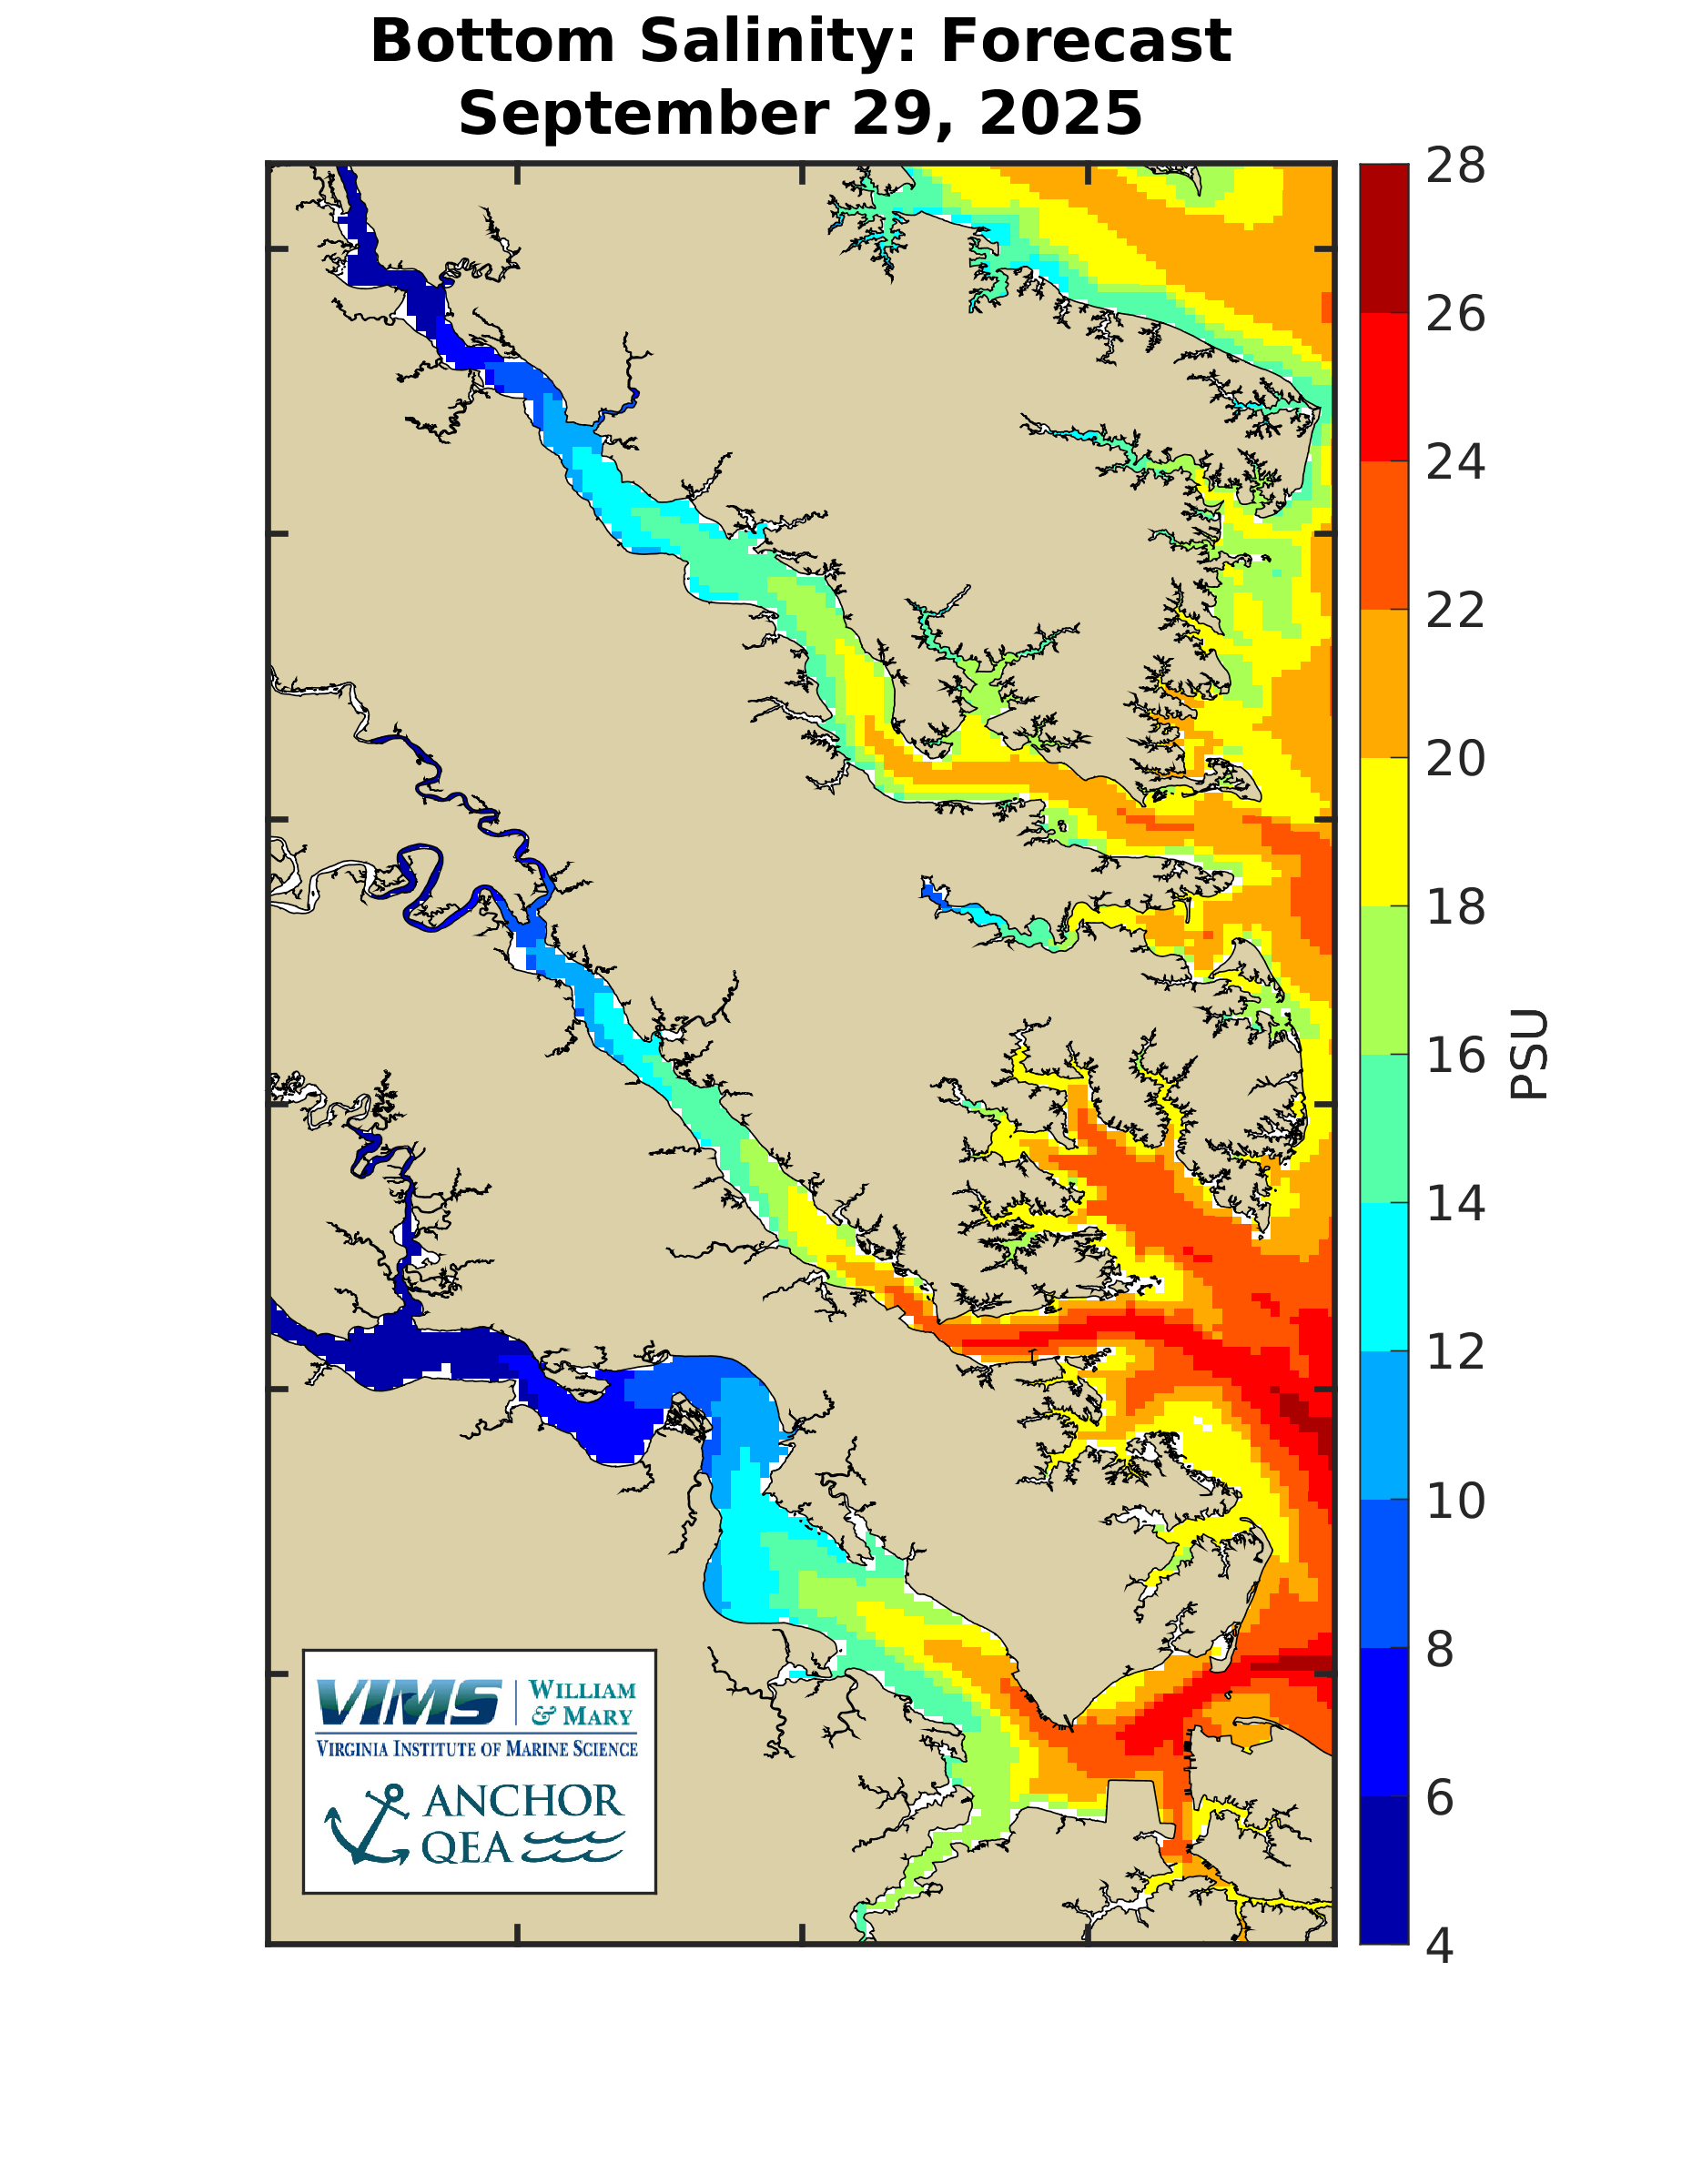
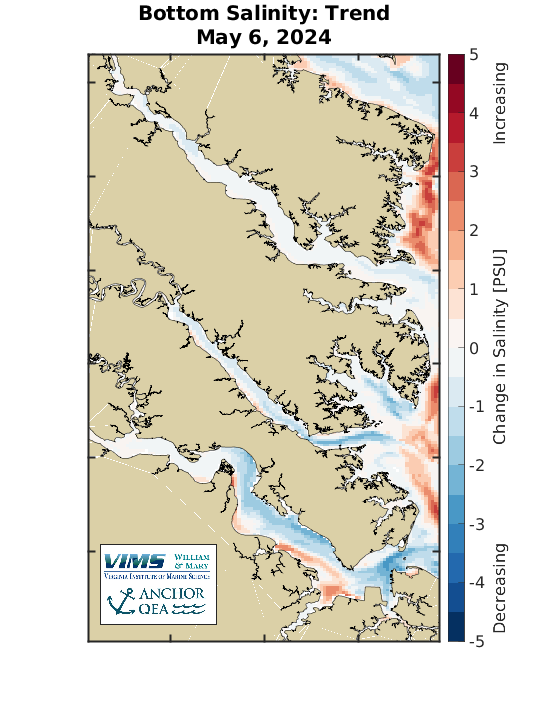
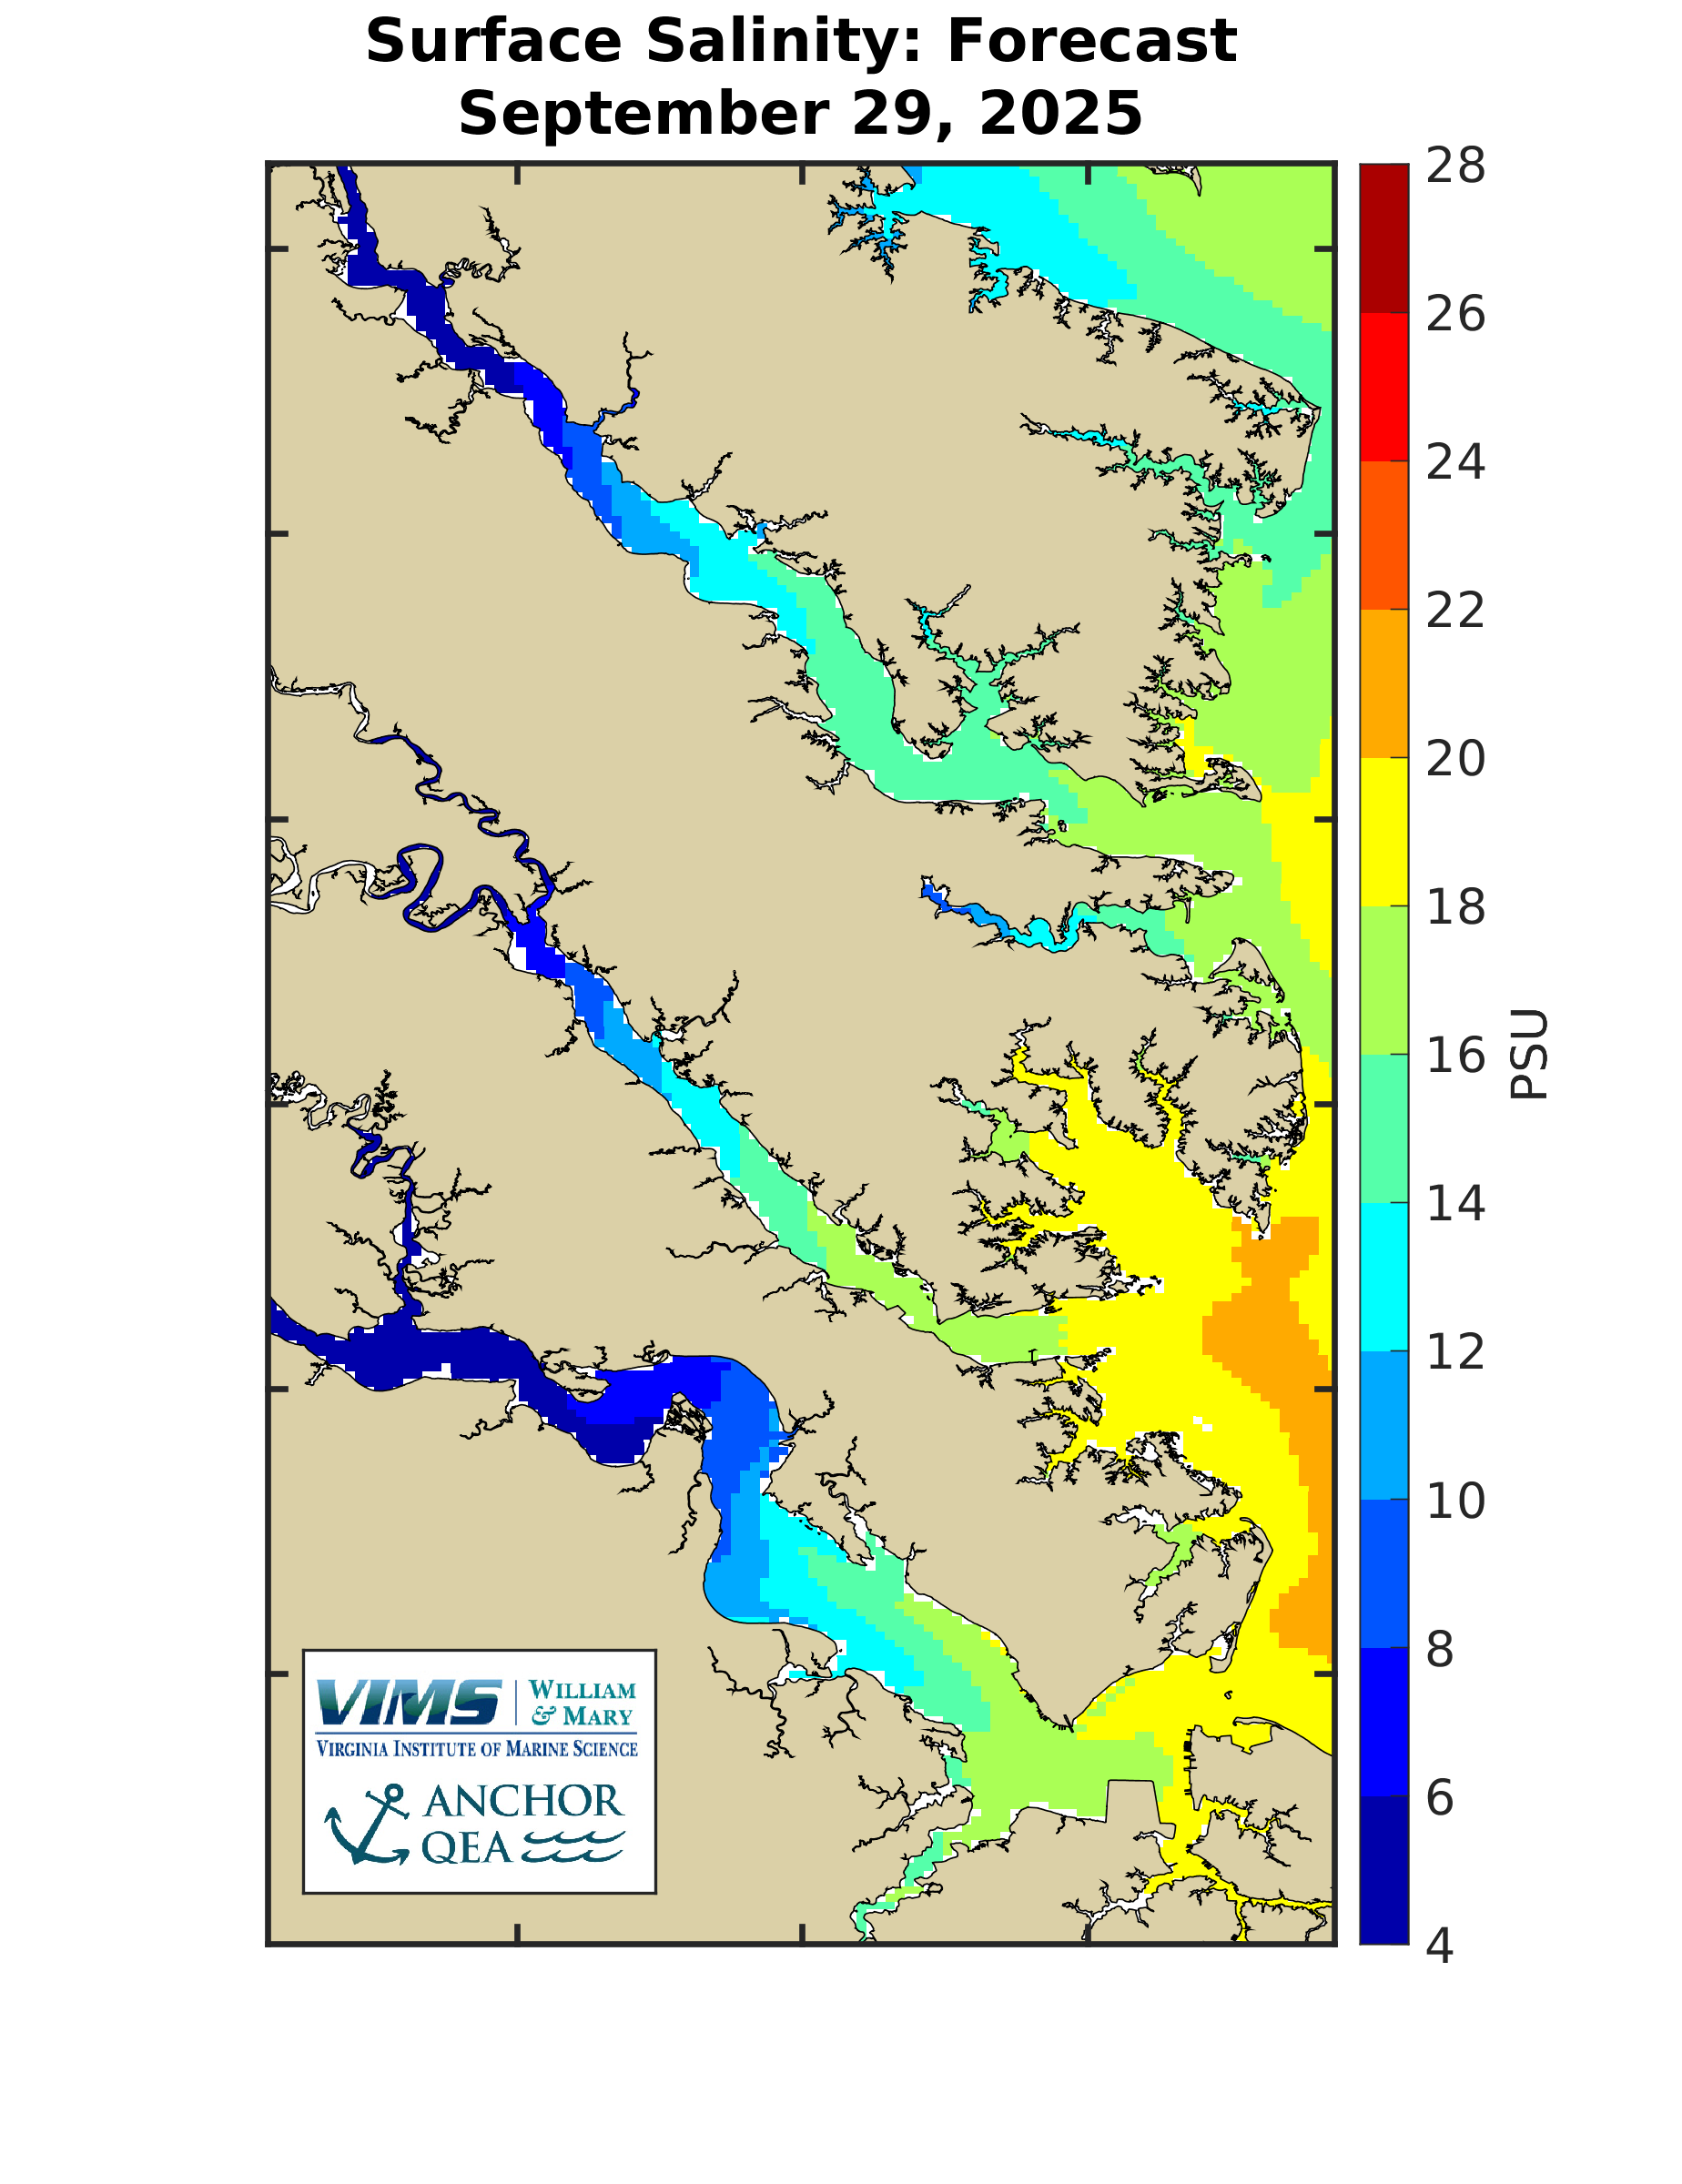
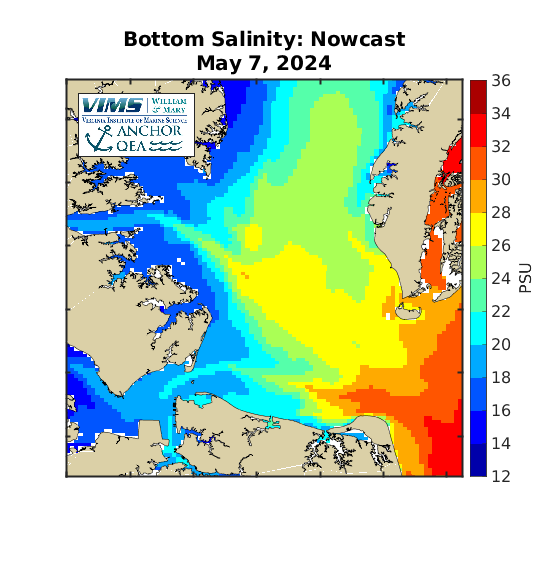
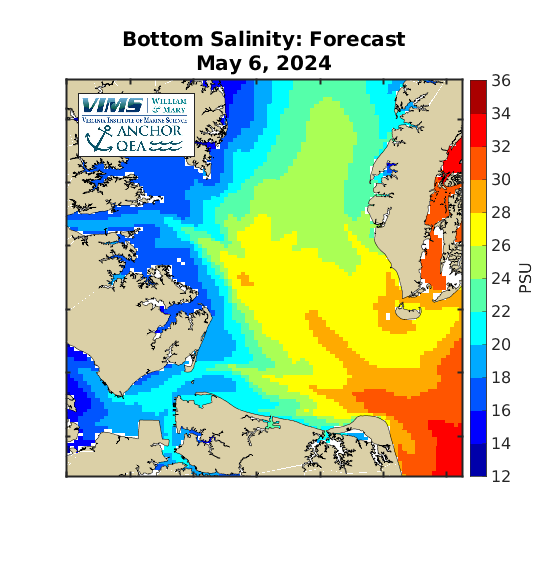
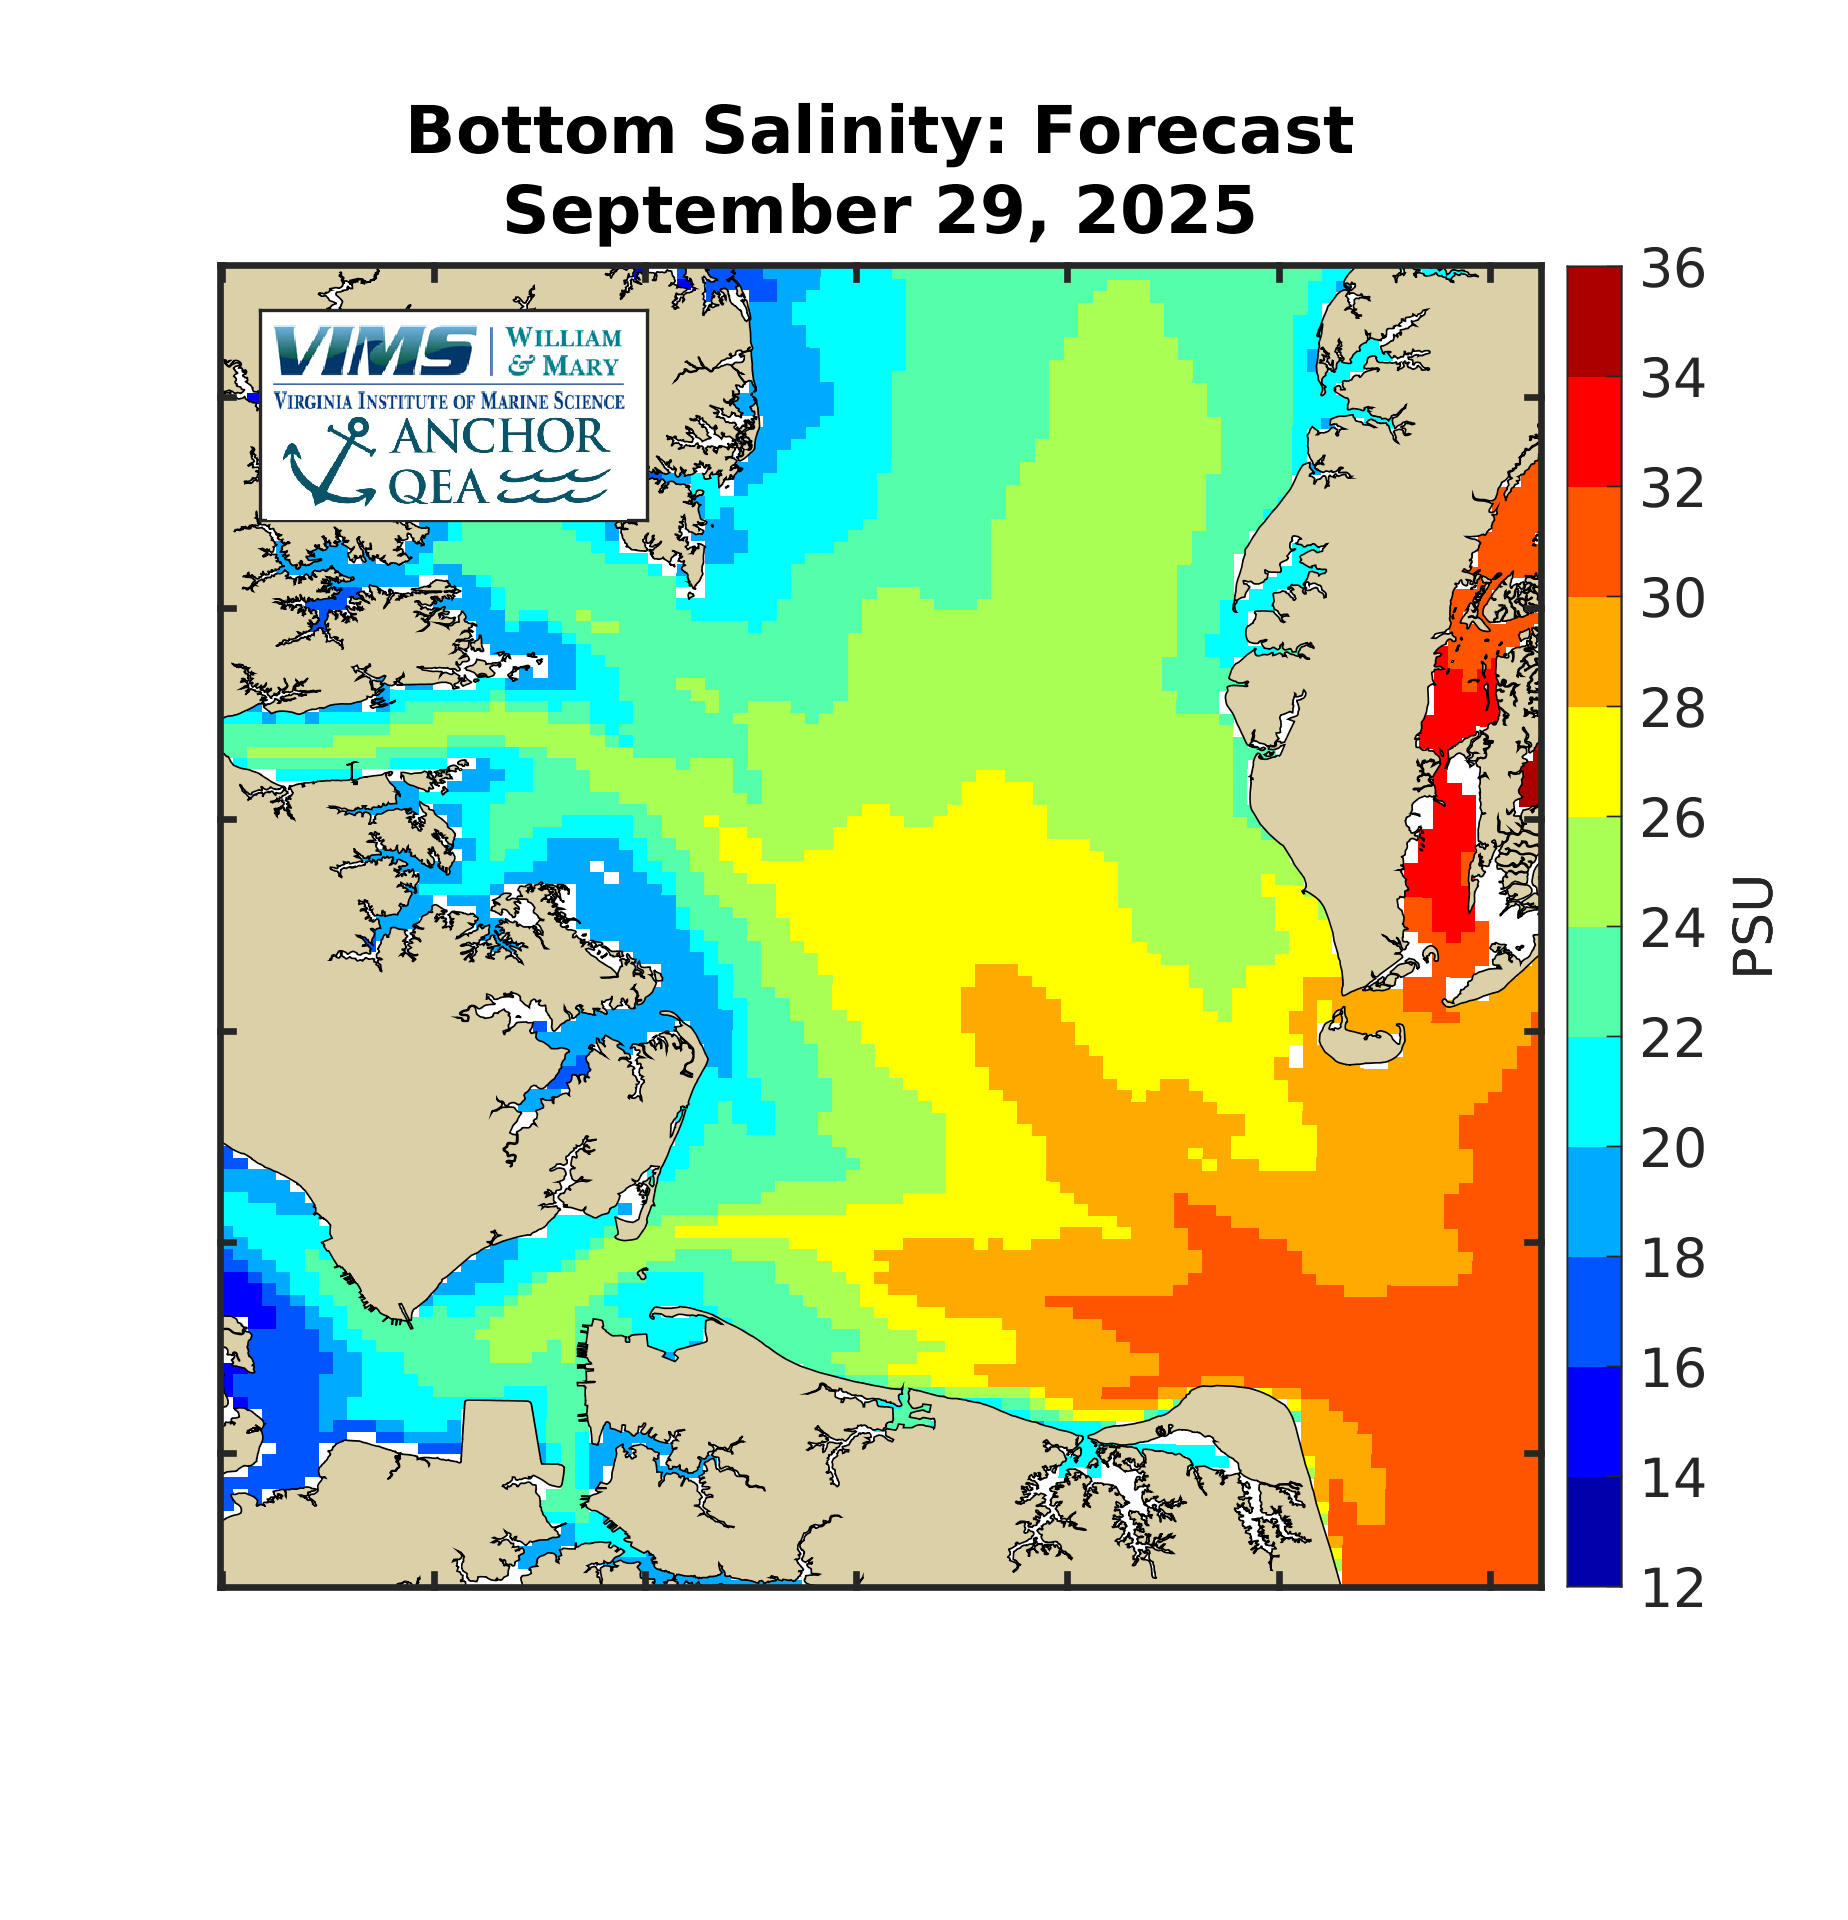
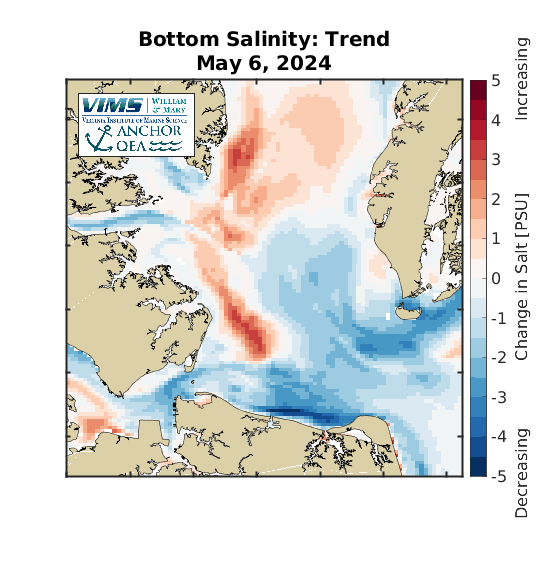
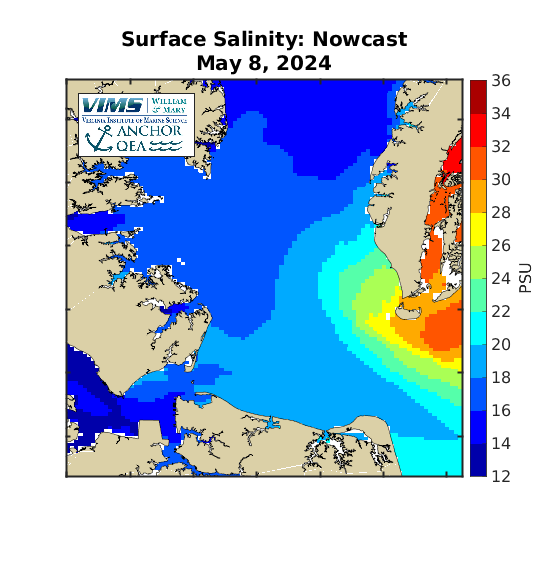
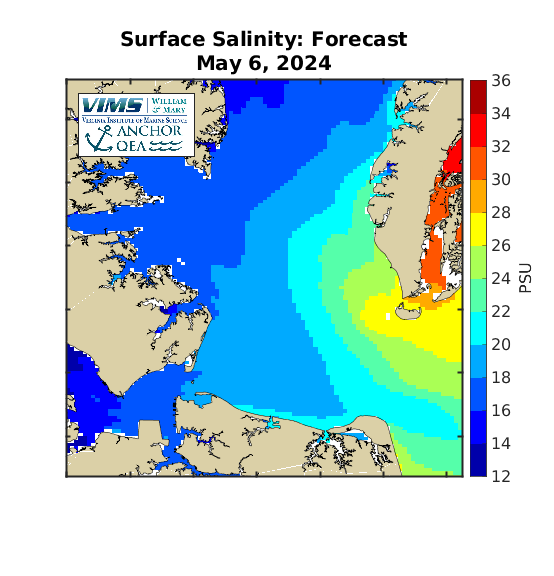
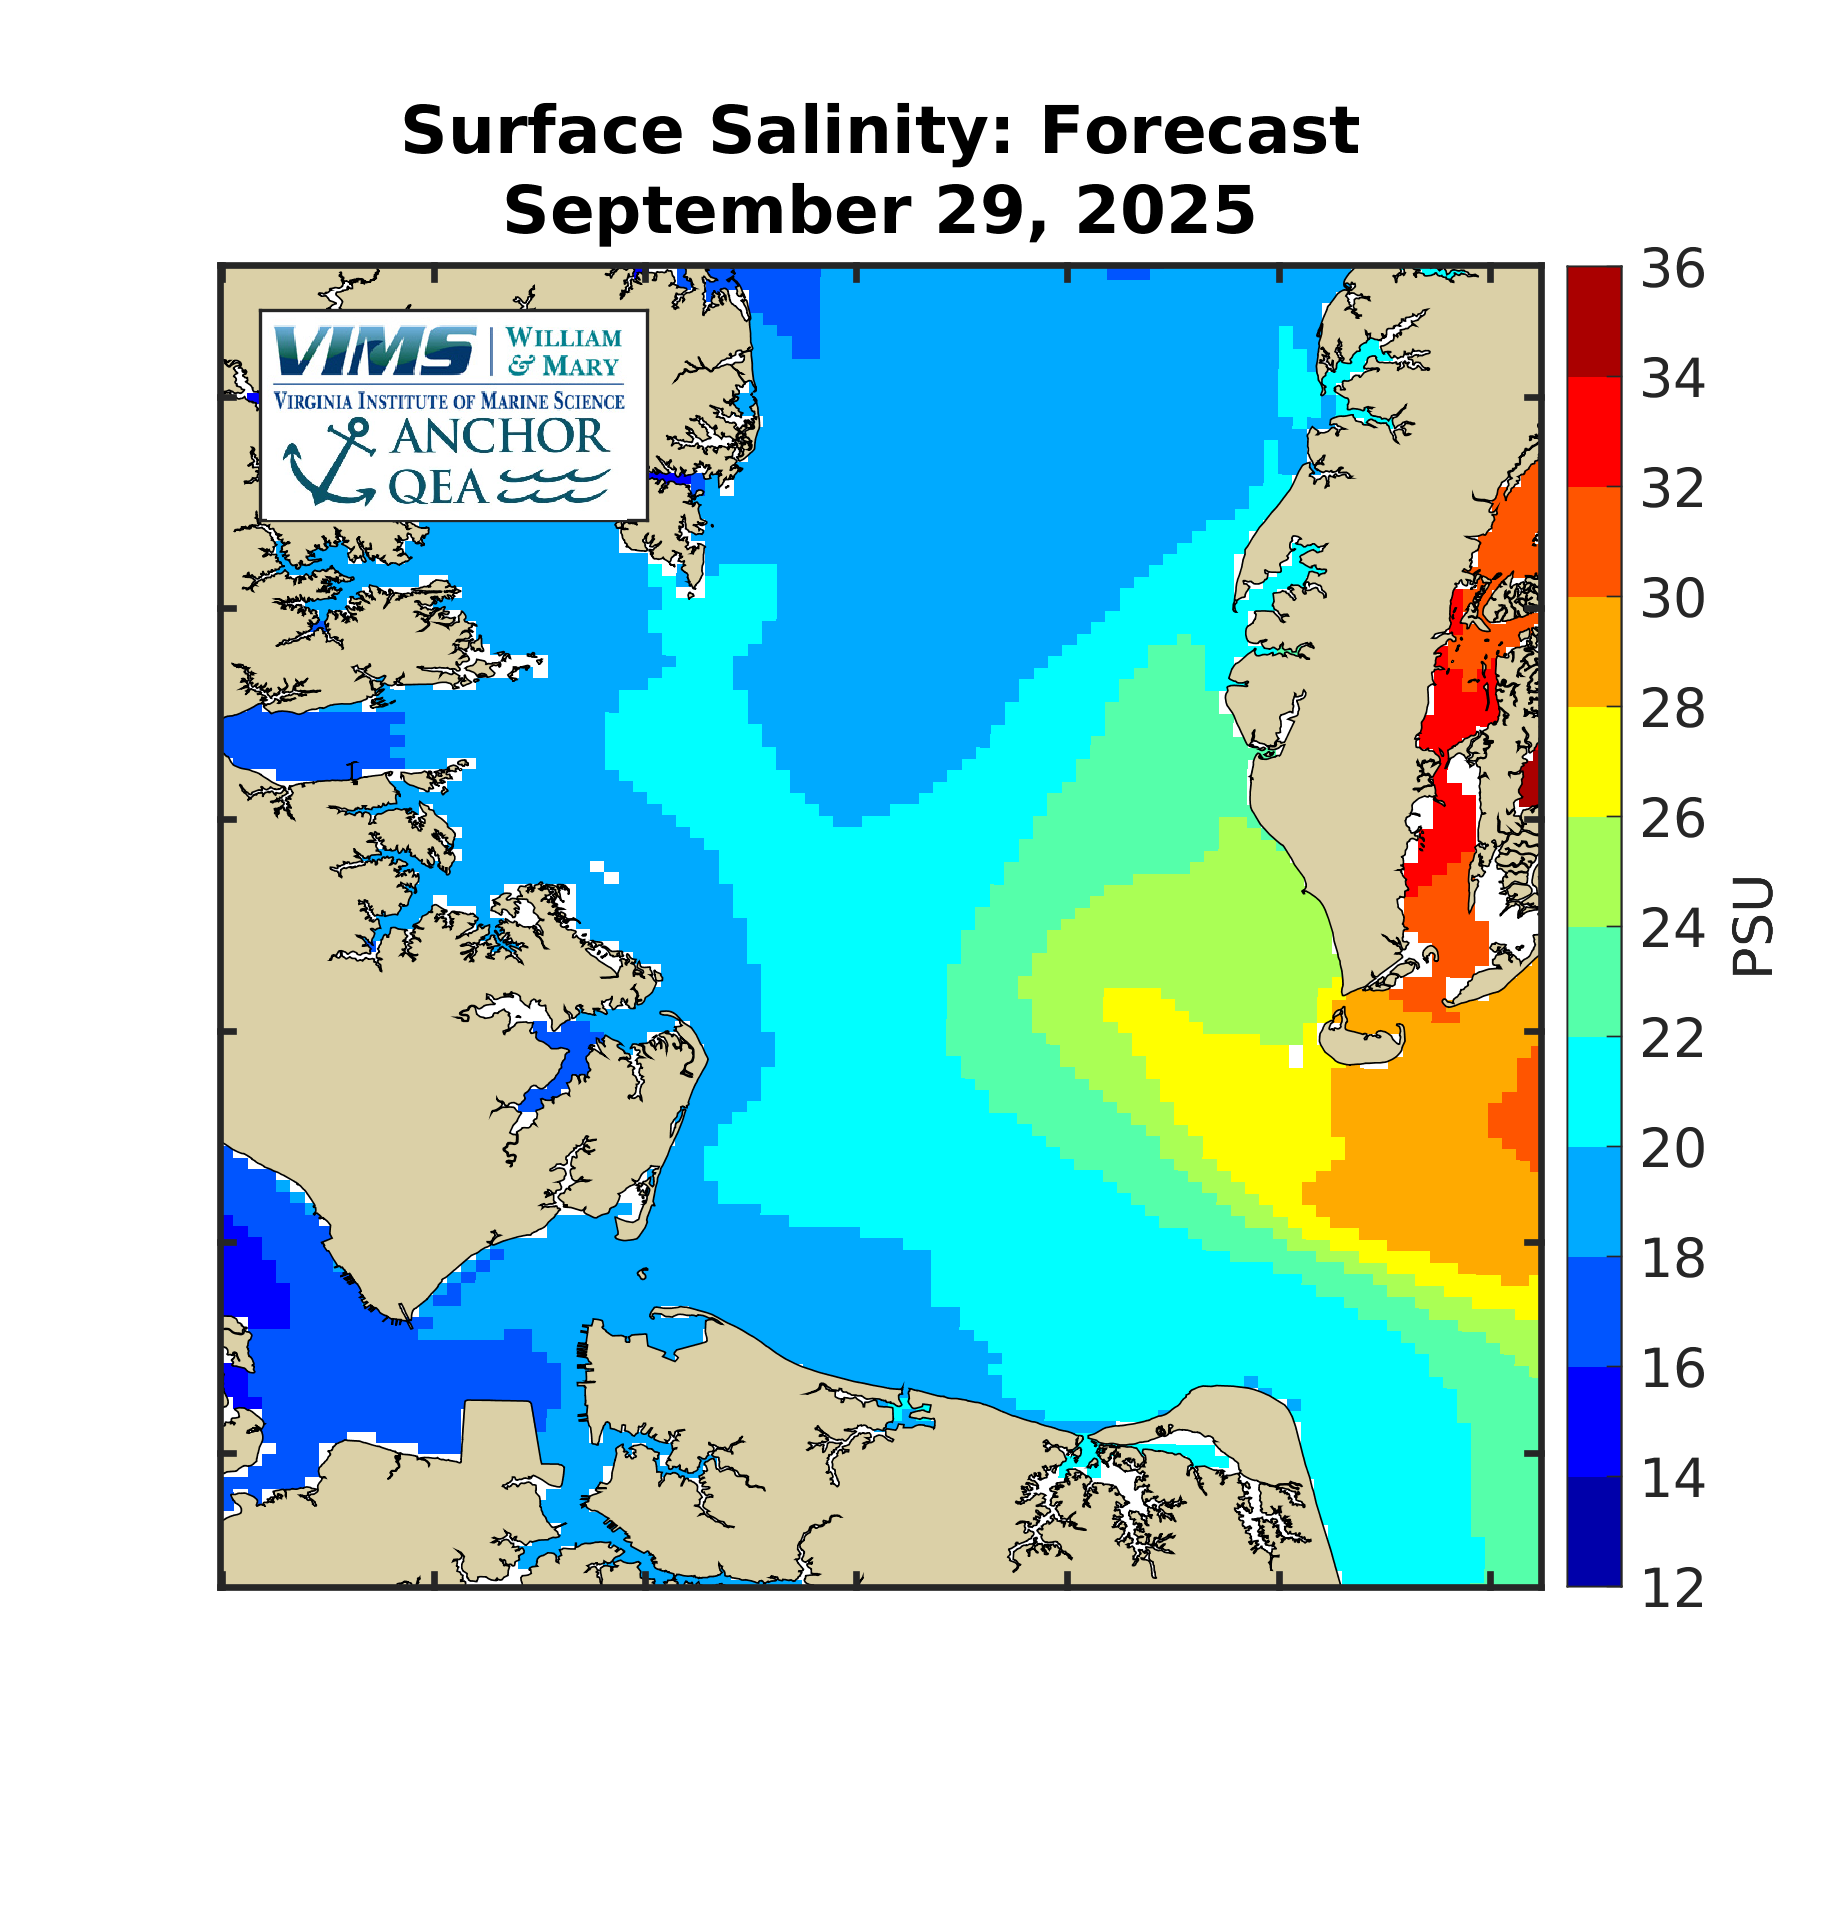
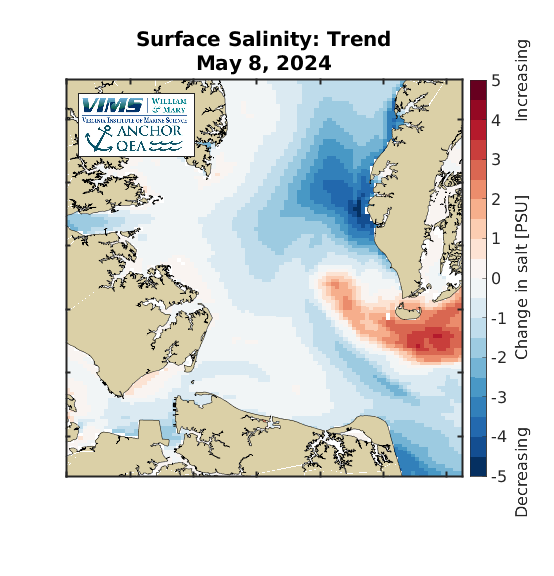
Salinity - Lower Chesapeake BayThese maps show the Nowcast, Forecast, and Trend in salinity, with focus on the lower Chesapeake Bay. The maps use the surface and bottom daily-averaged salinity. That is, the salinity from the forecast model is daily-averaged and then both the surface and bottom salinity are mapped. The forecast model is most accurate in the main portion of the Bay and the large tributaries. Salinity in smaller inlets may not be accurate.
|
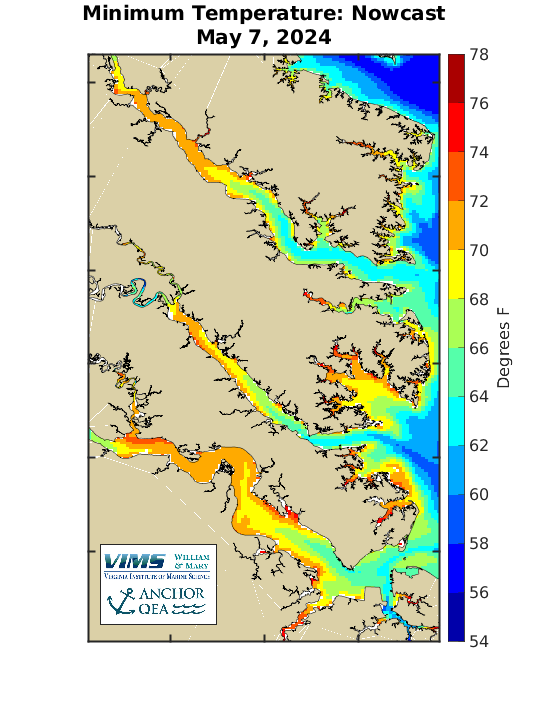
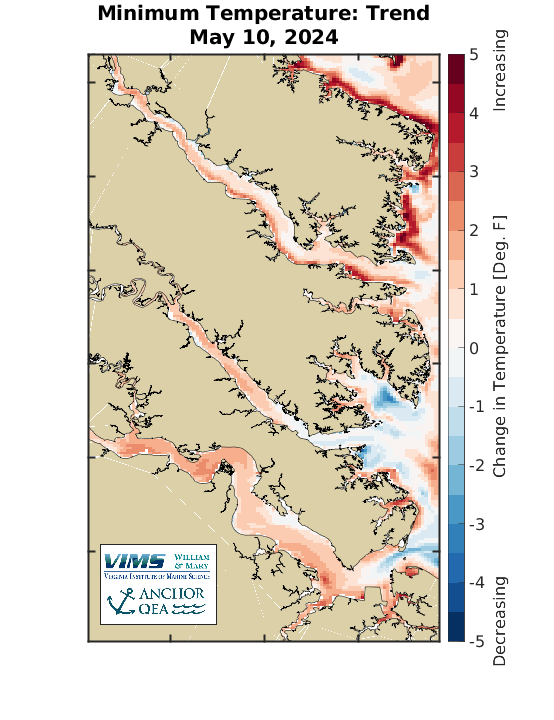
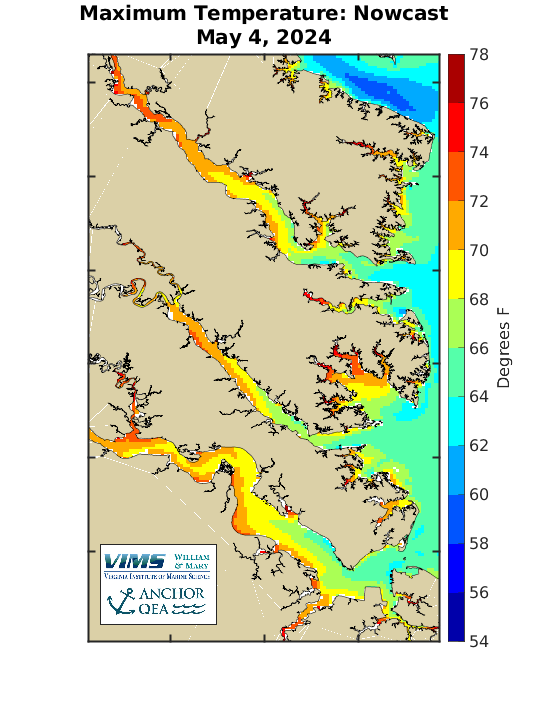
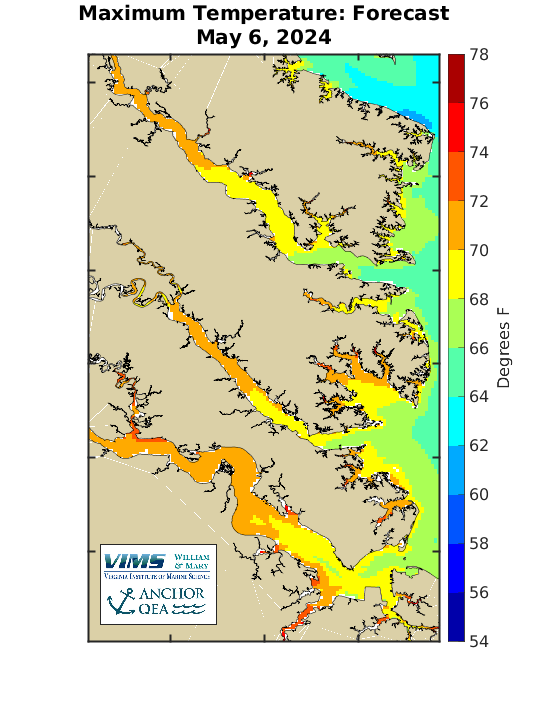
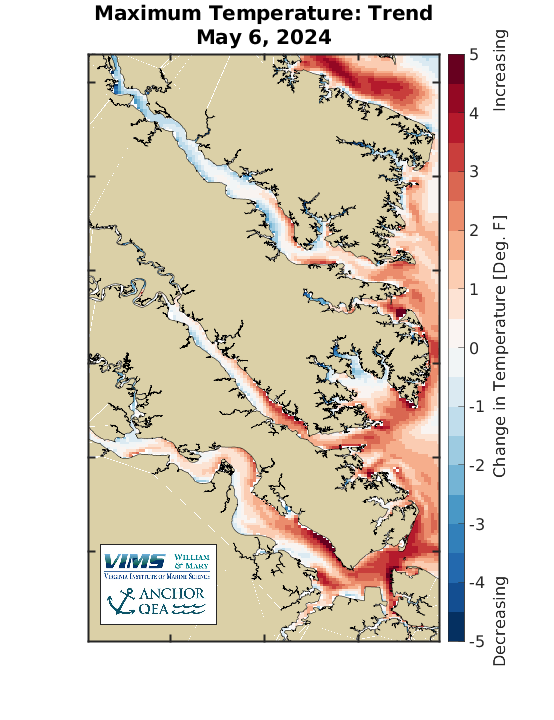
Water Temperature - Virginia Tributary Minimum and MaximumThese maps show the Nowcast, Forecast, and Trend in water temperature, with a focus on the James, York, and Rappahannock rivers. The maps use the minimum and maximum daily-averaged water temperature. That is, the water temperature from the forecast model is daily-averaged and then both the minimum and maximum water temperature throughout the water column are mapped.
|

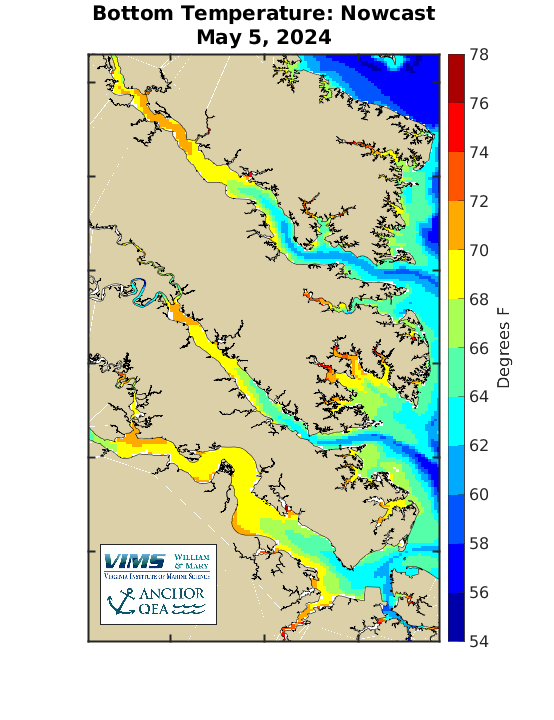
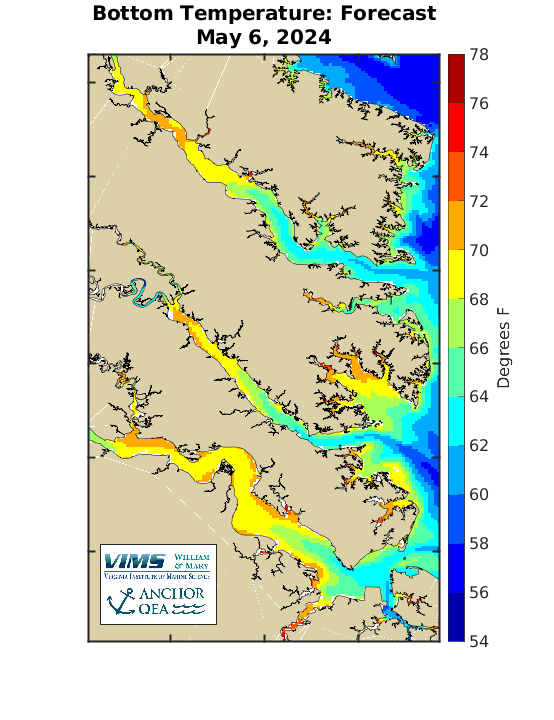
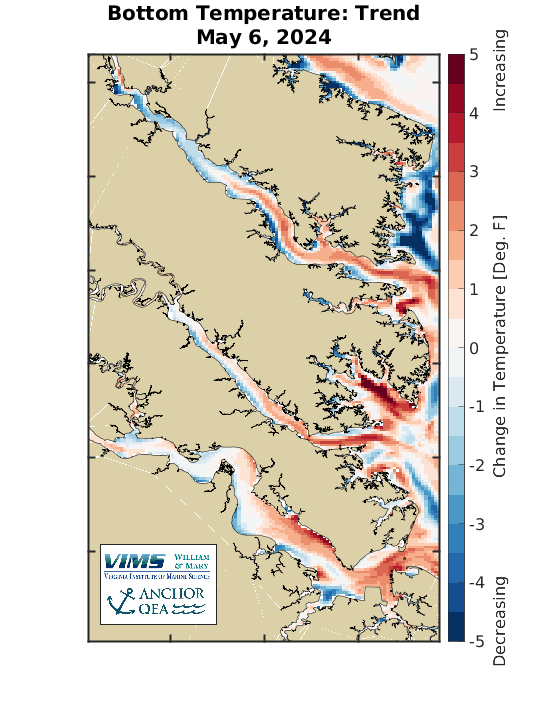
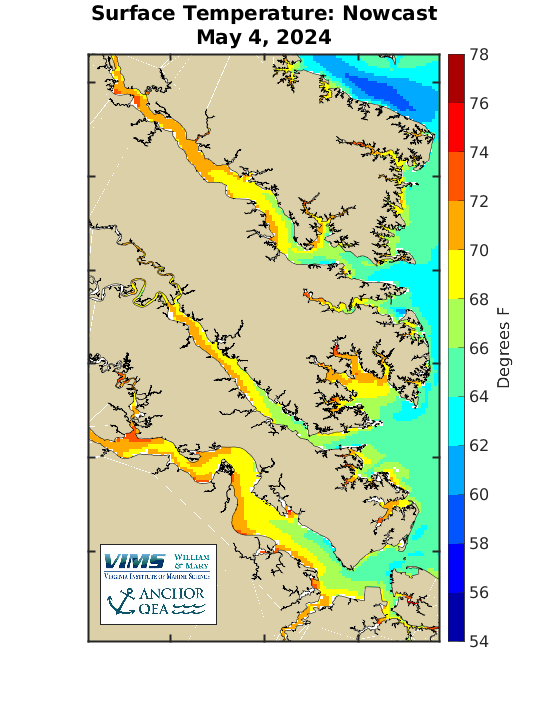
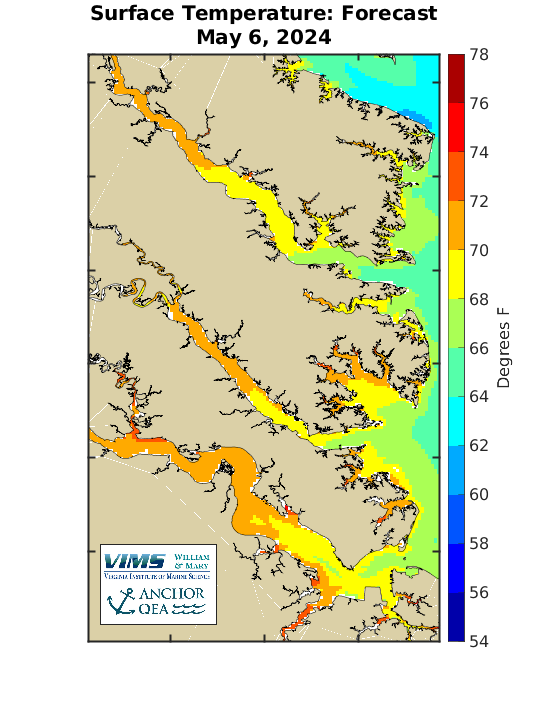
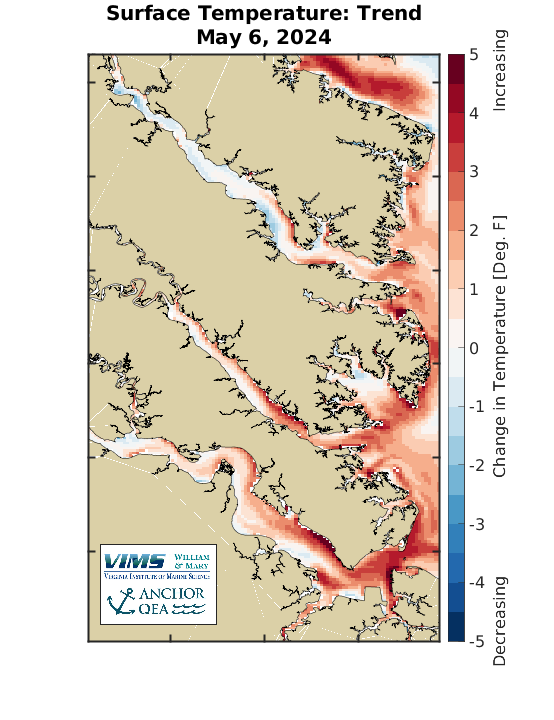
Water Temperature - Virginia Tributary Bottom and SurfaceThese maps show the Nowcast, Forecast, and Trend in water temperature, with focus on the James, York, and Rappahannock rivers. The maps use the surface and bottom daily-averaged water temperature. That is, the water temperature from the forecast model is daily-averaged and then both the surface and bottom water temperature are mapped.
|
 \
\
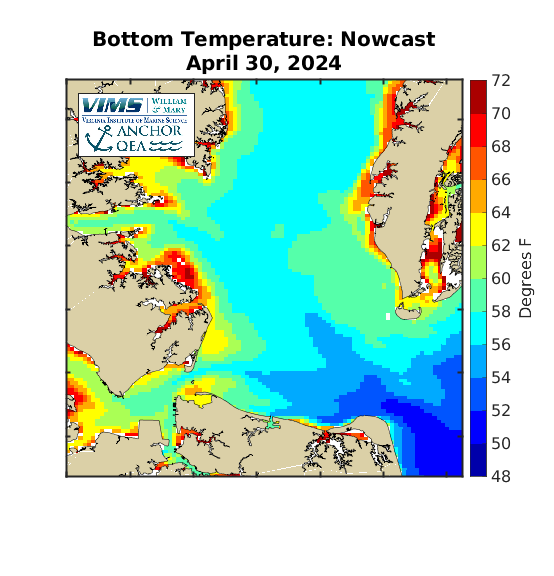
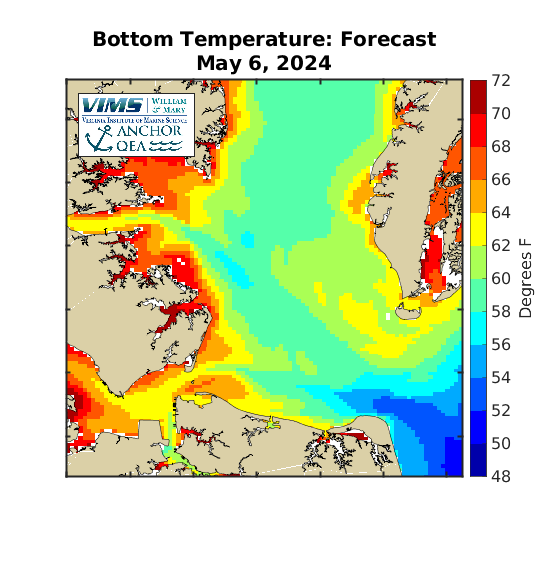
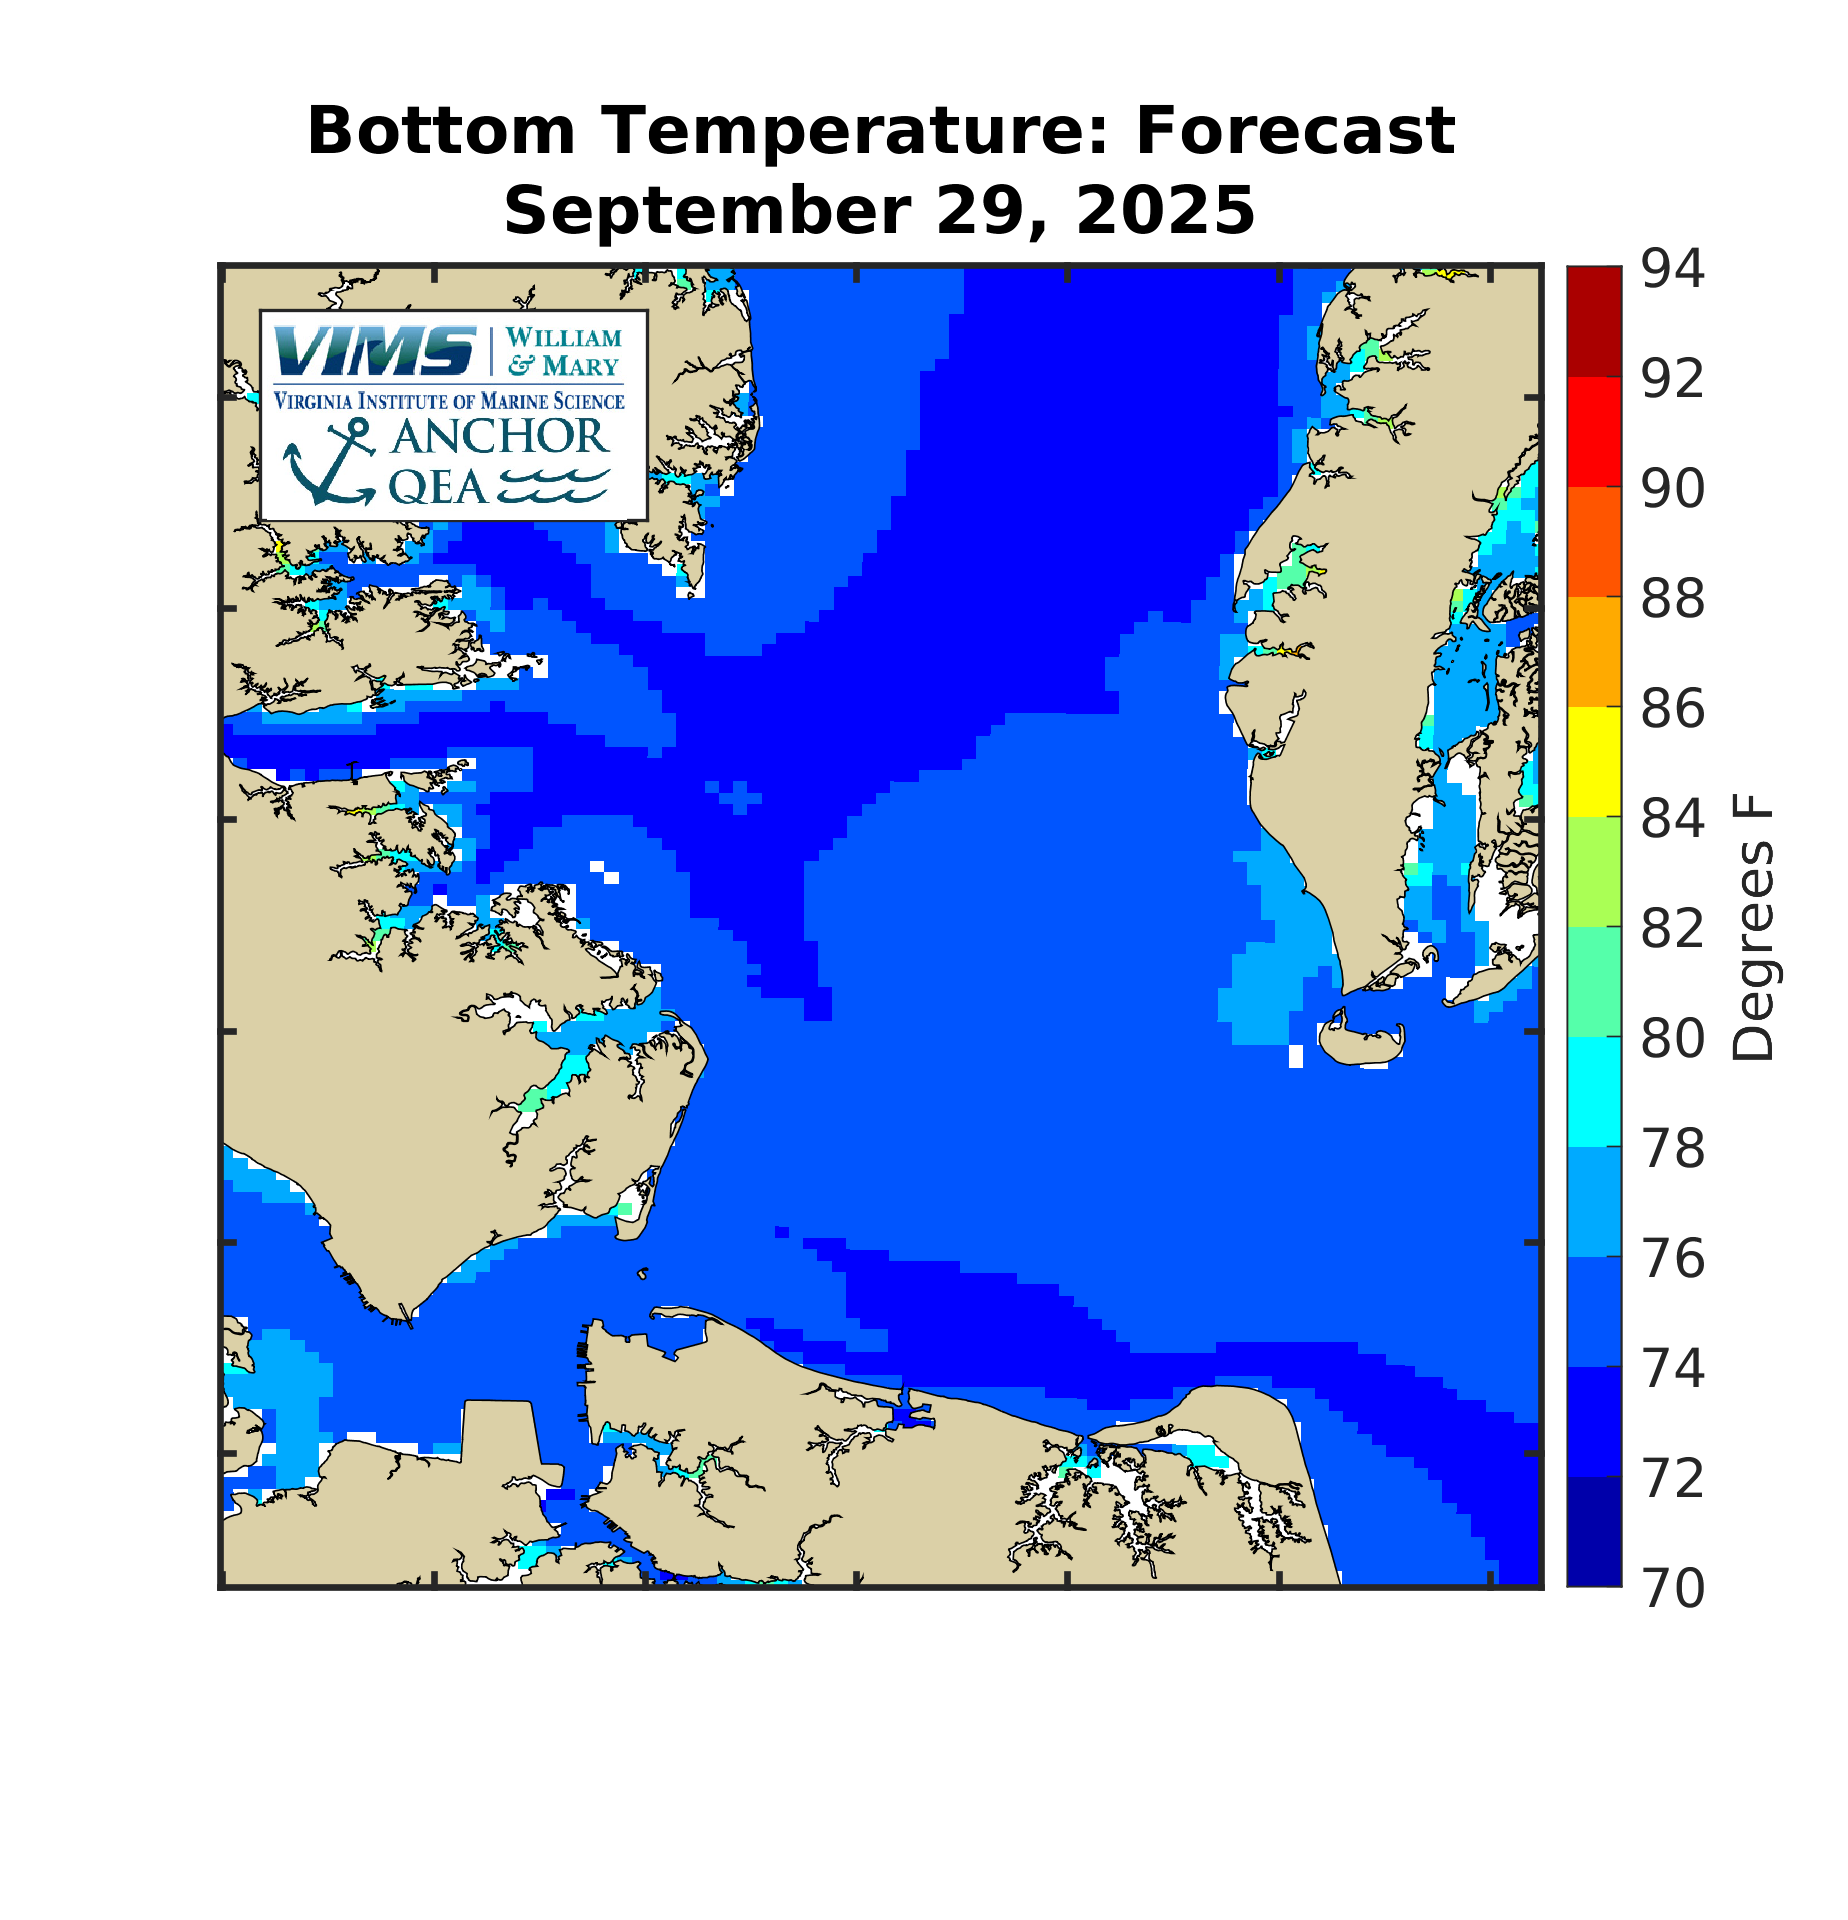
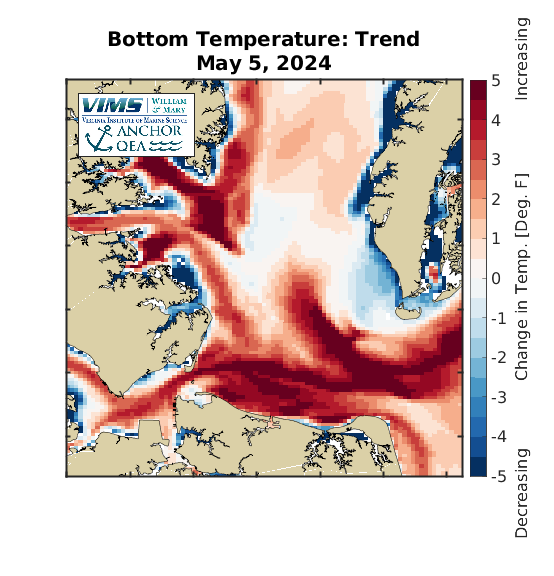
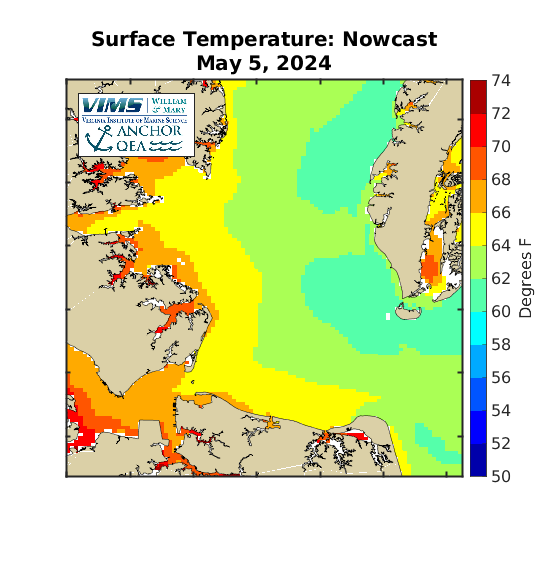
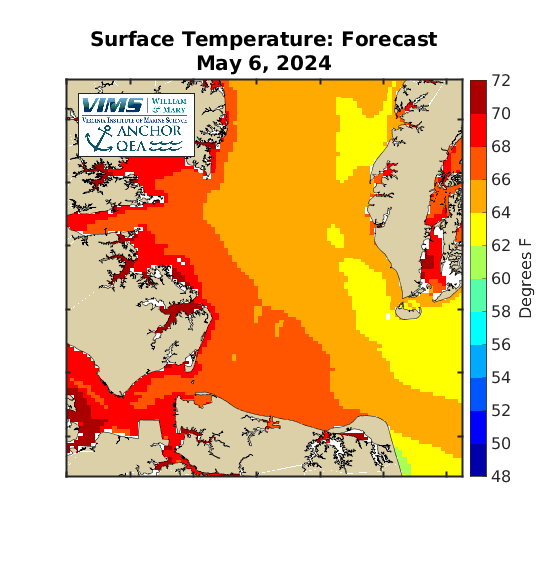
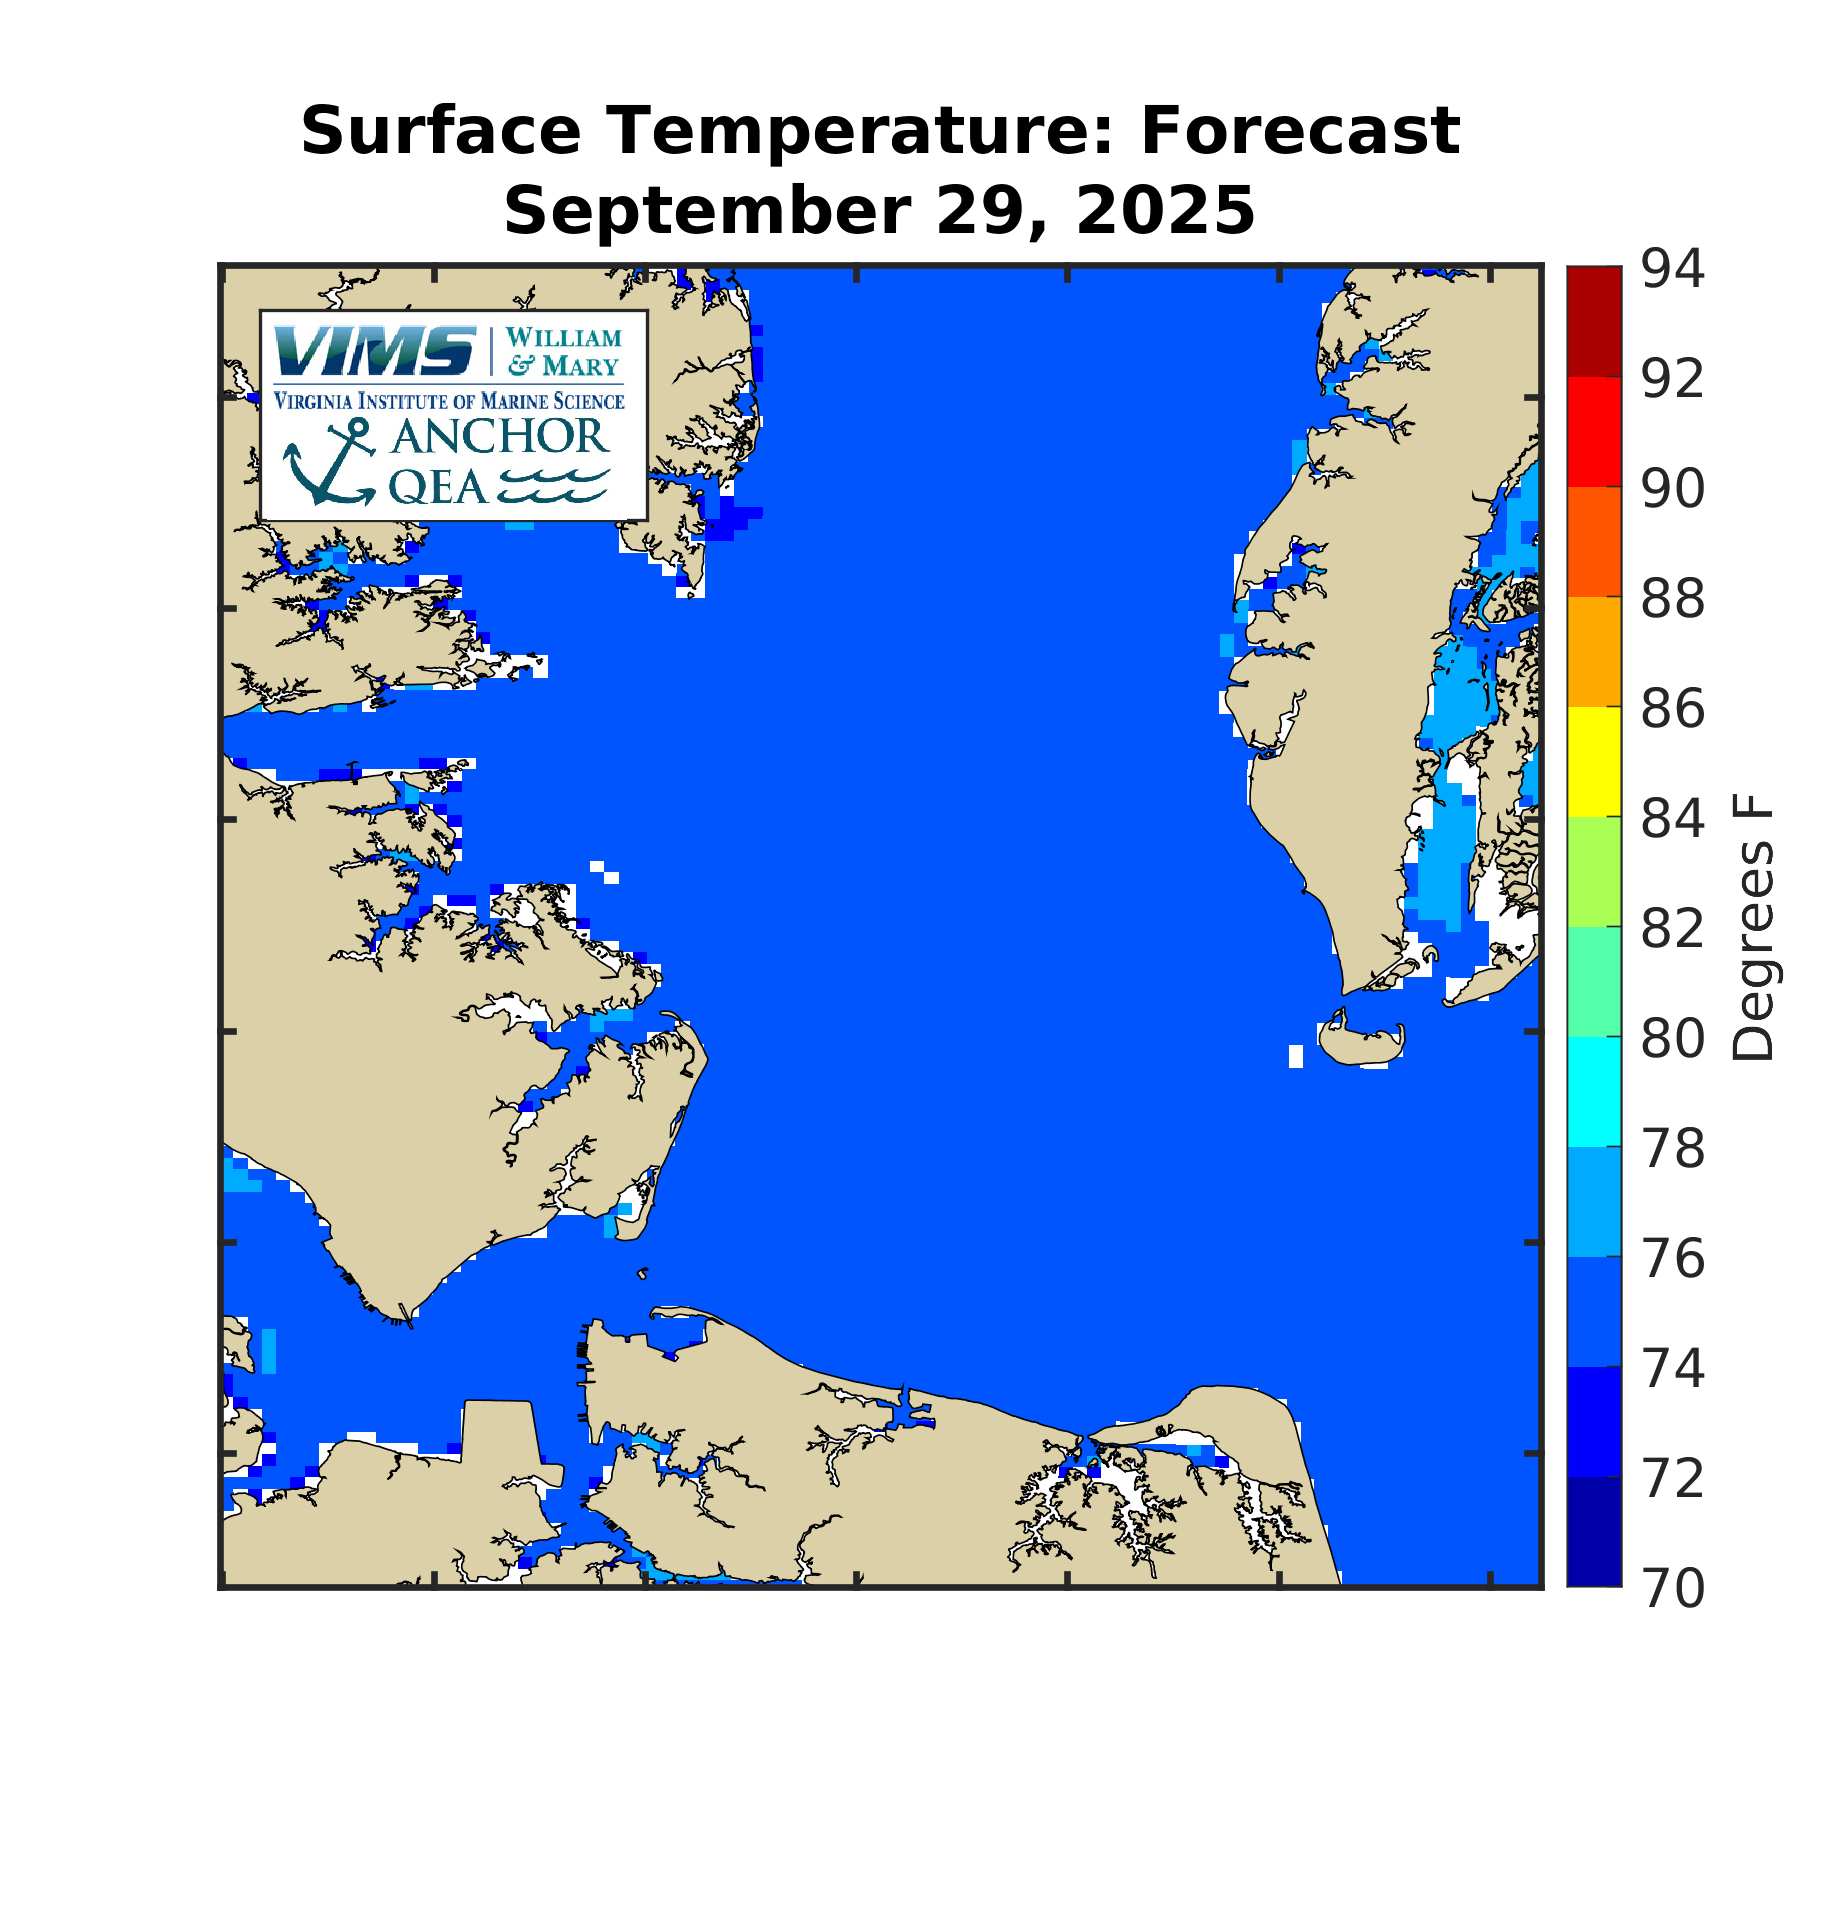
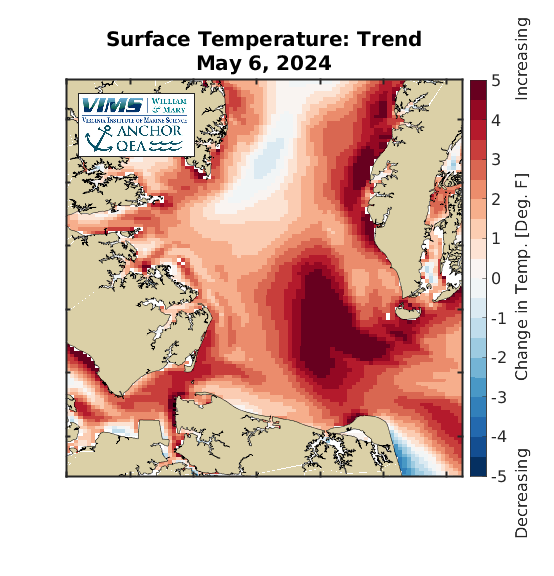
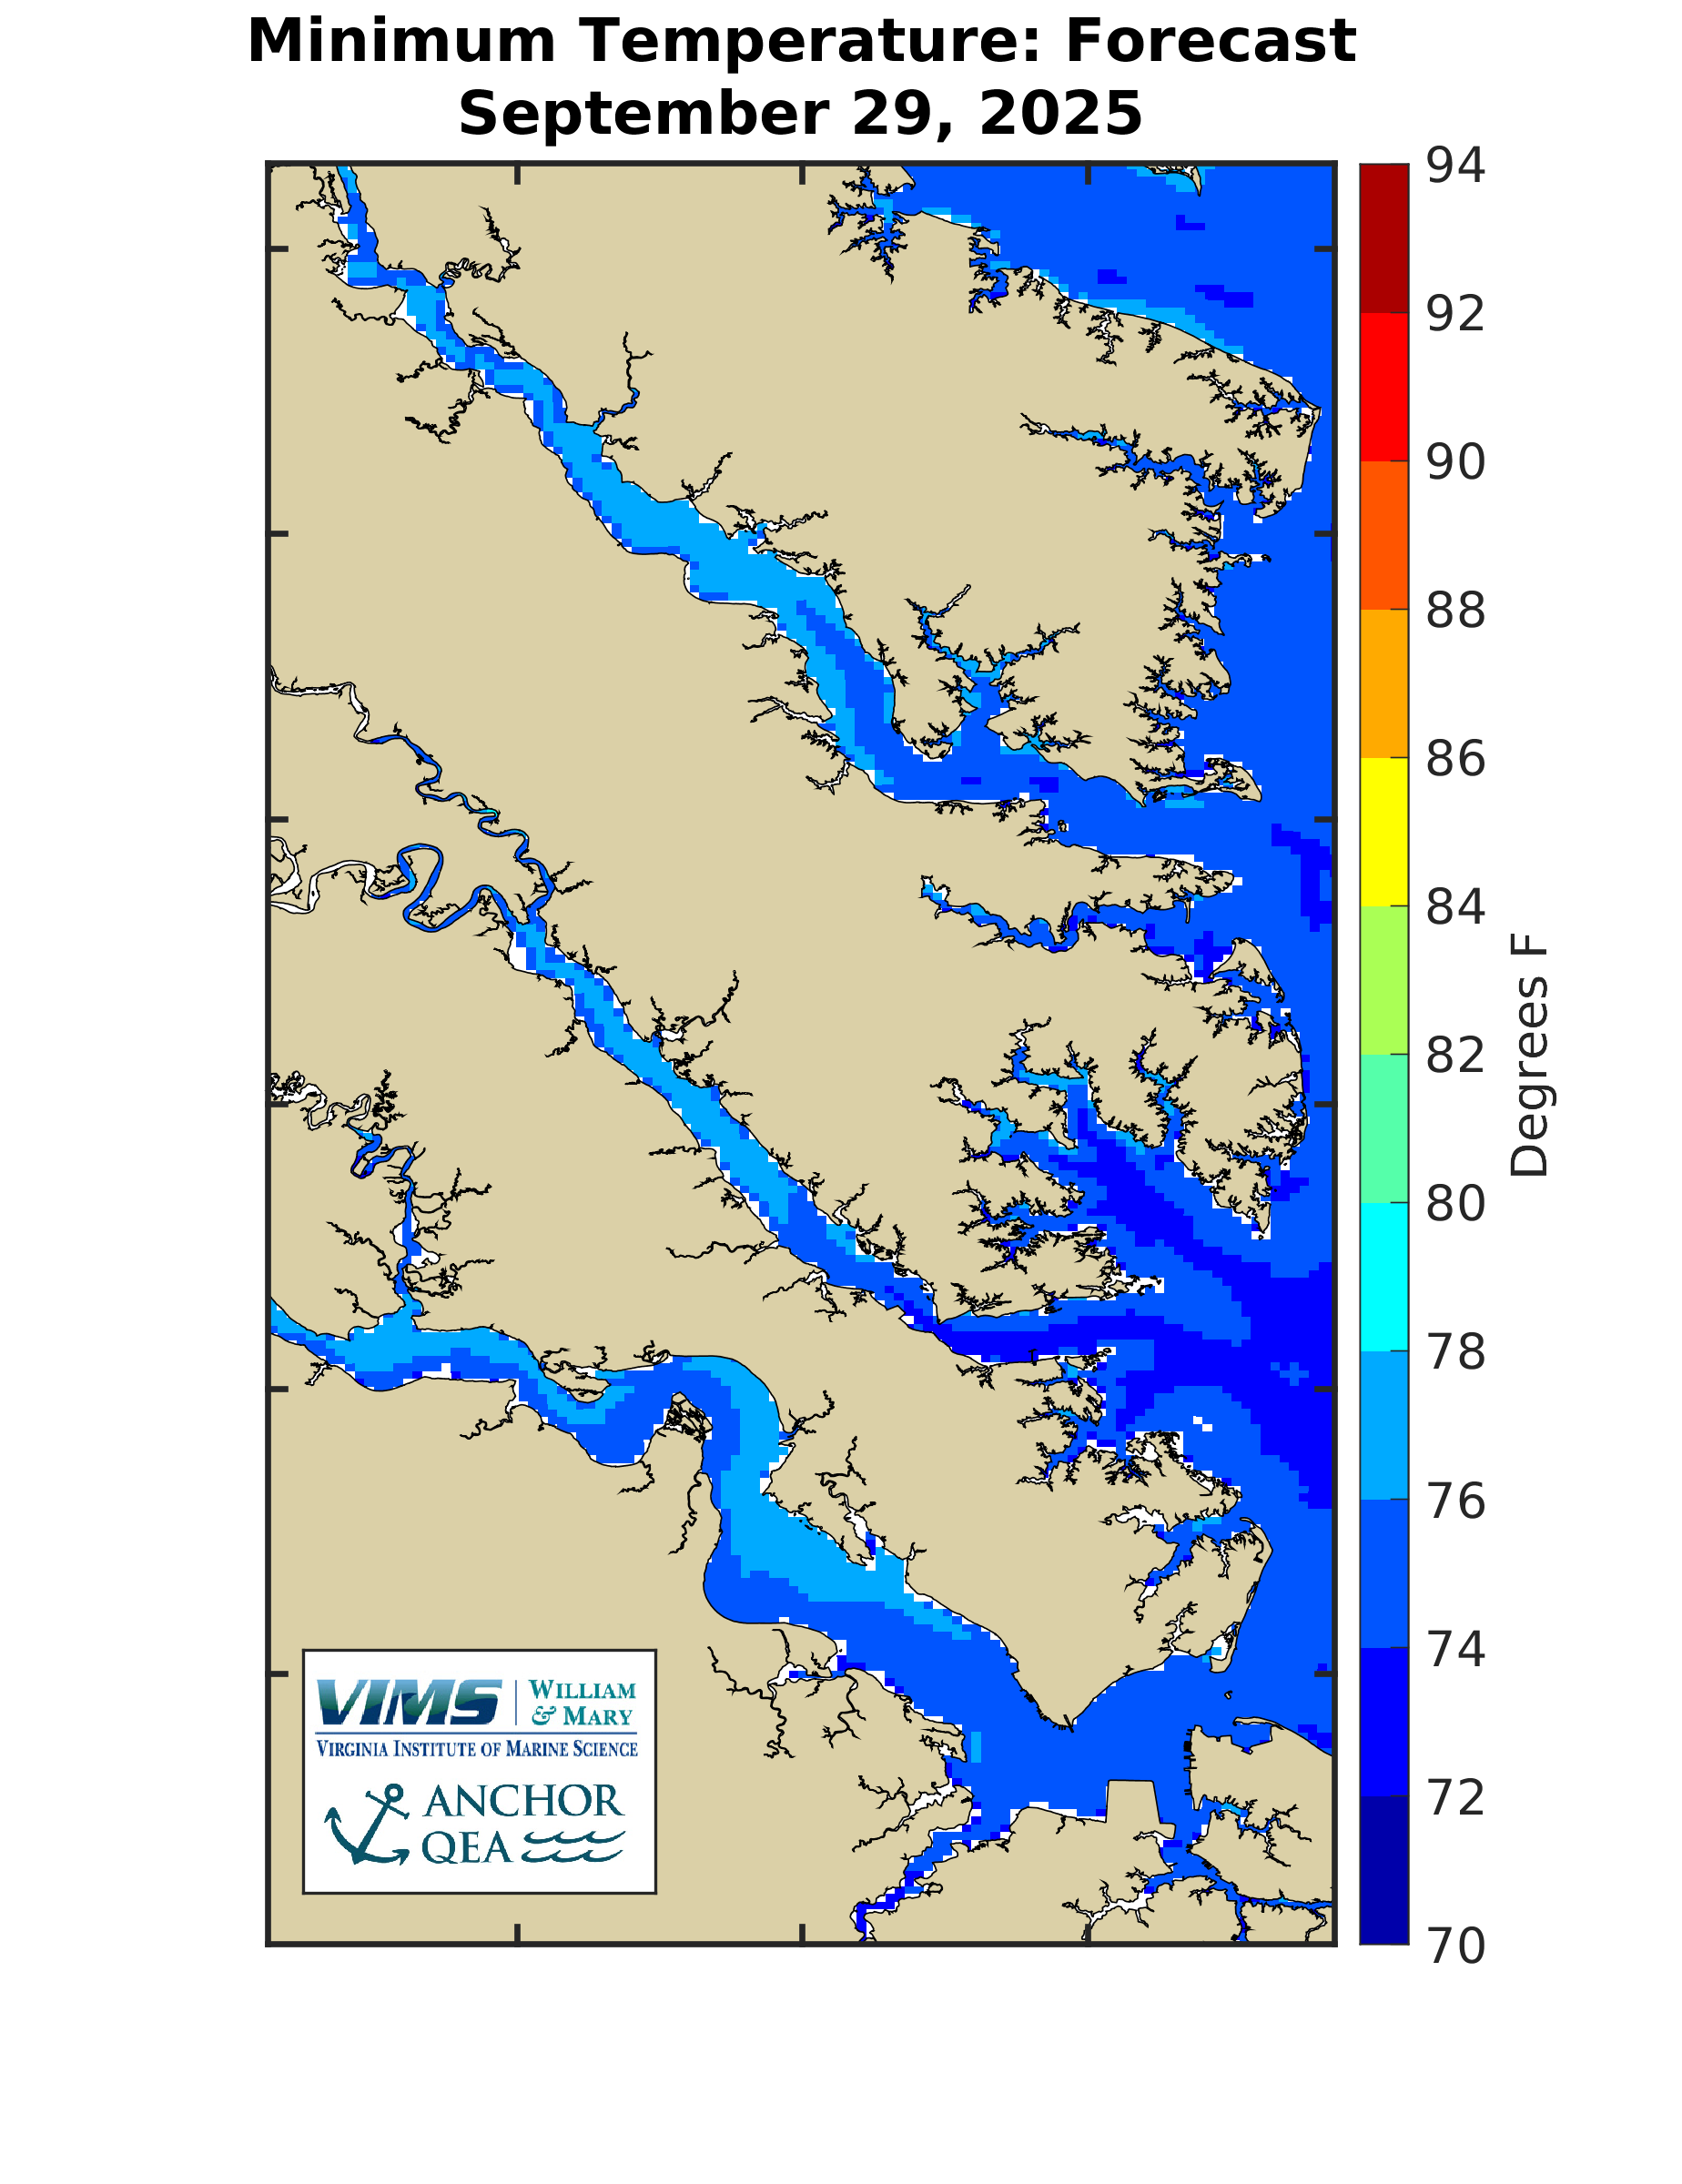
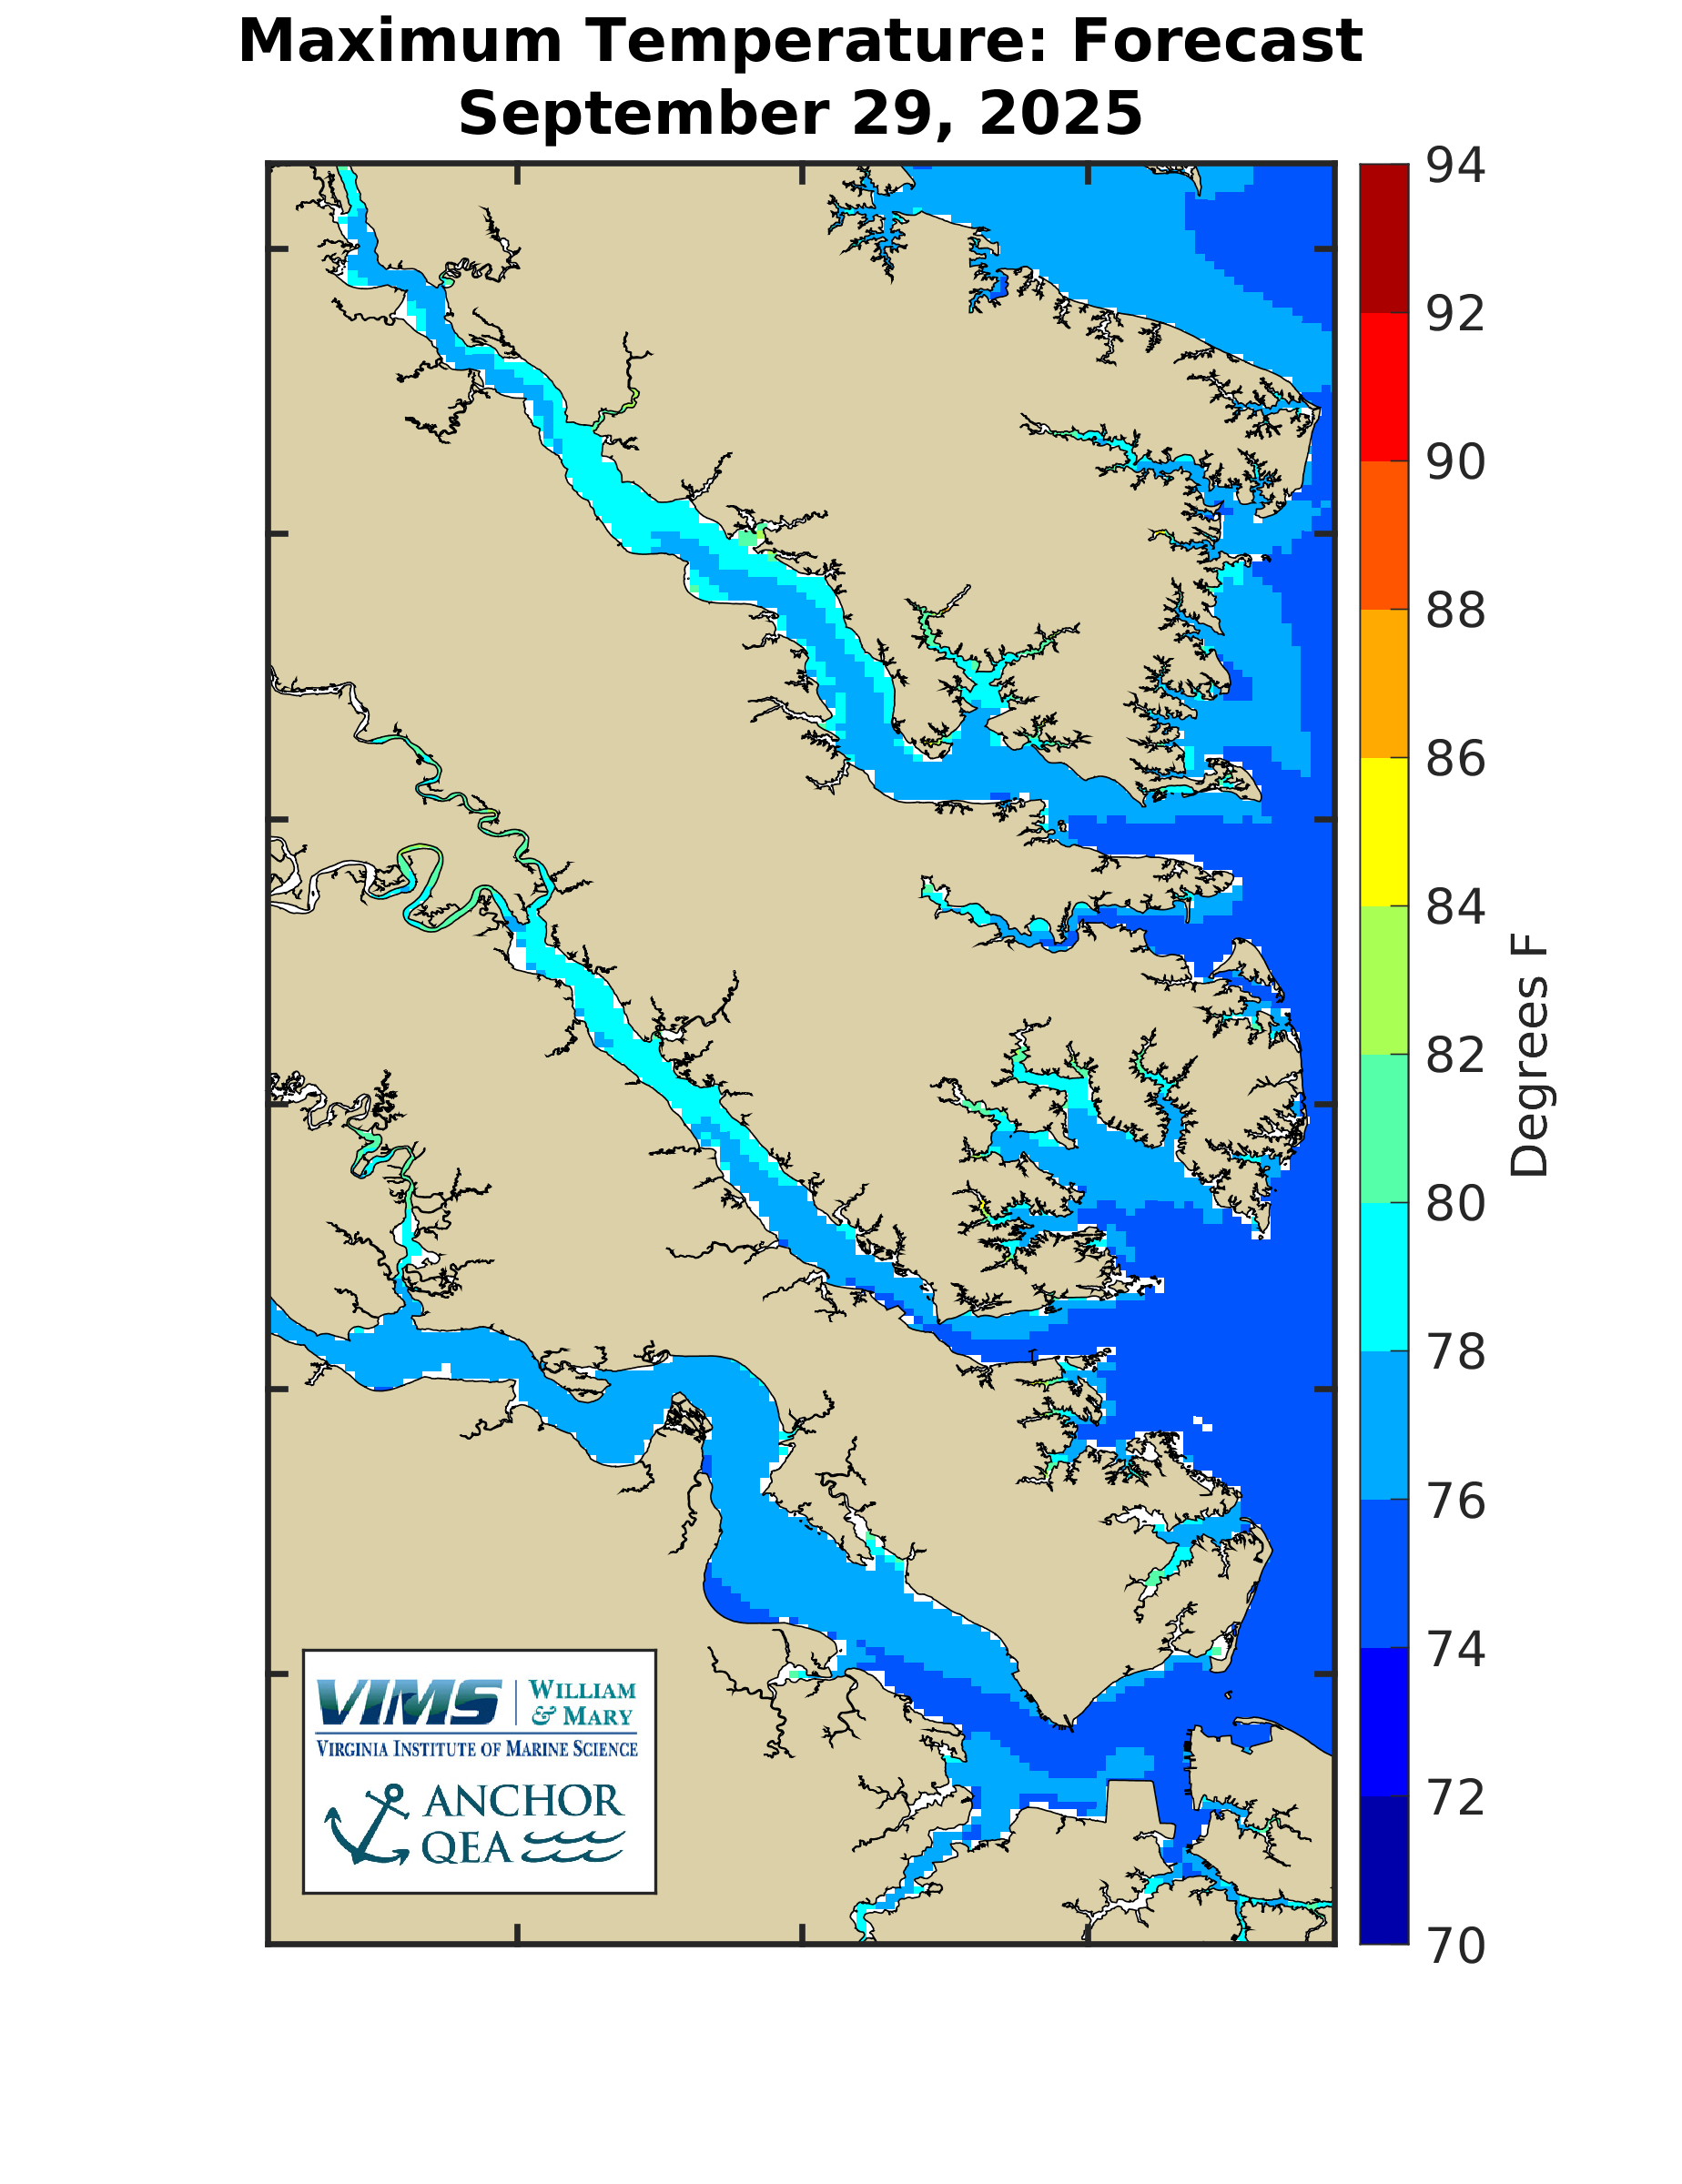
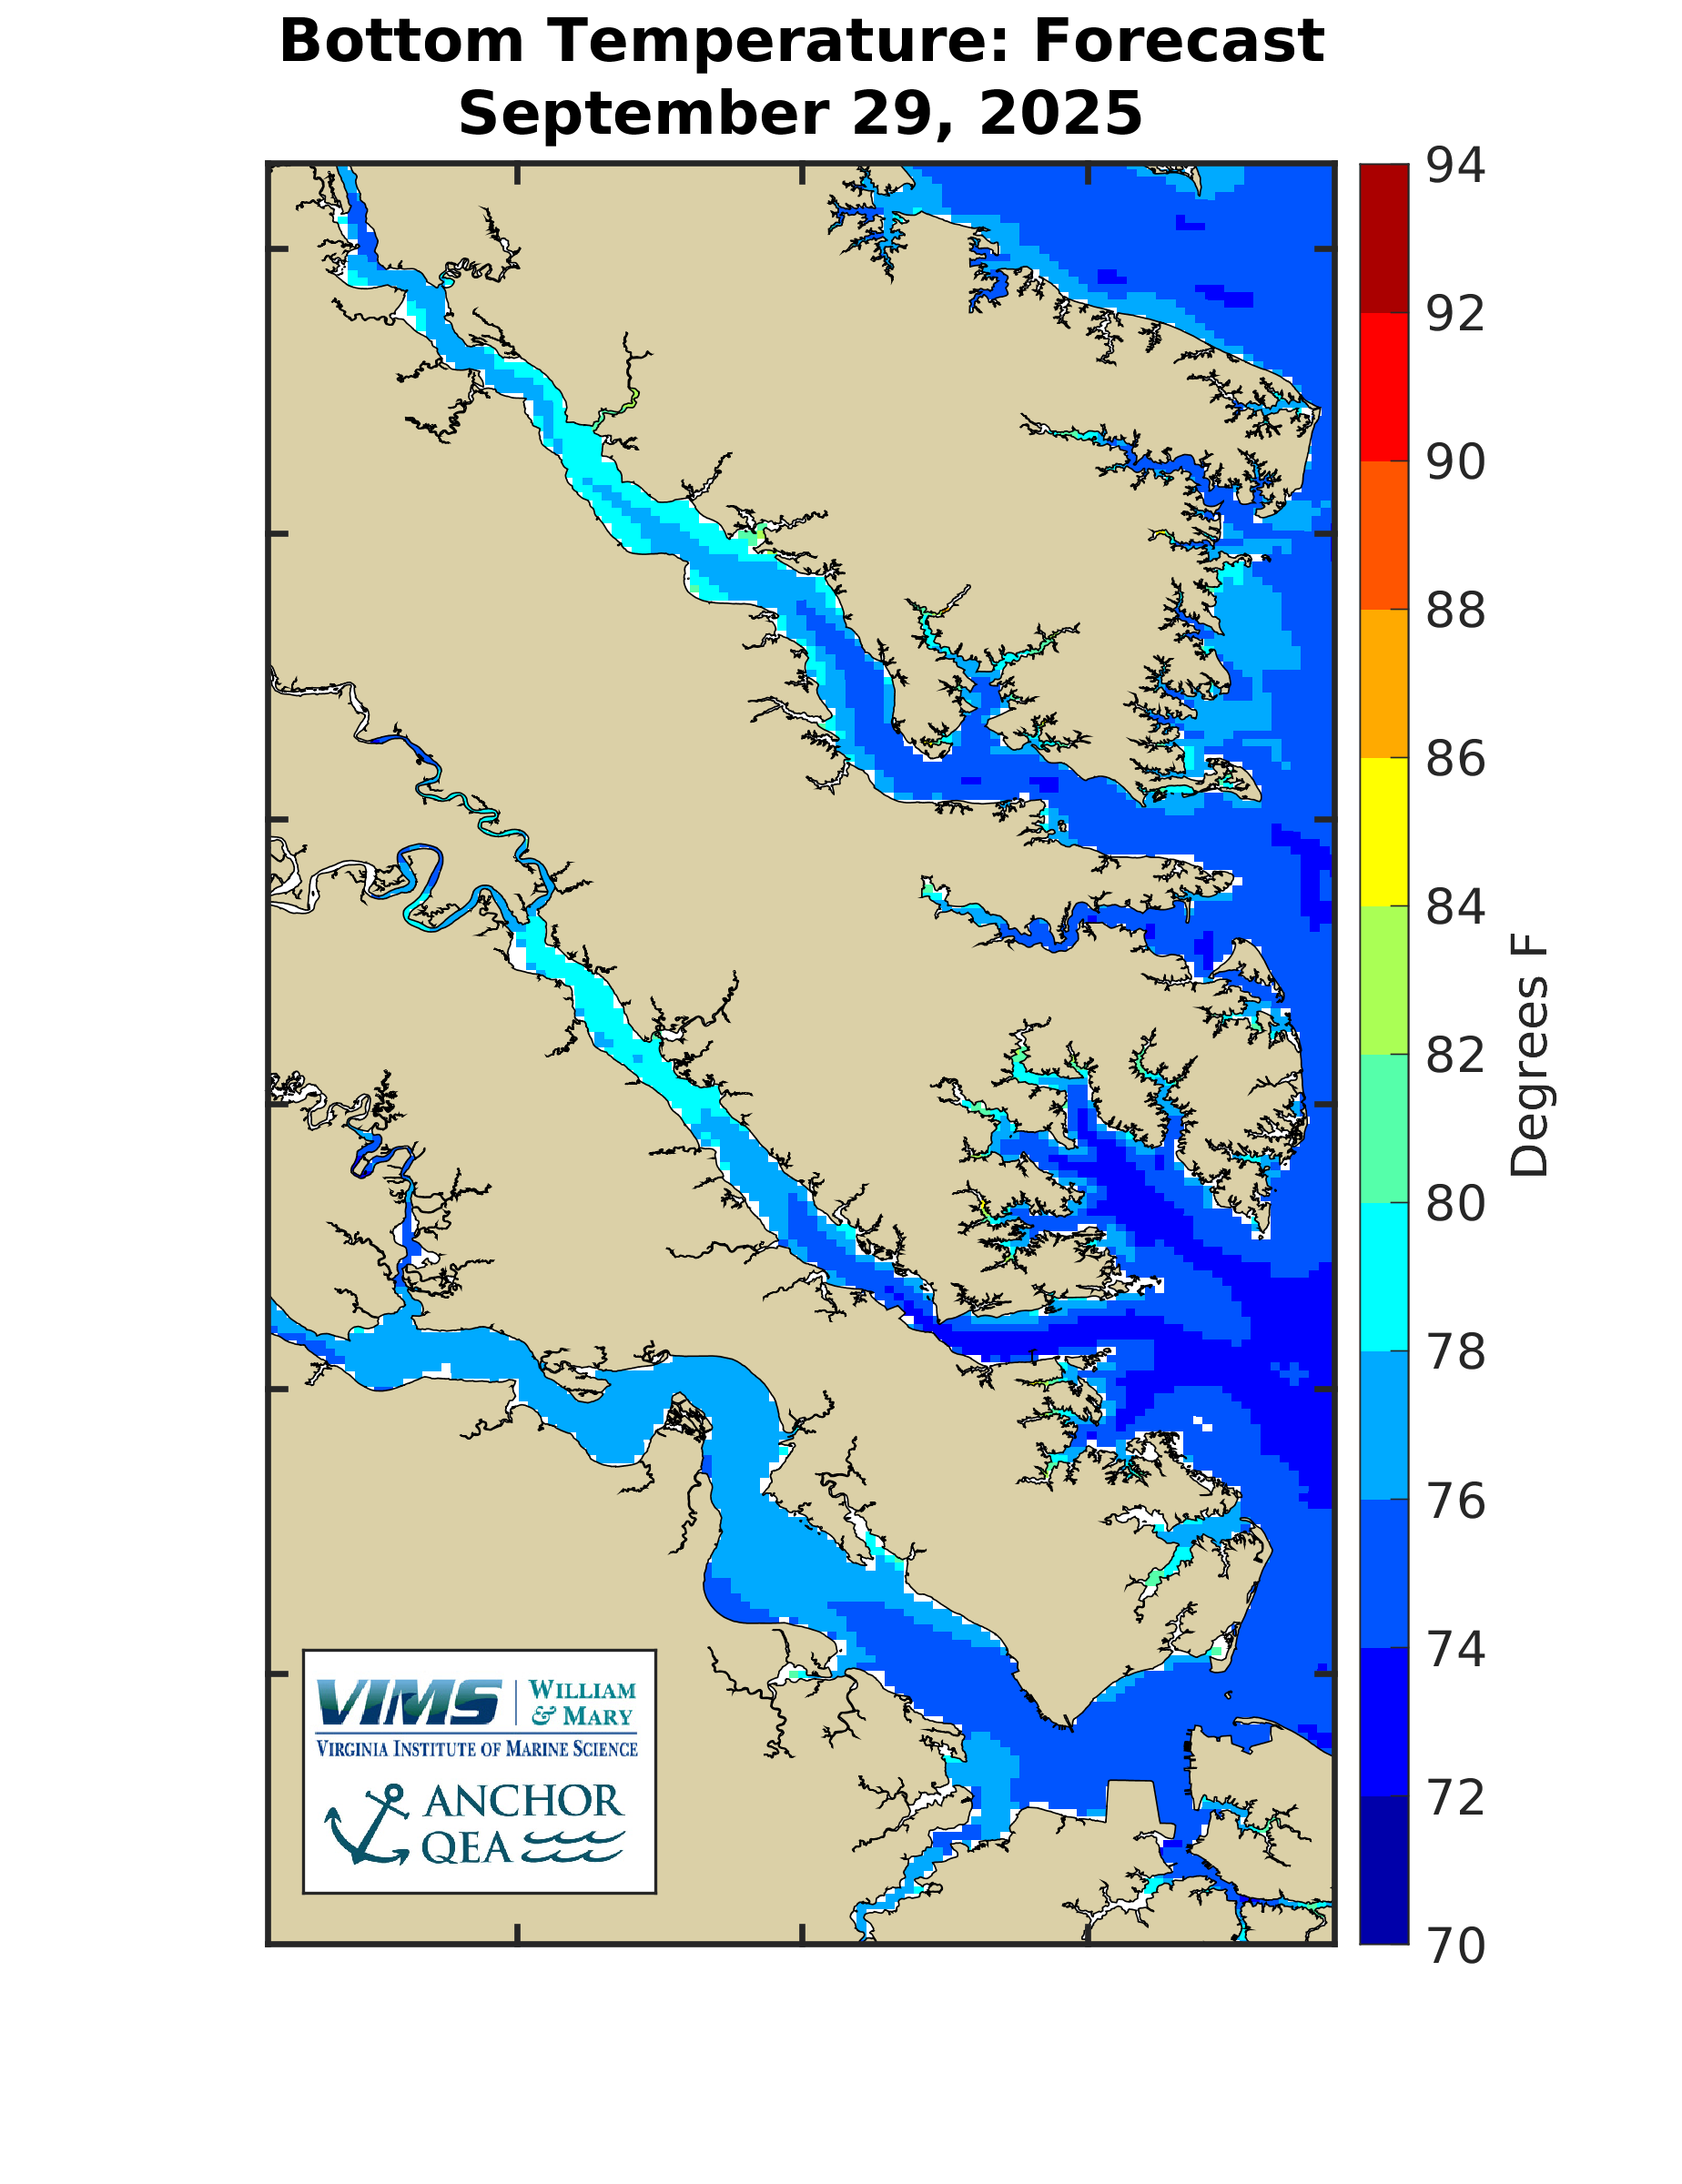
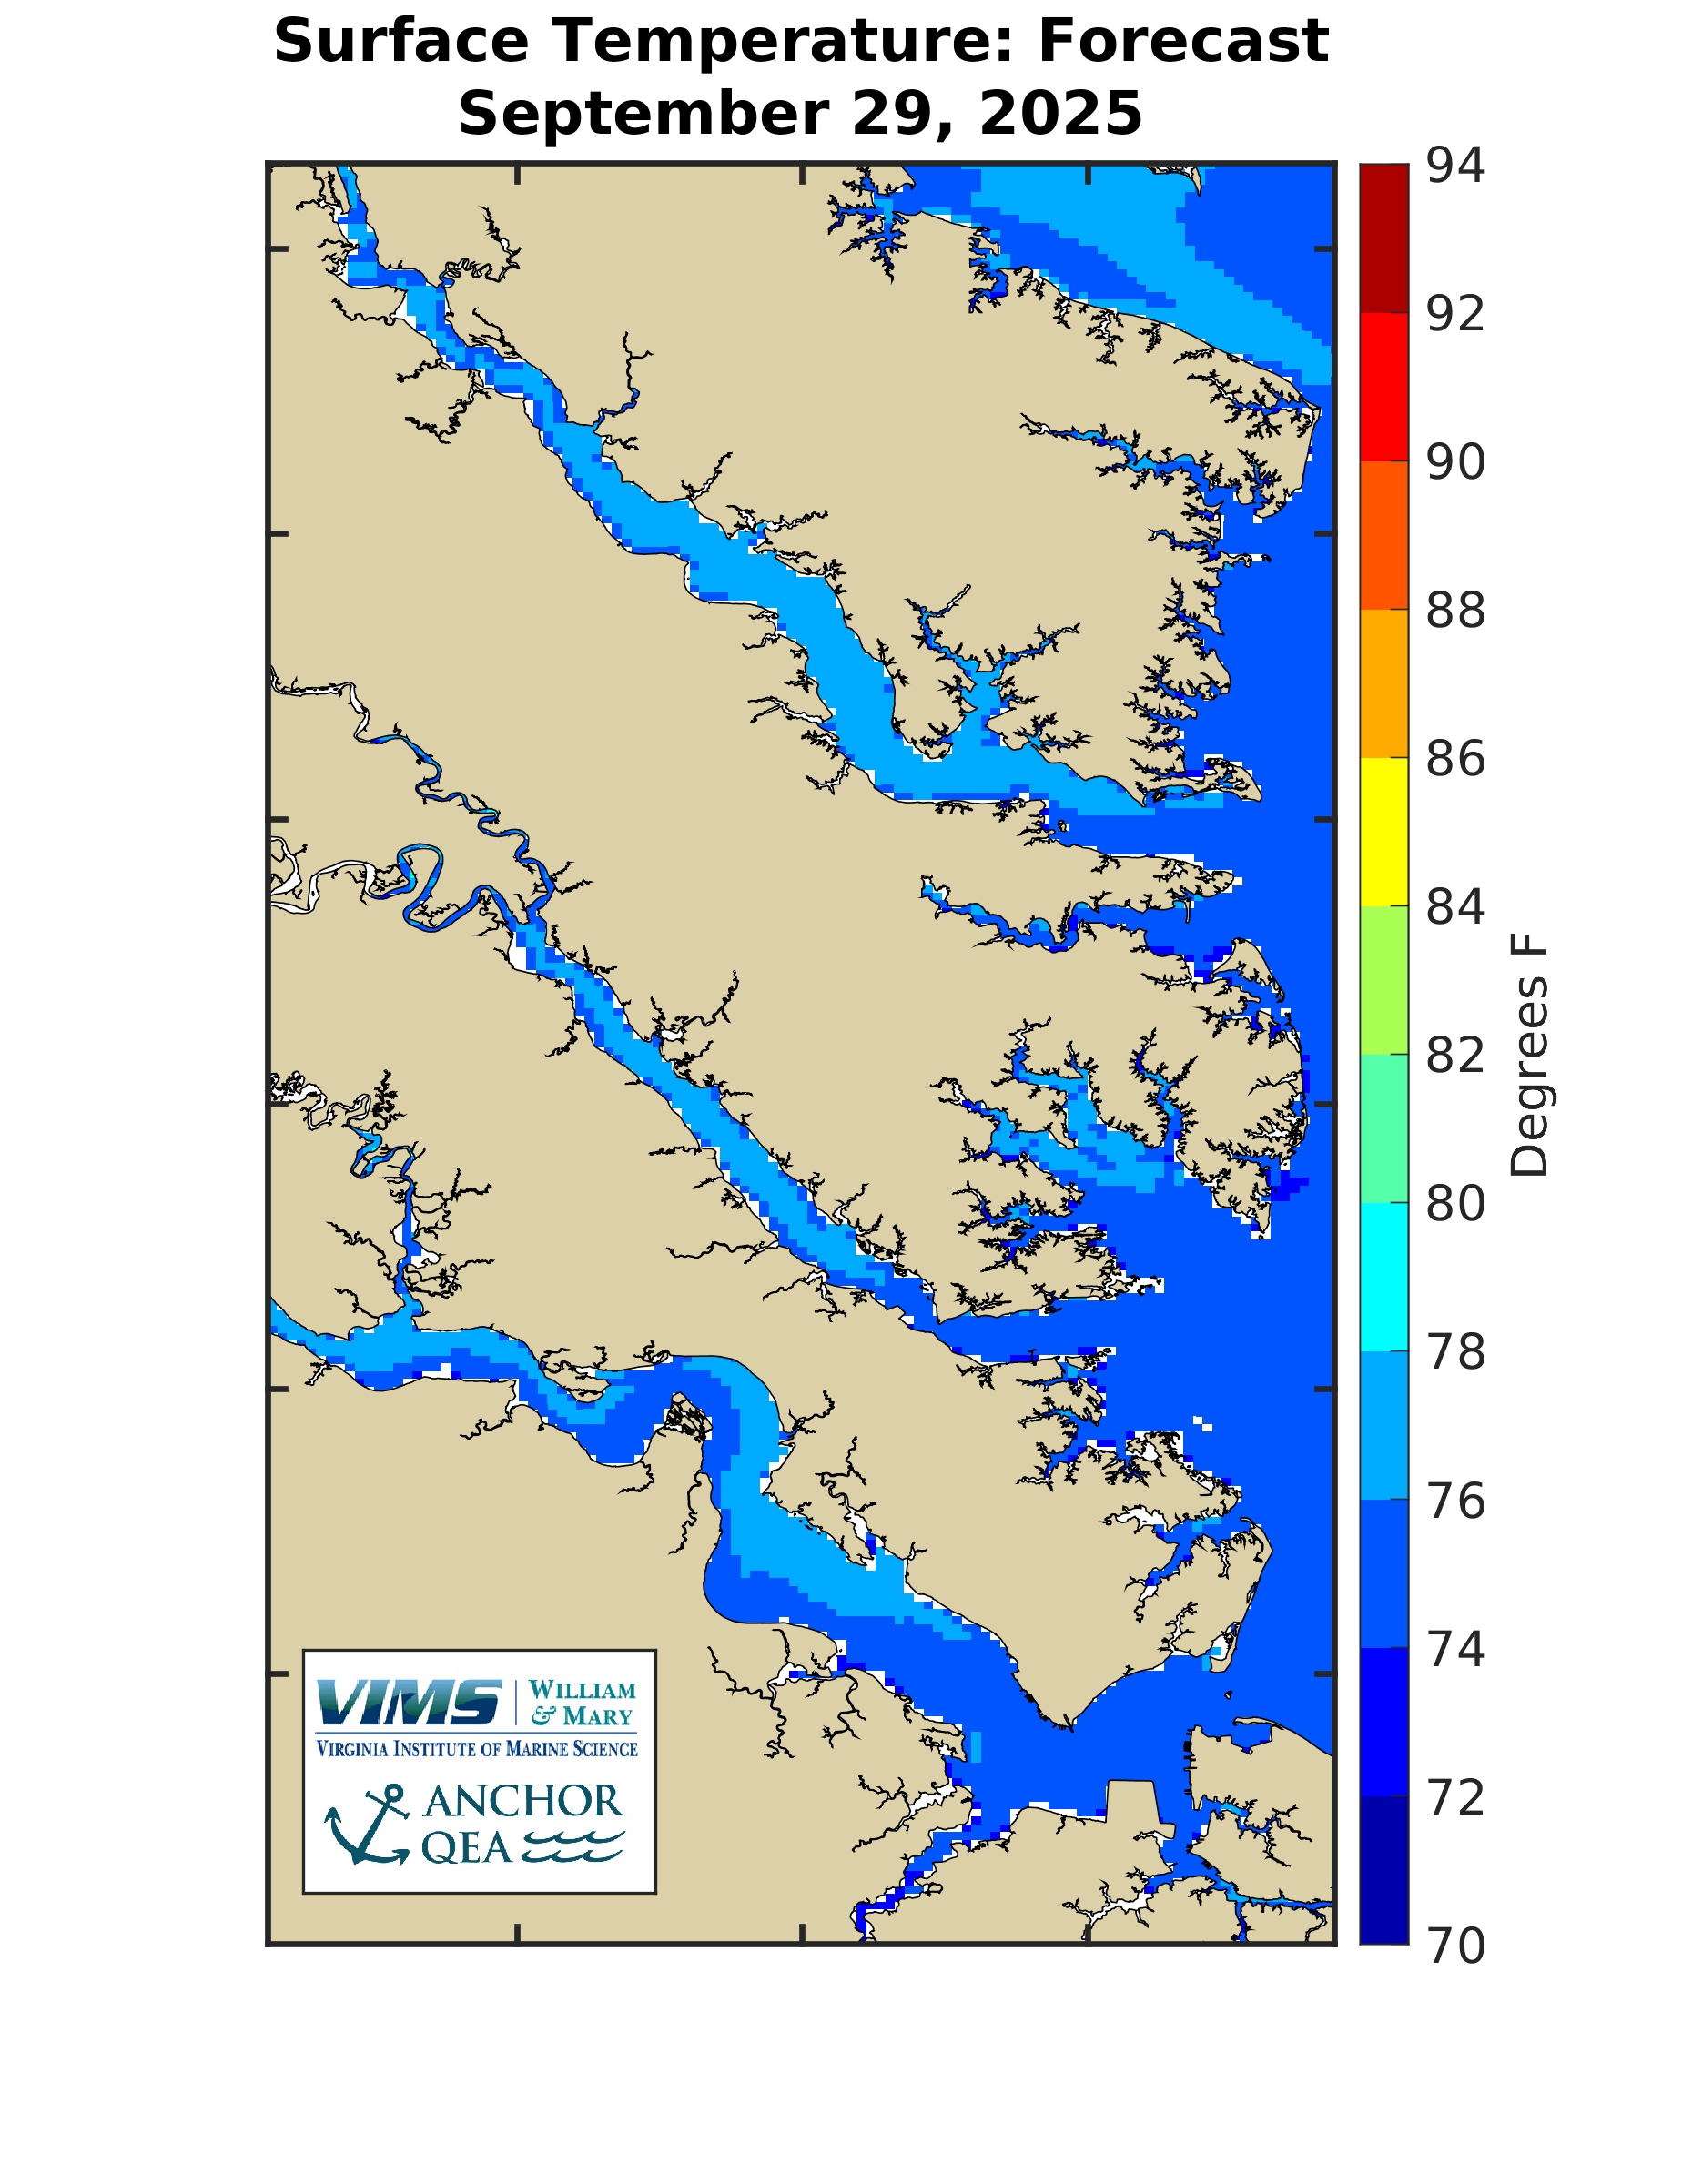
Water Temperature - Lower Chesapeake BayThese maps show the Nowcast, Forecast, and Trend in water temperature, with focus on the lower Chesapeake Bay. The maps use the surface and bottom daily-averaged water temperature. That is, the water temperature from the forecast model is daily-averaged and then both the surface and bottom water temperature are mapped. The forecast model is most accurate in the main portion of the Bay and the large tributaries. Water temperatures in smaller inlets may not be accurate.
|