Dissolved Oxygen Line Plots and Model-Data Comparison
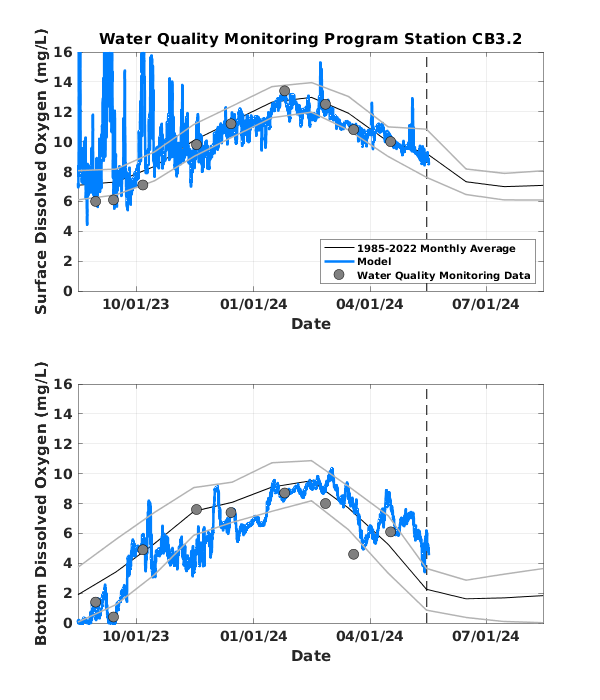
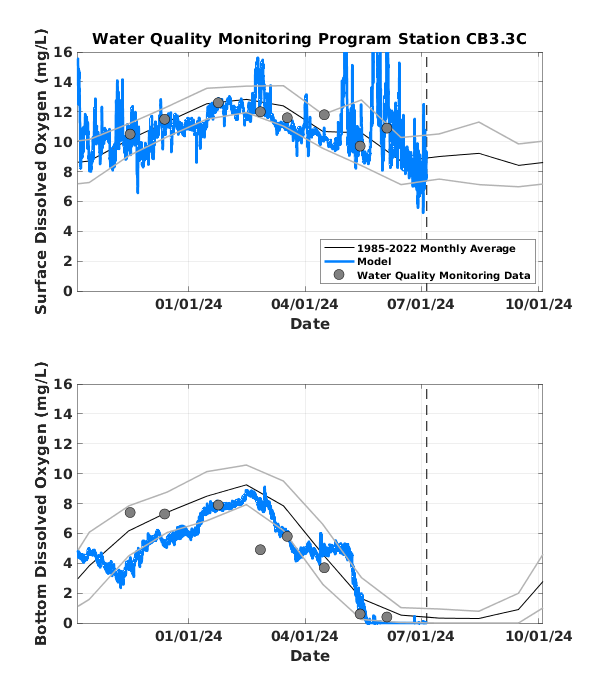
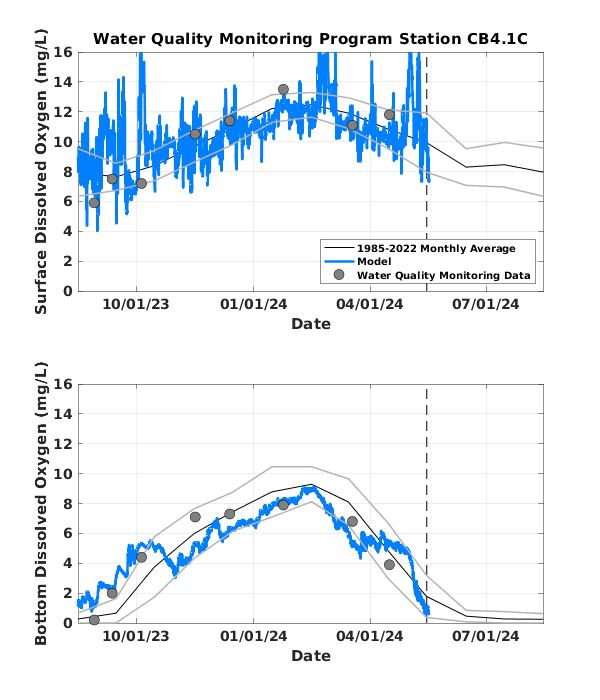
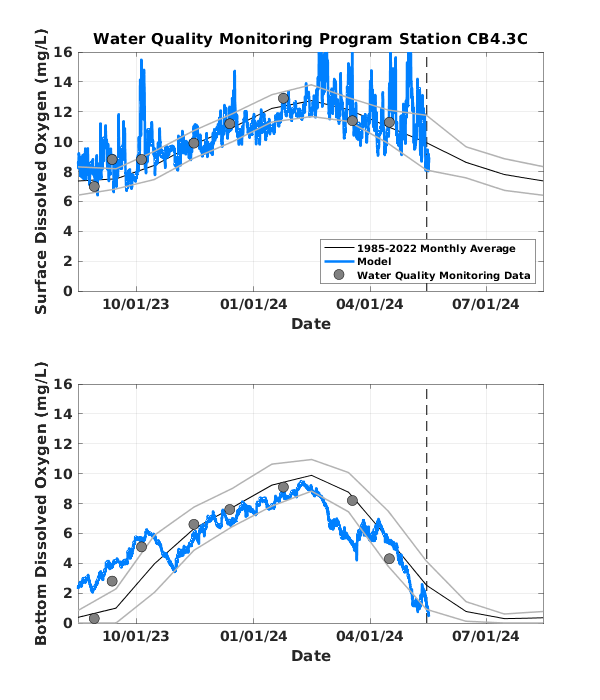
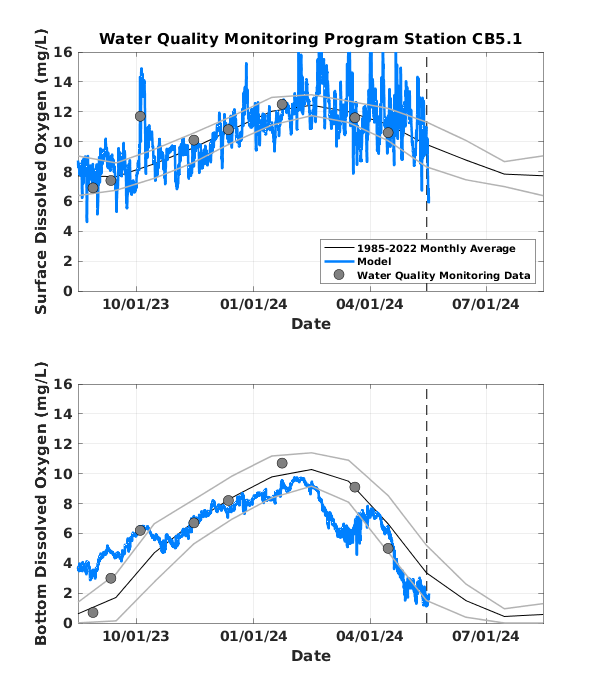
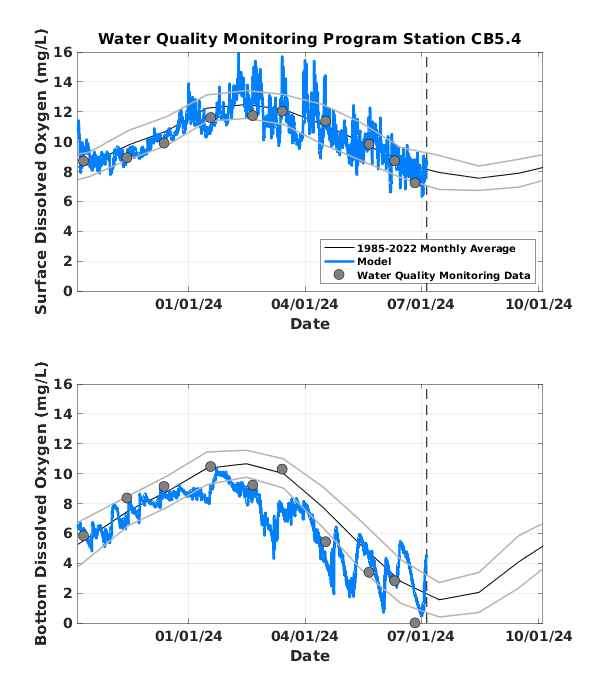
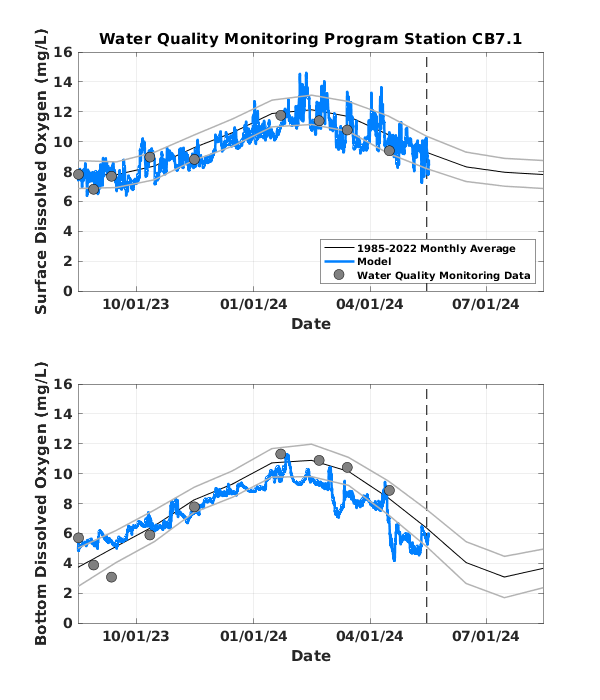
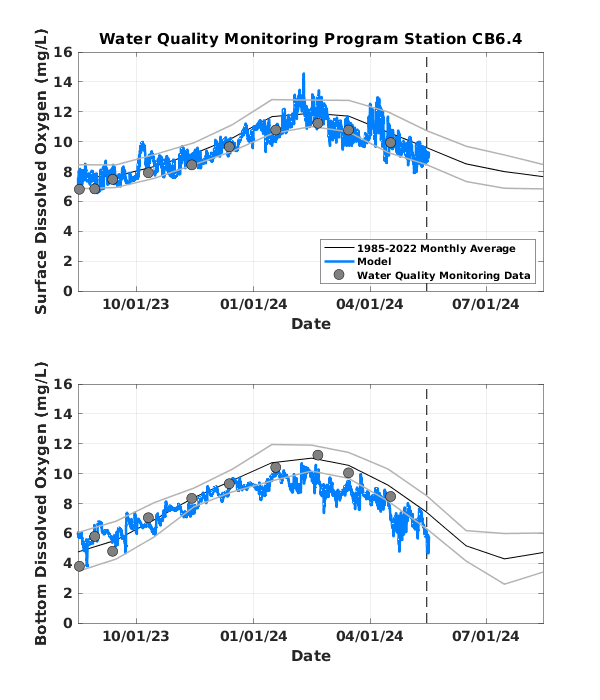
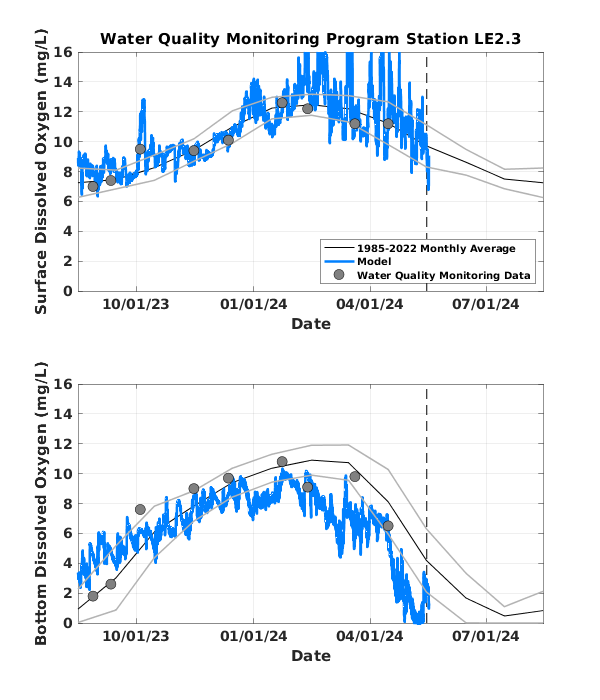
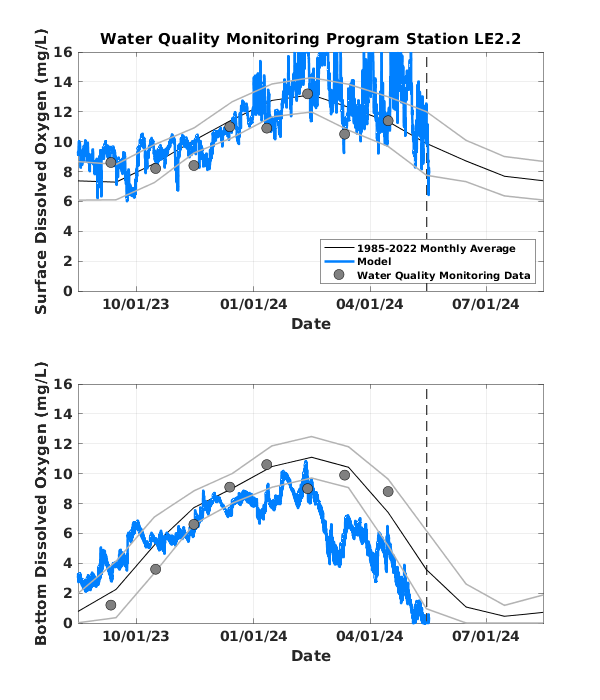
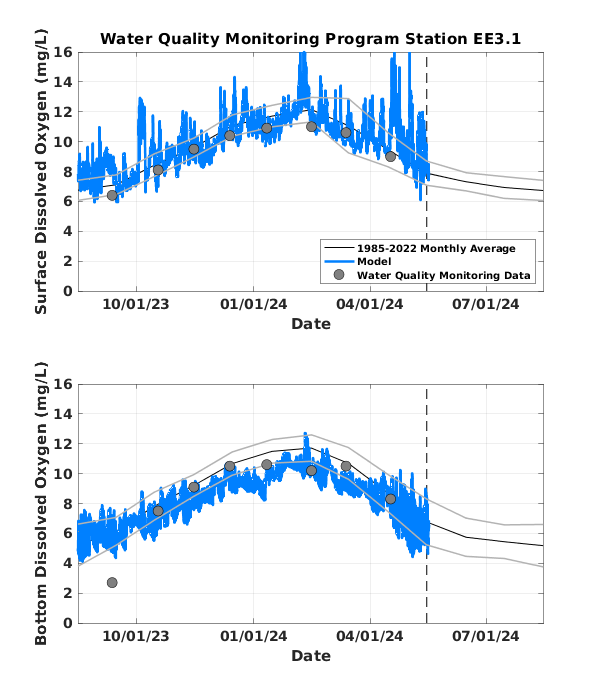
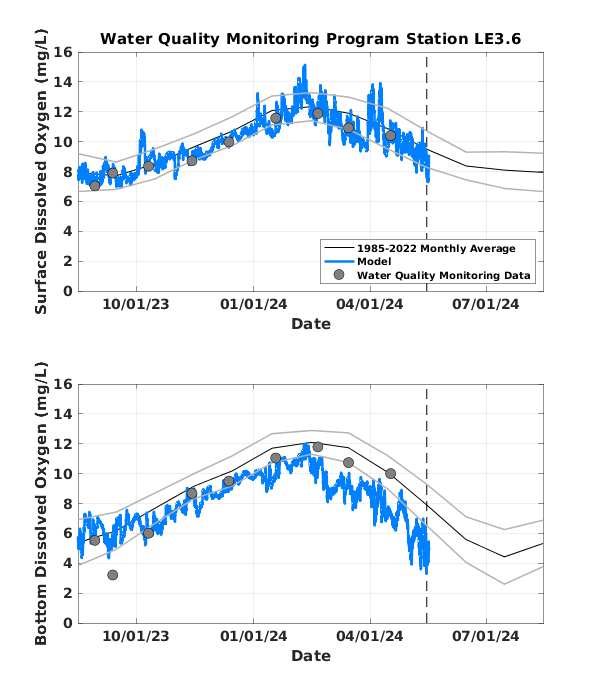
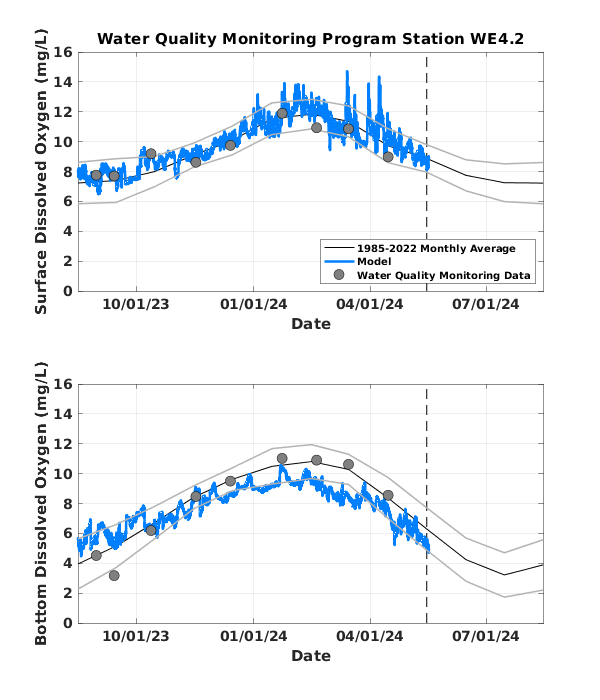
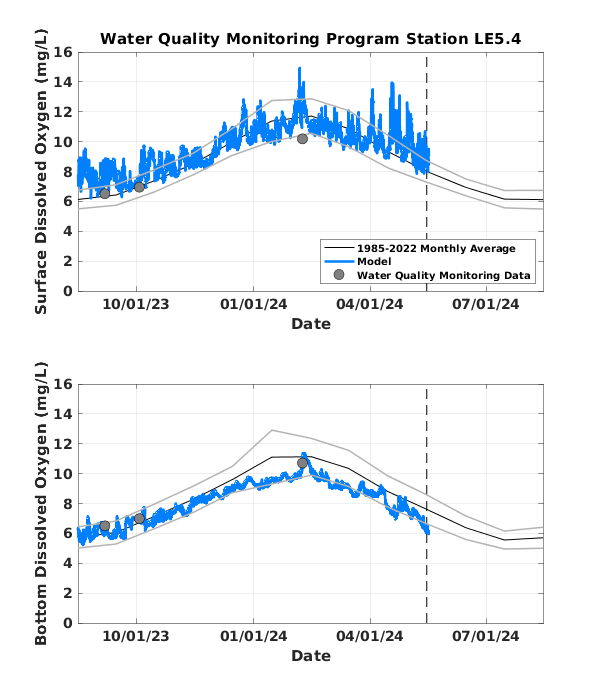
Quick summaryDissolved oxygen can be viewed through time at select locations to understand the seasonal cycle and shorter-term weather-related impacts on dissolved oxygen in the Chesapeake Bay. Overlaying the modeled dissolved oxygen on top of long-term averages from observed data shows how the forecasted dissolved oxygen compares to the historical average. On the below line plots, the dark black line is the long-term monthly average from the Water Quality Monitoring Program data and the gray lines are one standard deviation above and below the average. The gray lines represent the bounds in which about 68% of the Water Quality Monitoring Program data falls within. The gray circles represent Water Quality Monitoring Program data collected at a specific day and time. |
------------------------------------------------------------------------------------------------------
------------------------------------------------------------------------------------------------------
------------------------------------------------------------------------------------------------------
------------------------------------------------------------------------------------------------------
------------------------------------------------------------------------------------------------------
------------------------------------------------------------------------------------------------------
------------------------------------------------------------------------------------------------------
------------------------------------------------------------------------------------------------------
------------------------------------------------------------------------------------------------------
------------------------------------------------------------------------------------------------------
------------------------------------------------------------------------------------------------------
------------------------------------------------------------------------------------------------------
------------------------------------------------------------------------------------------------------
*Gray lines show one standard deviation above and below the average.