Chesapeake Bay Waves
Waves are forecast by the Chesapeake Bay Environmental Forecast System throughout the Chesapeake Bay and some of the nearshore coastal waters. The wave model incorporates open-ocean waves from a large-scale East Coast model and uses high-resolution winds over the Chesapeake Bay to forecast wave heights. Waves are being used to help improve the forecasting of dissolved oxygen in the Bay because waves can lift organic matter and sediment off the seabed back into the water. Wave height may be underpredicted in and around localized thunderstorms and as waves shoal near beaches. Please also see the disclaimer at the bottom of the page.
Wave forecasts are available as maps and as line plots. The line plots compare the modeled waves to observed waves at various locations around the Bay.
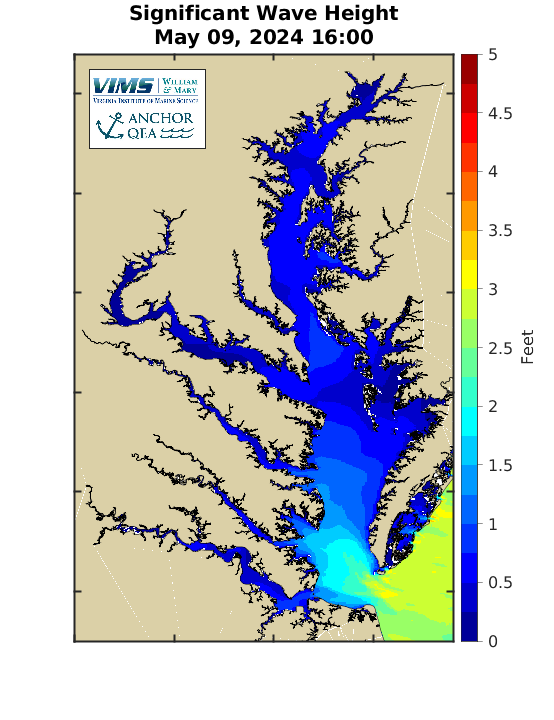
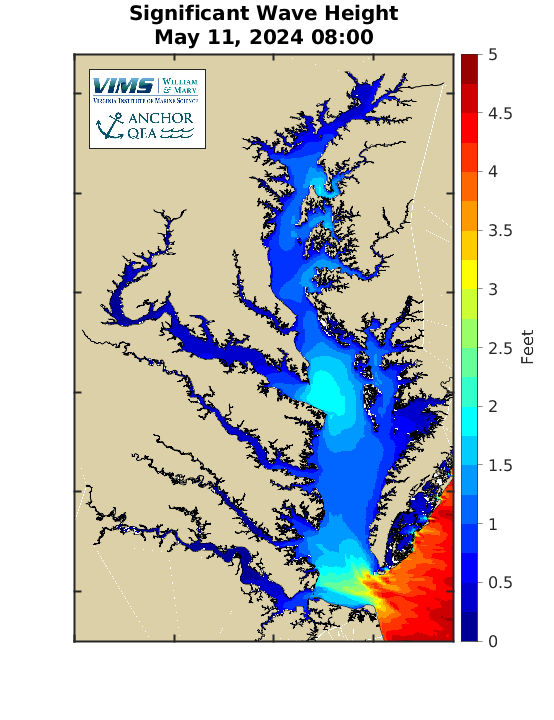
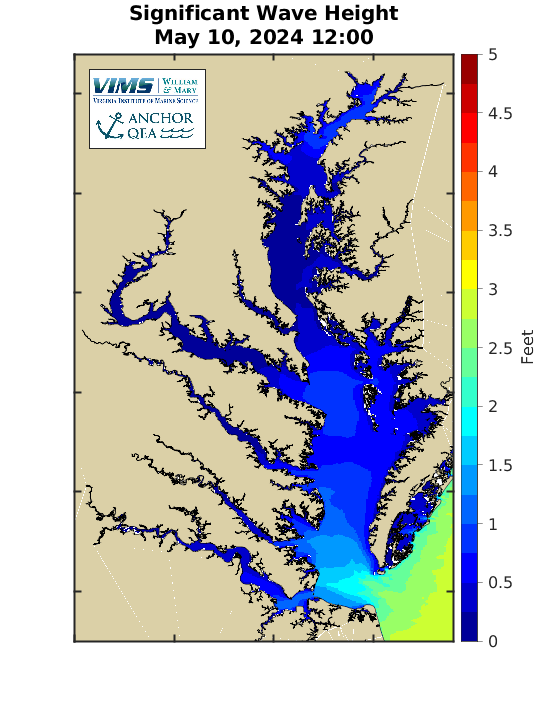
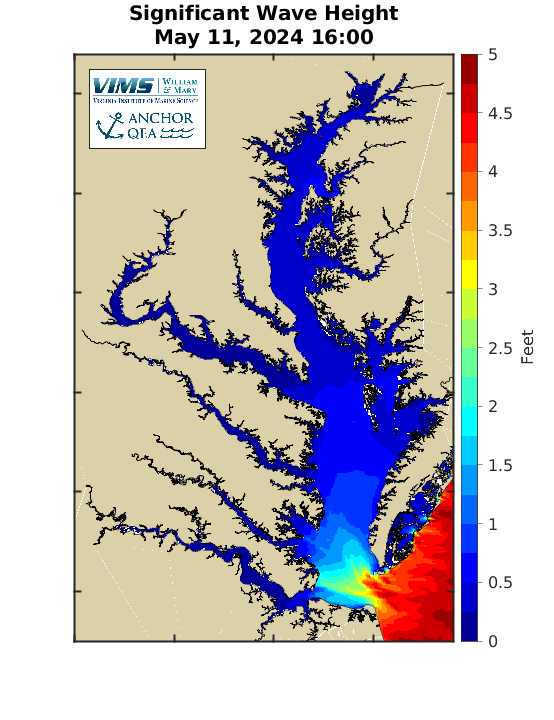
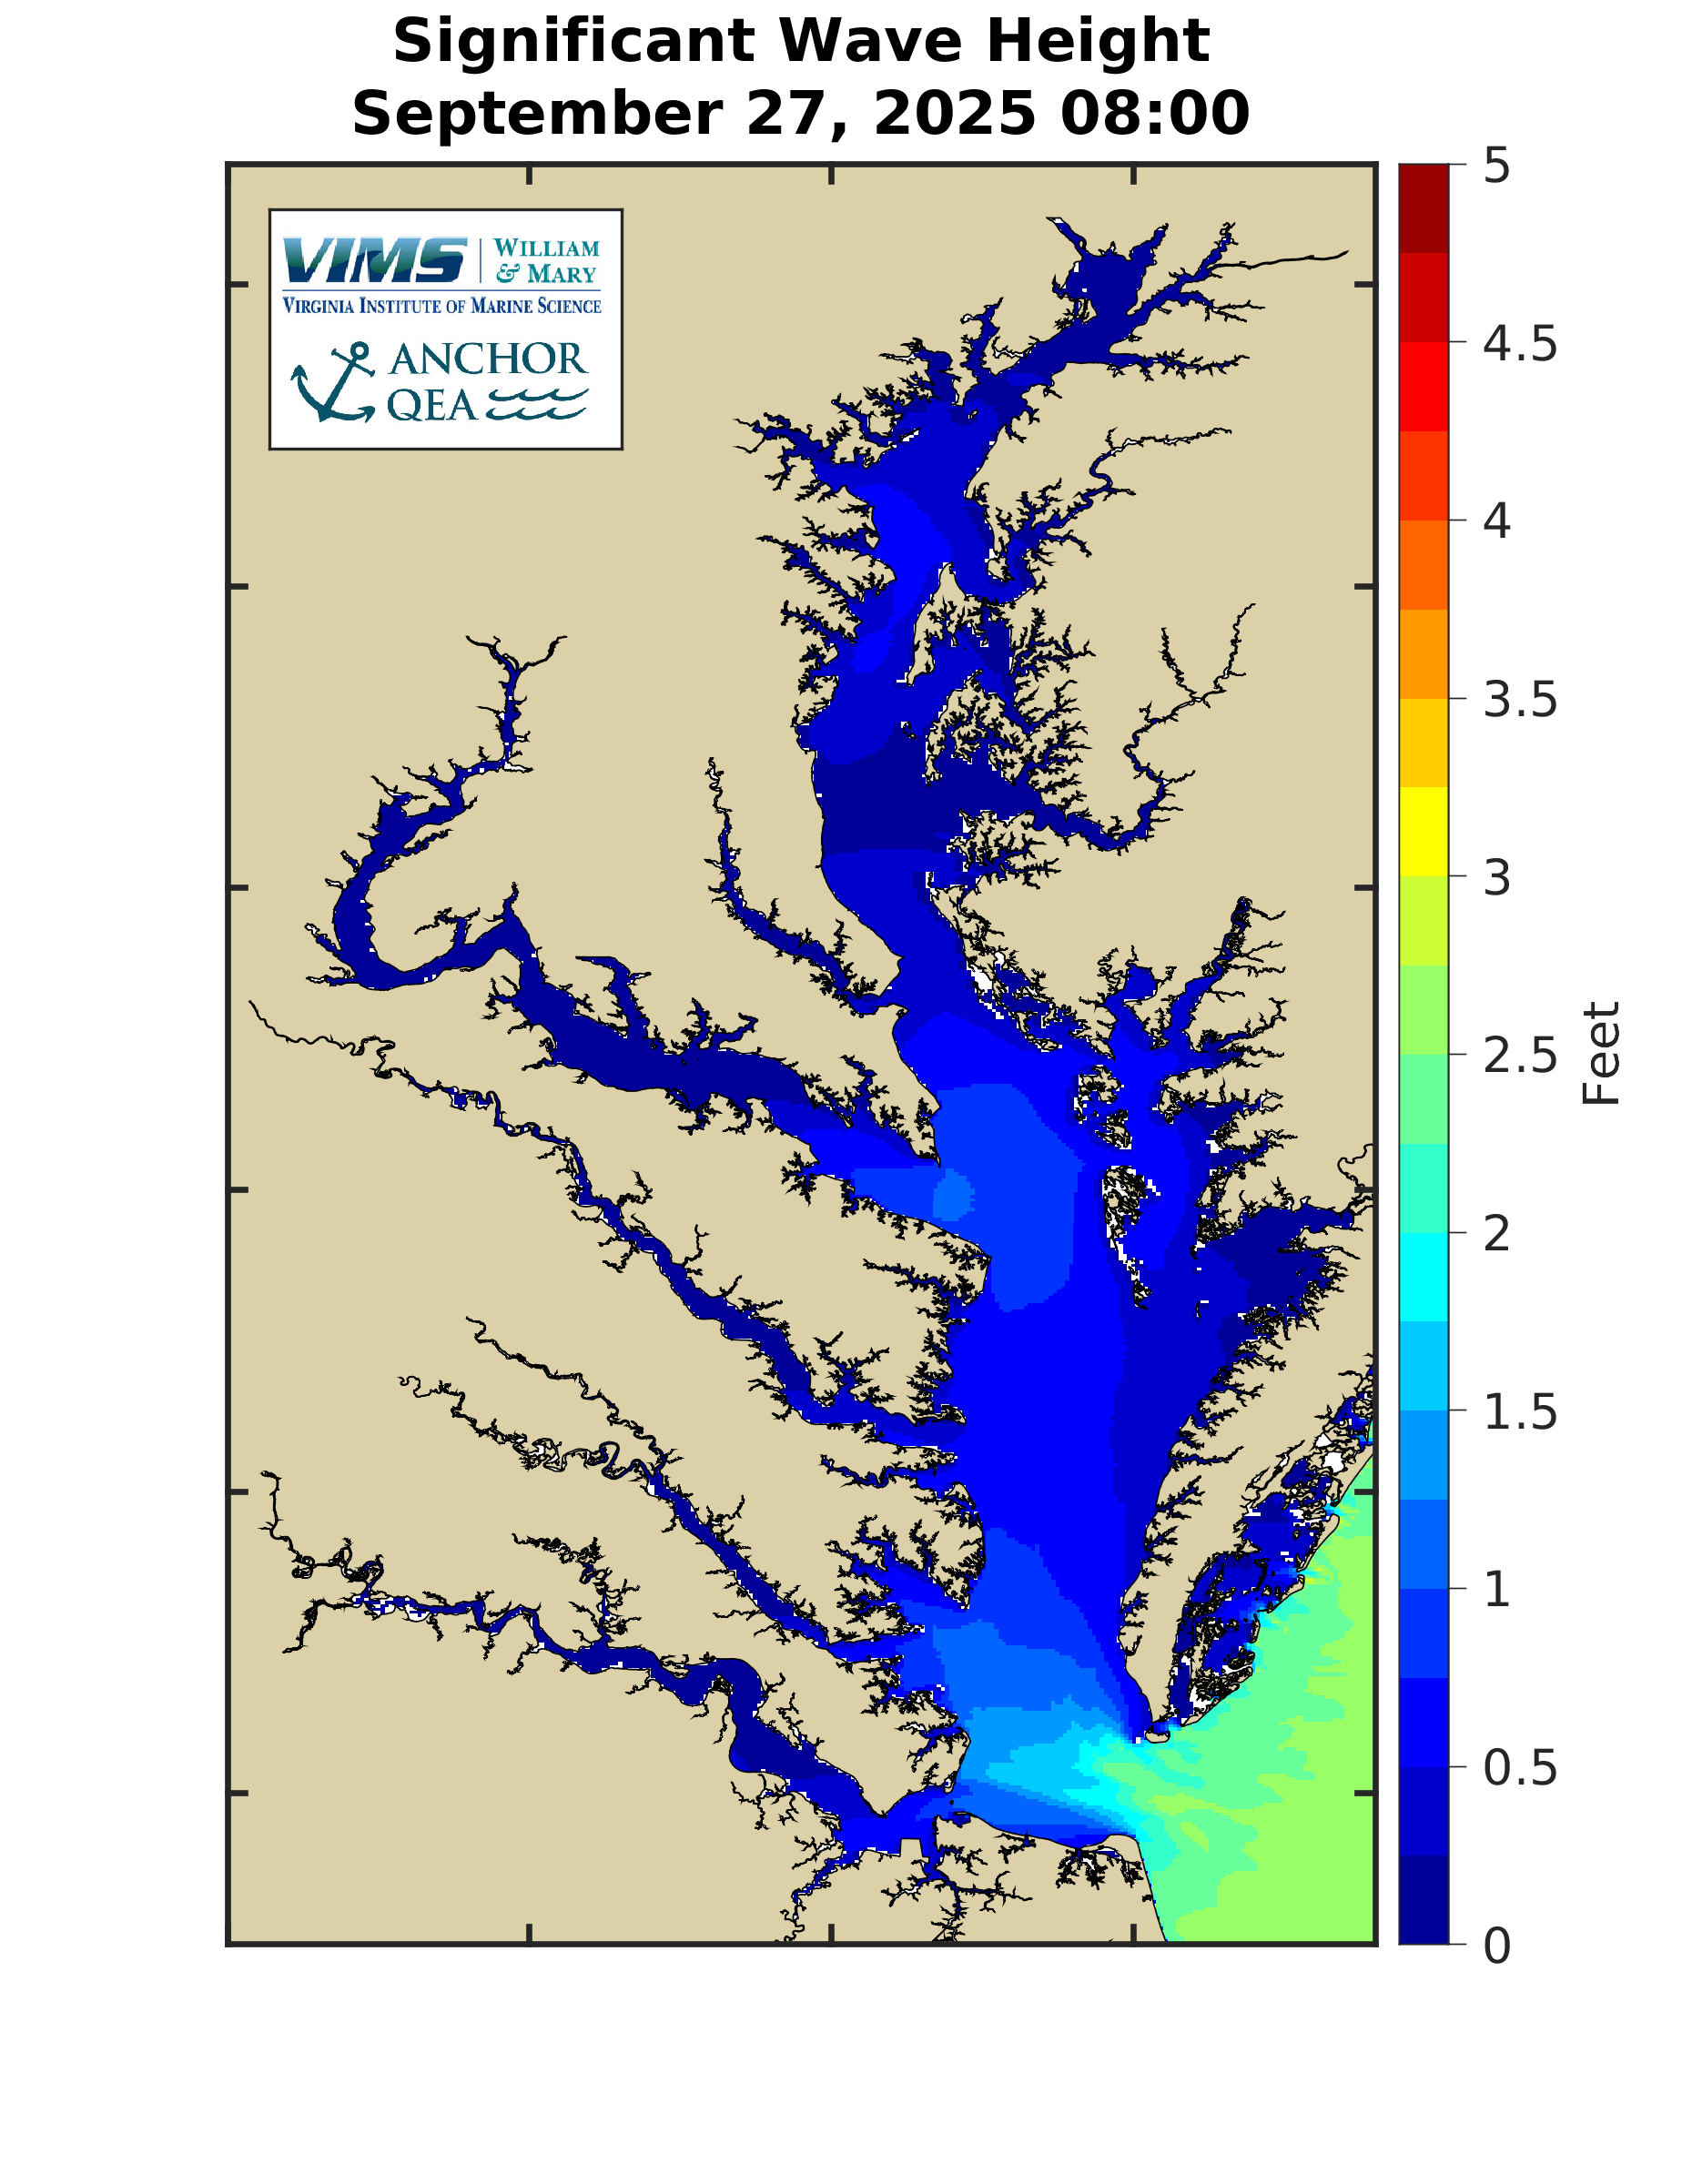
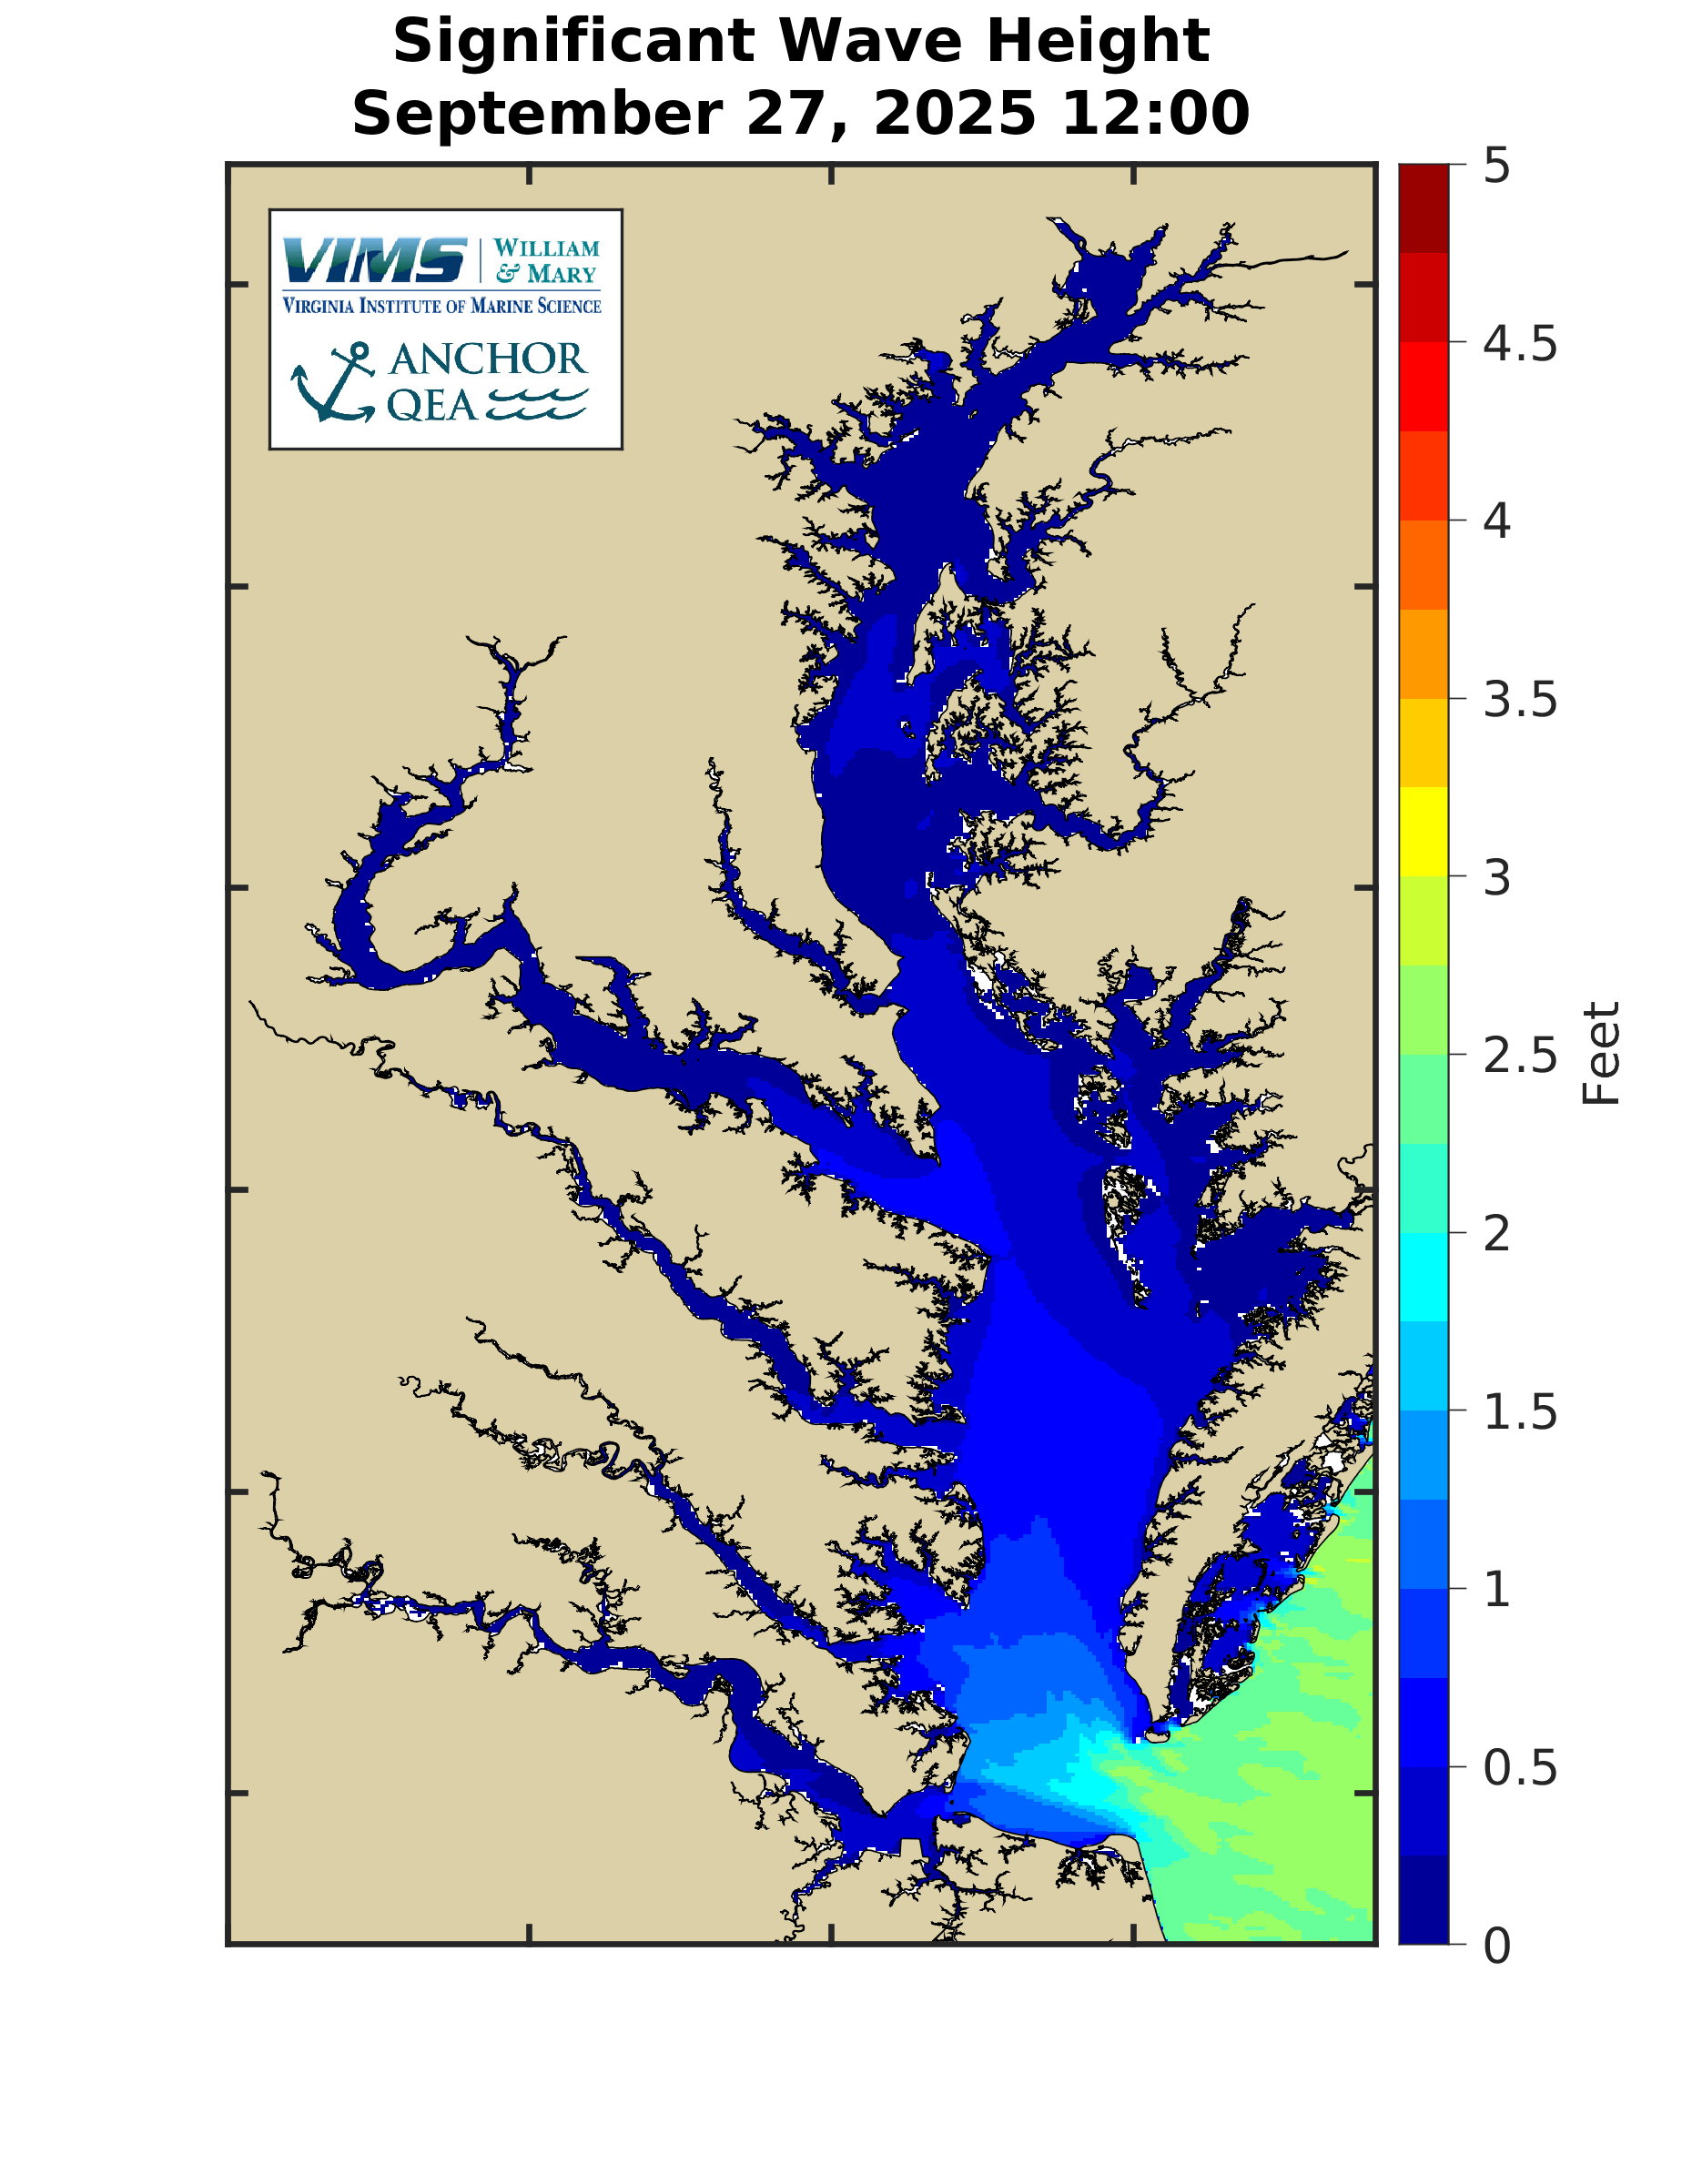
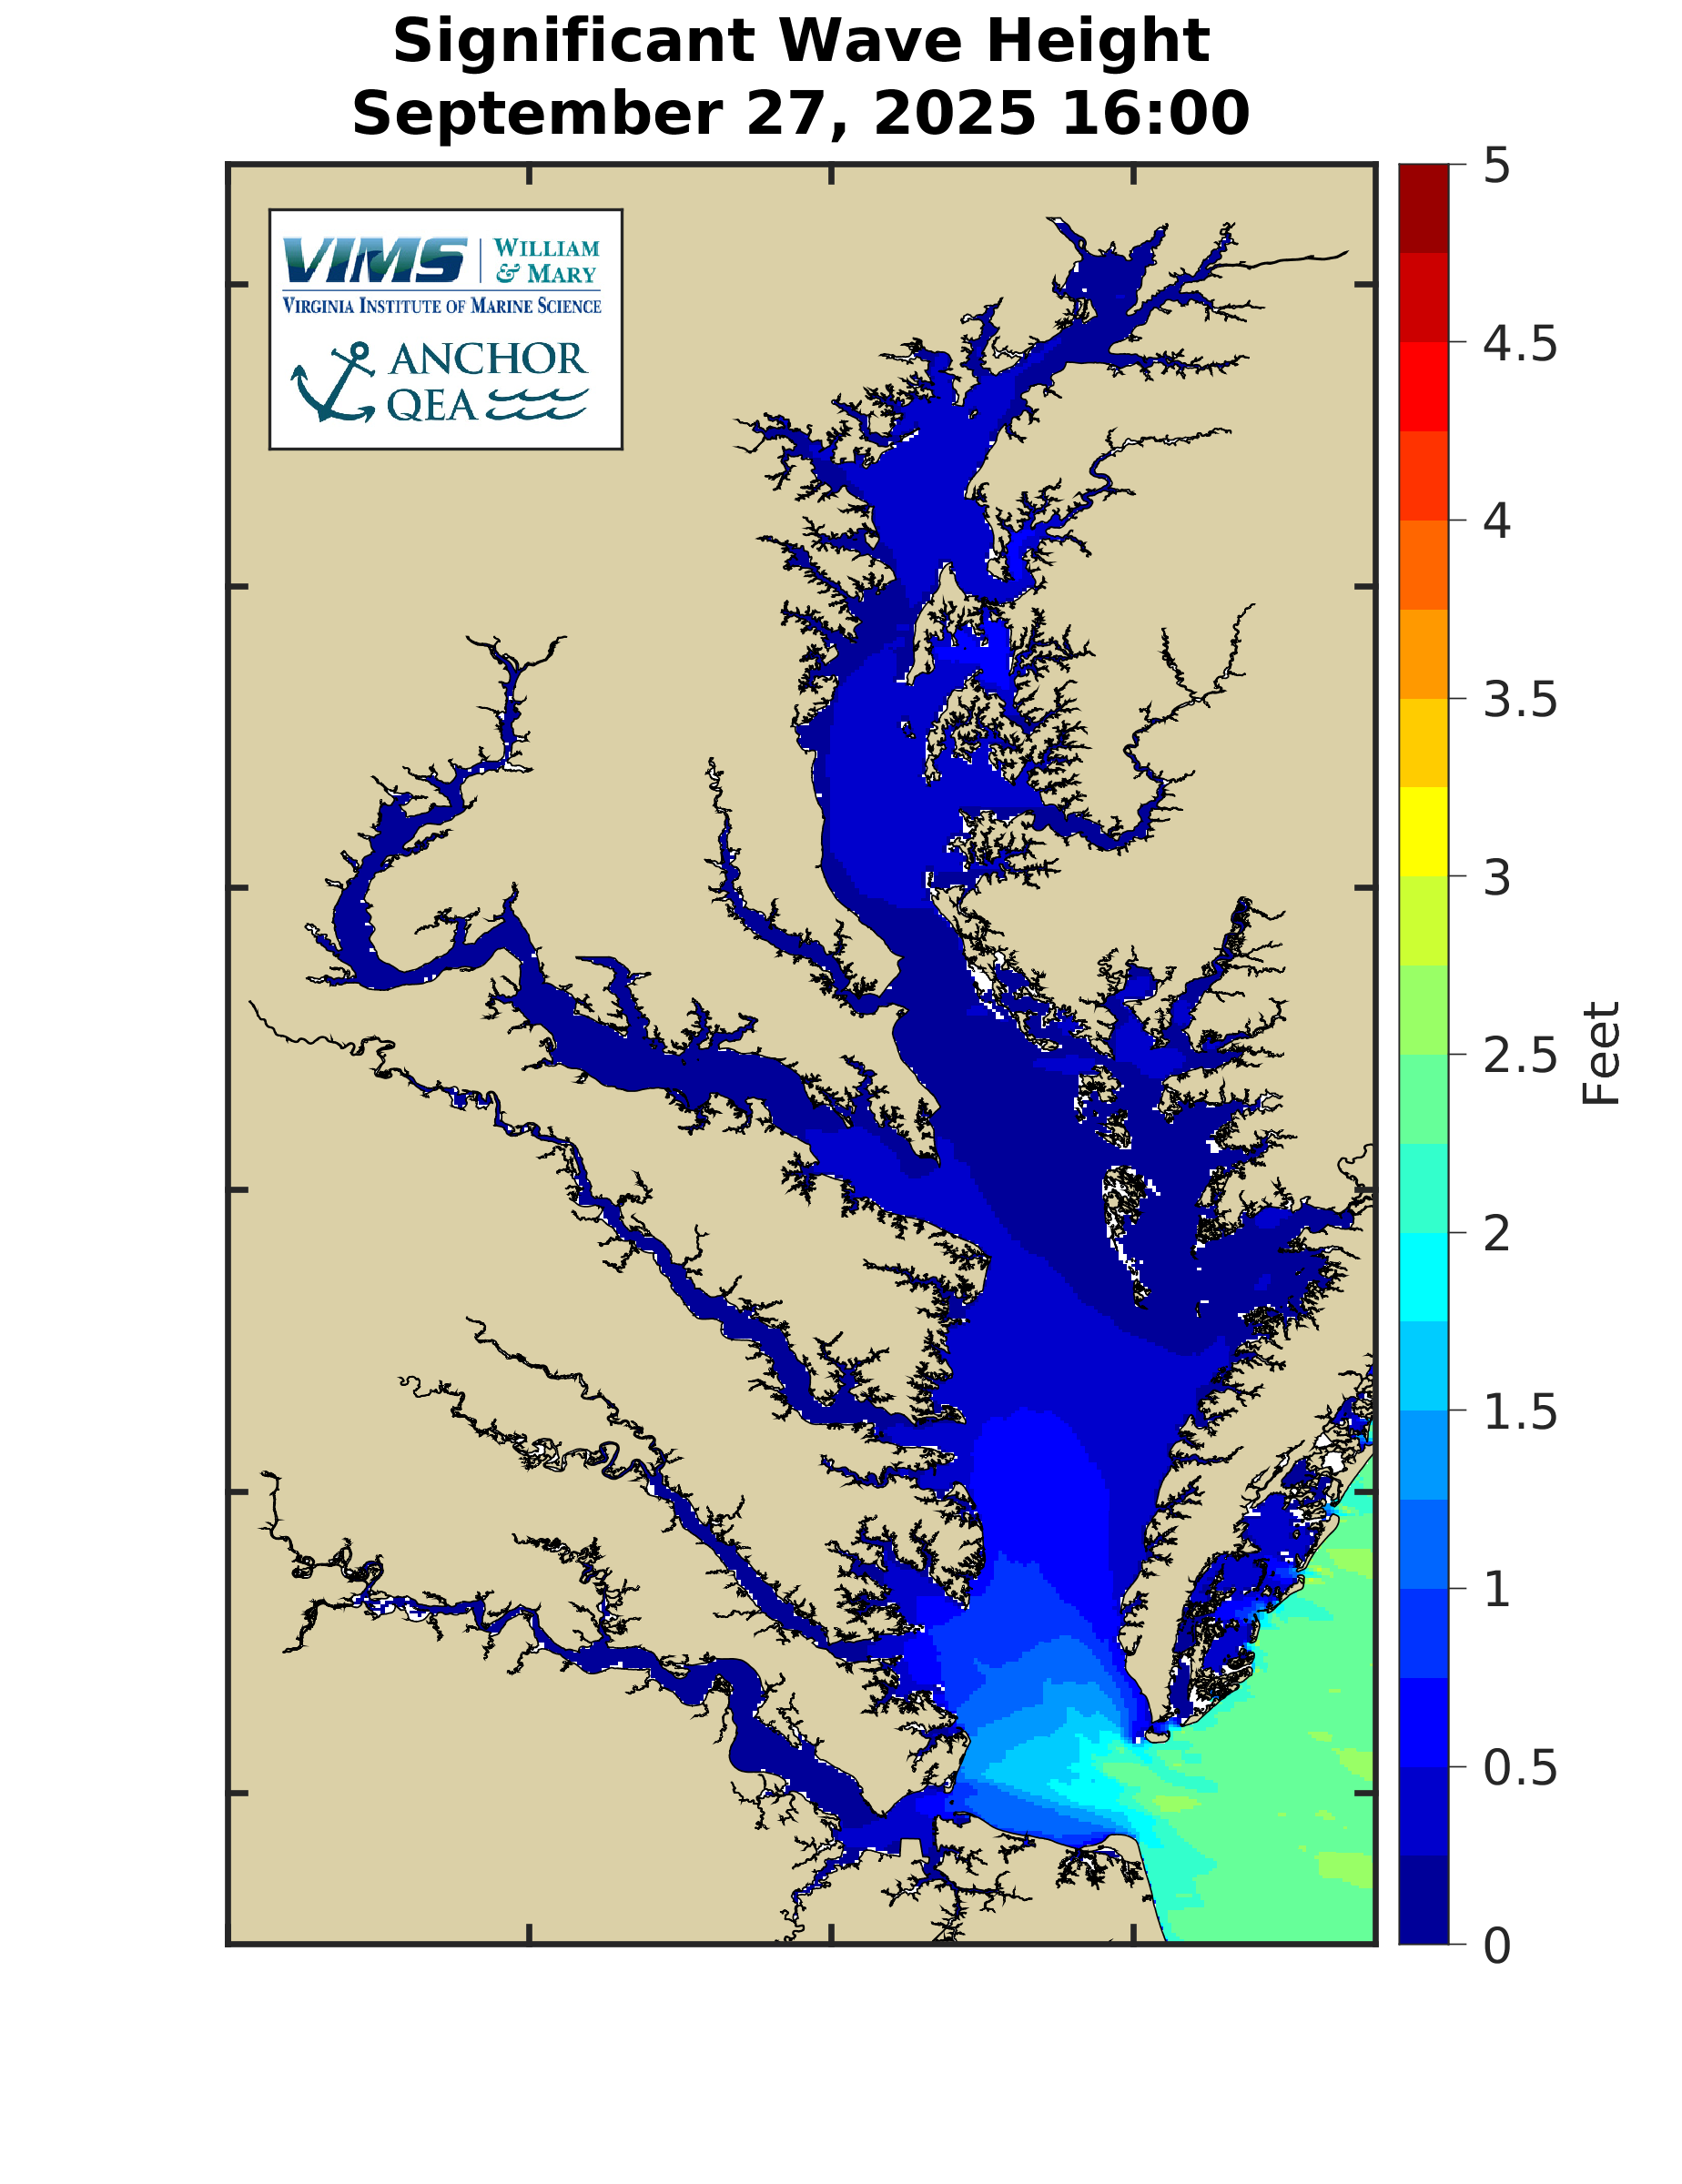
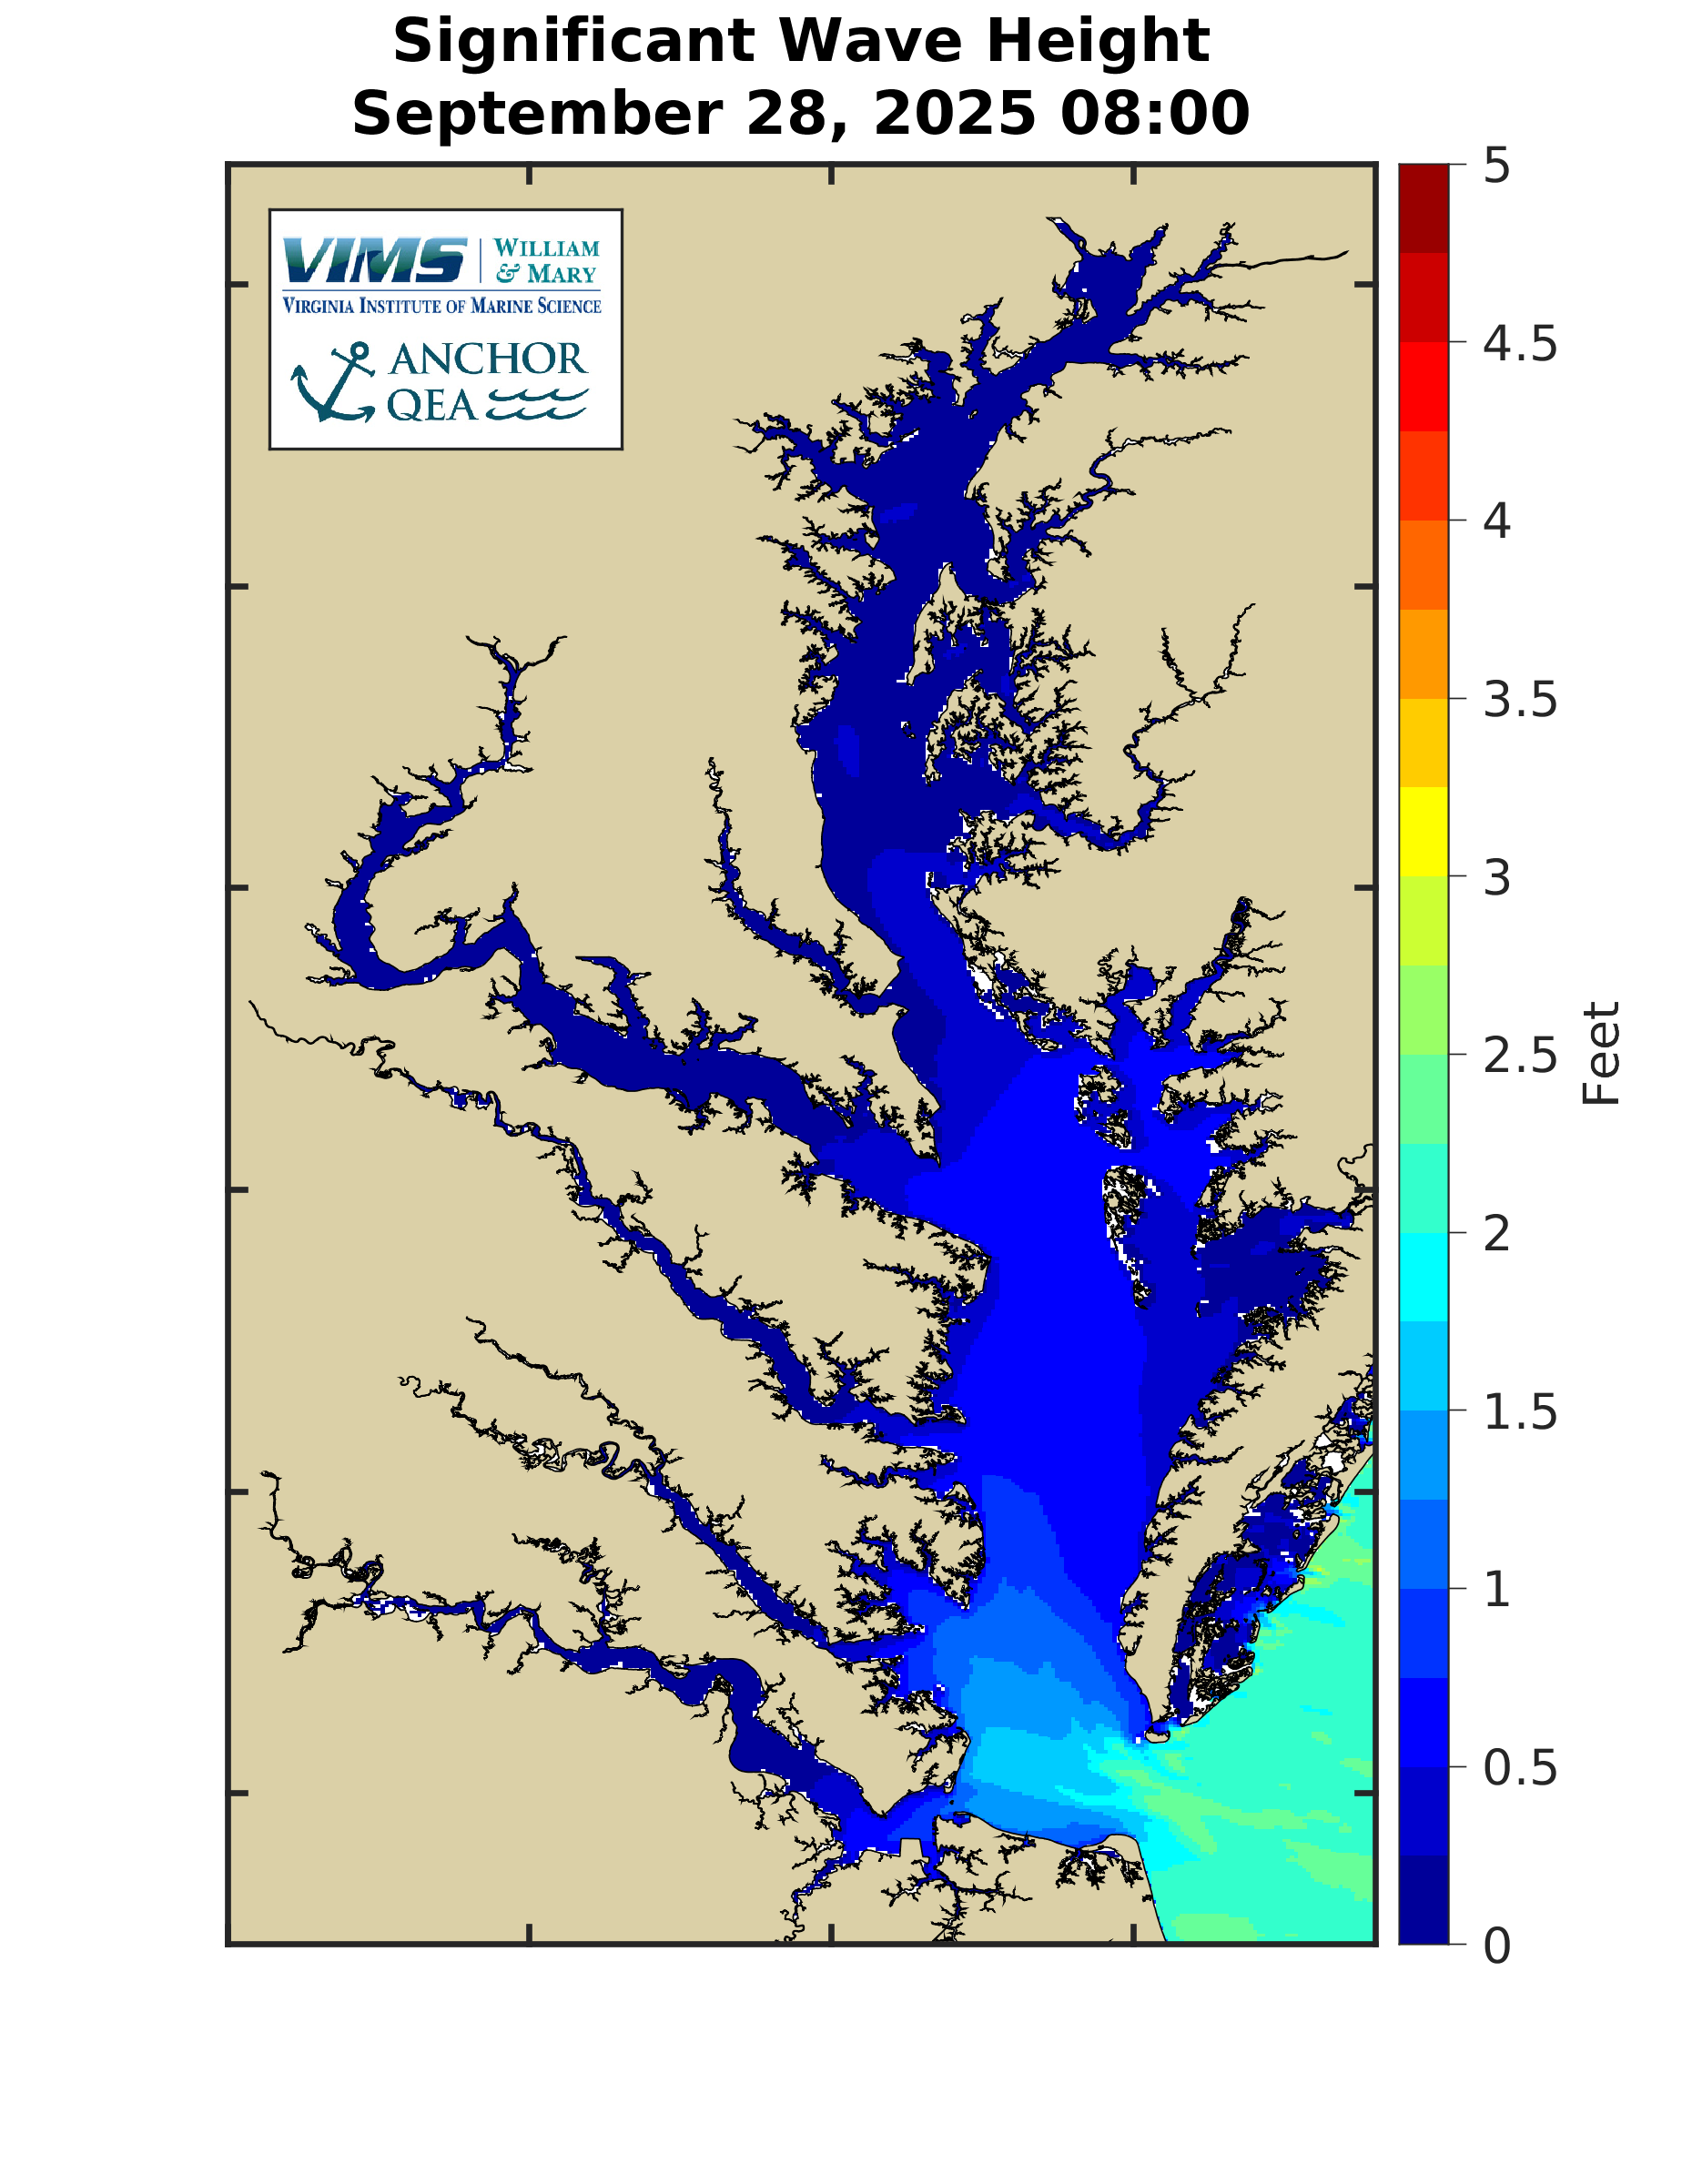
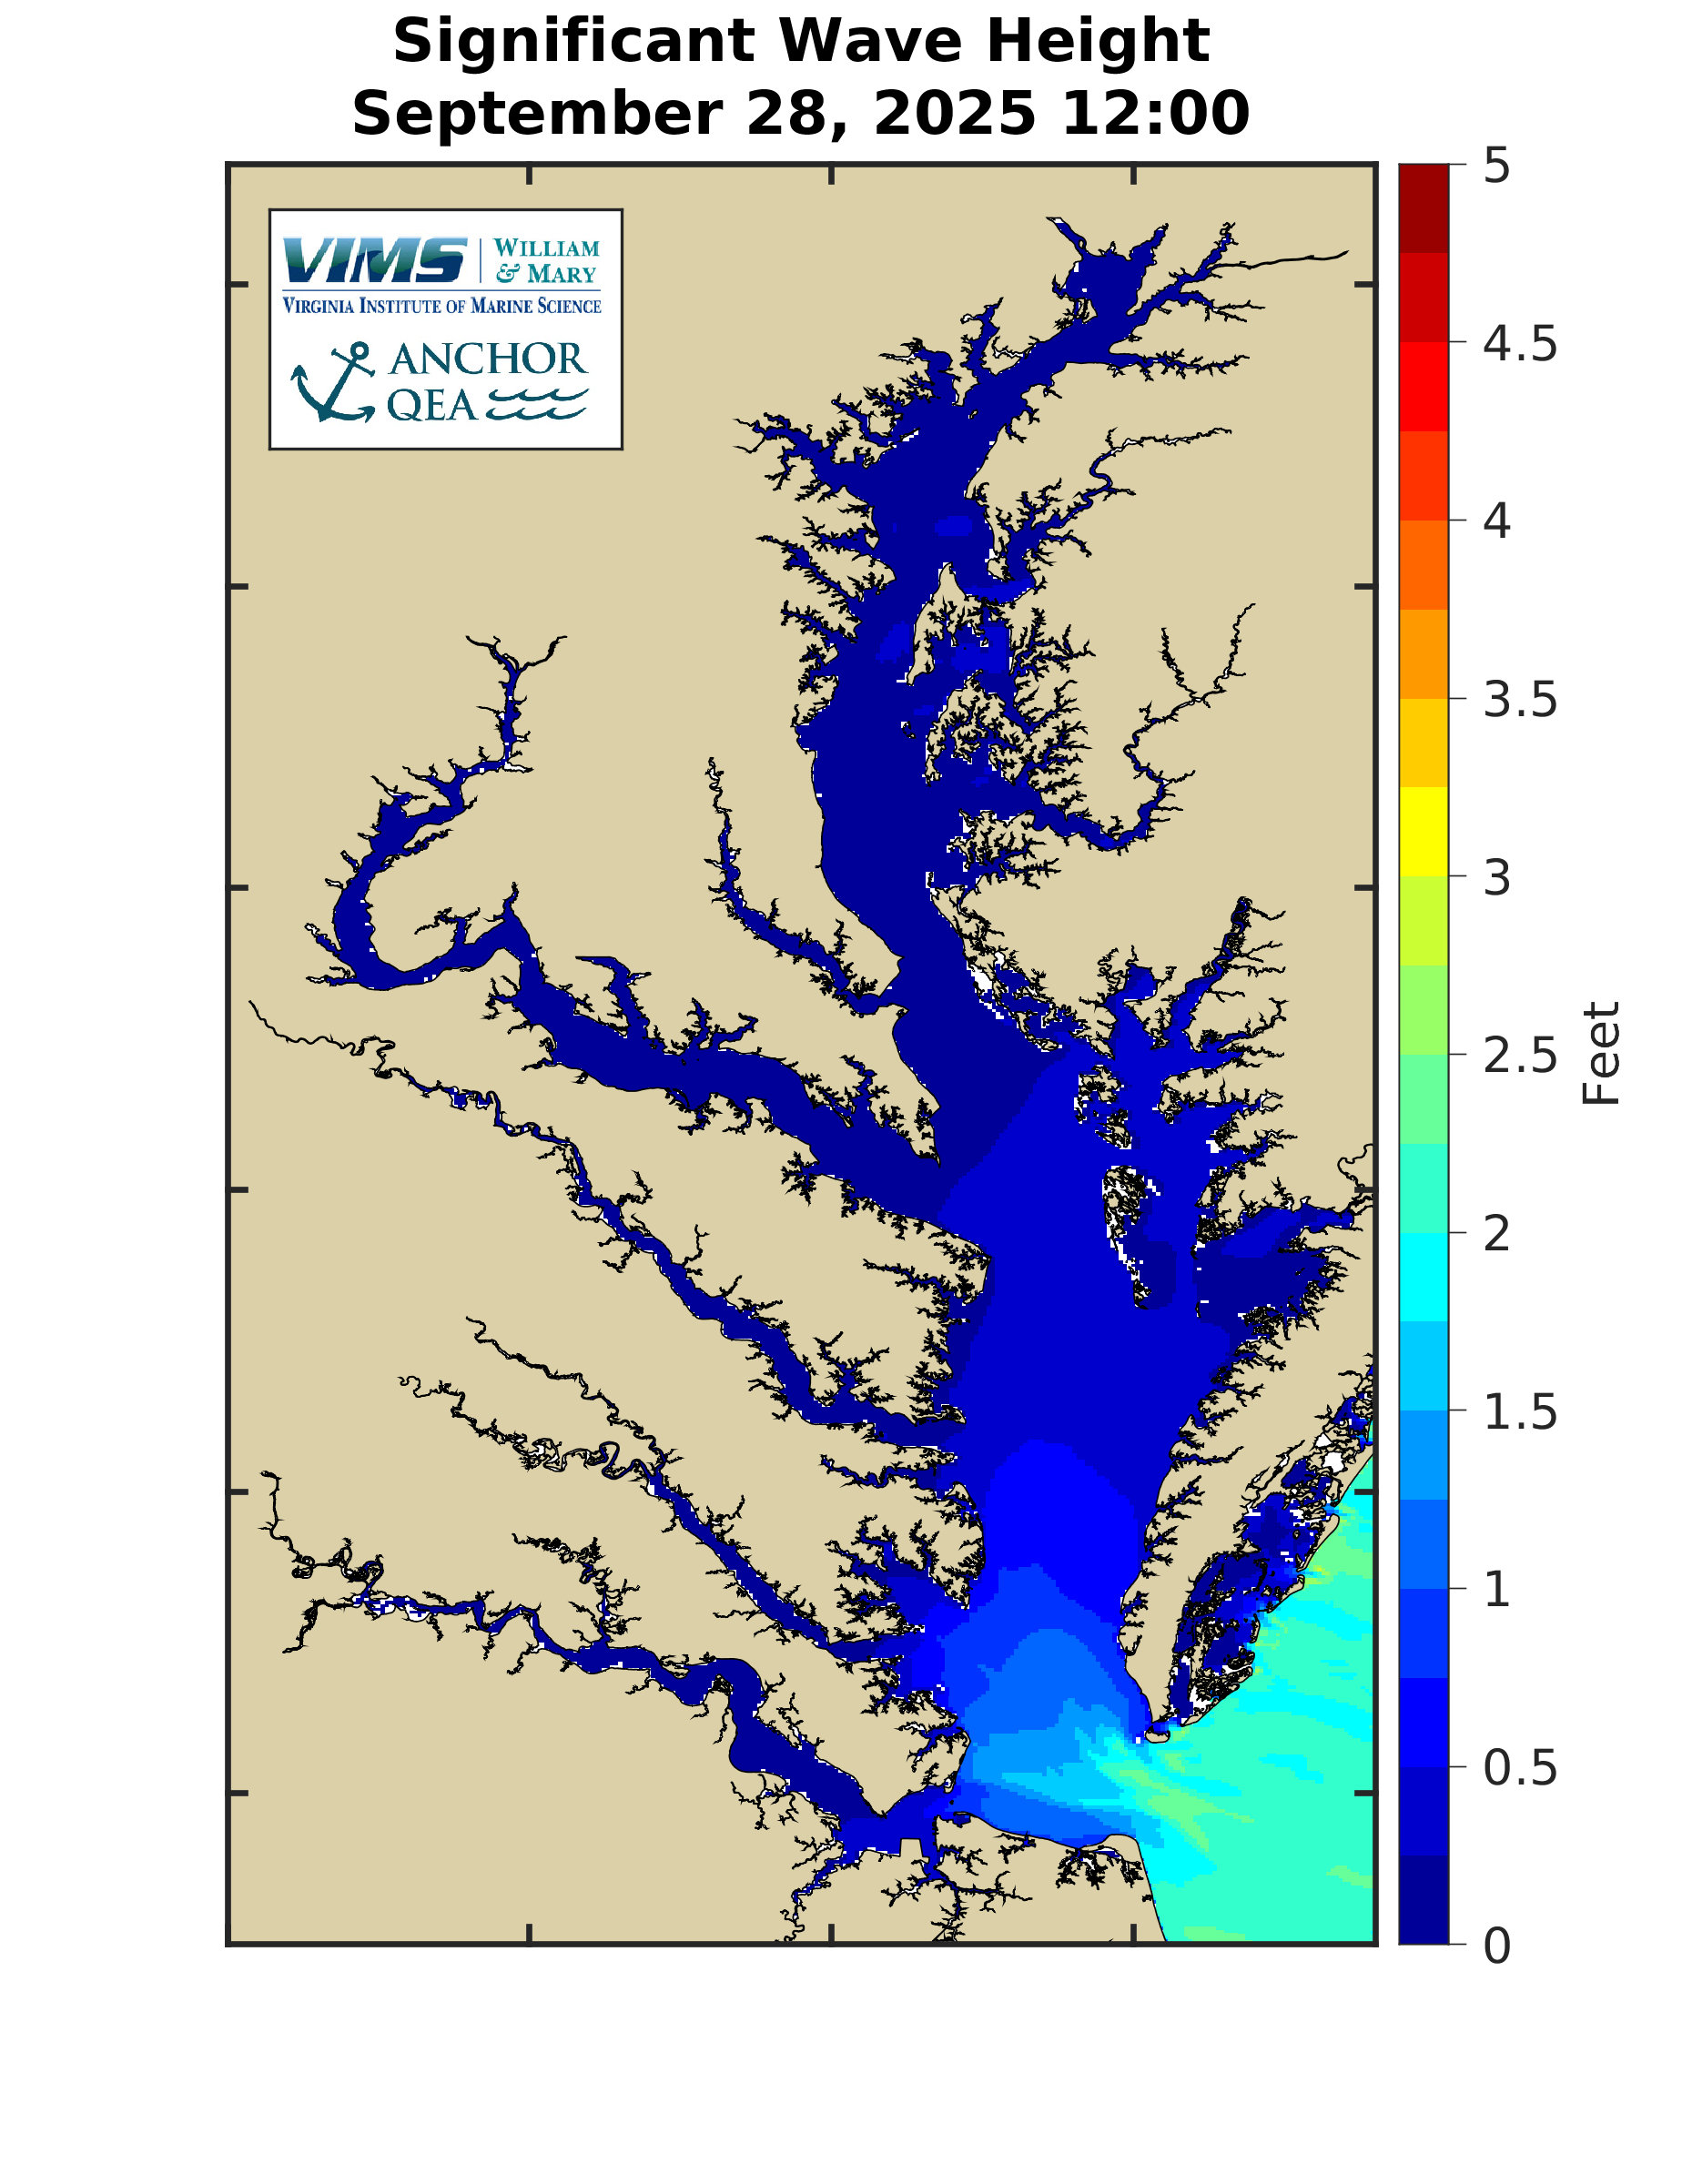
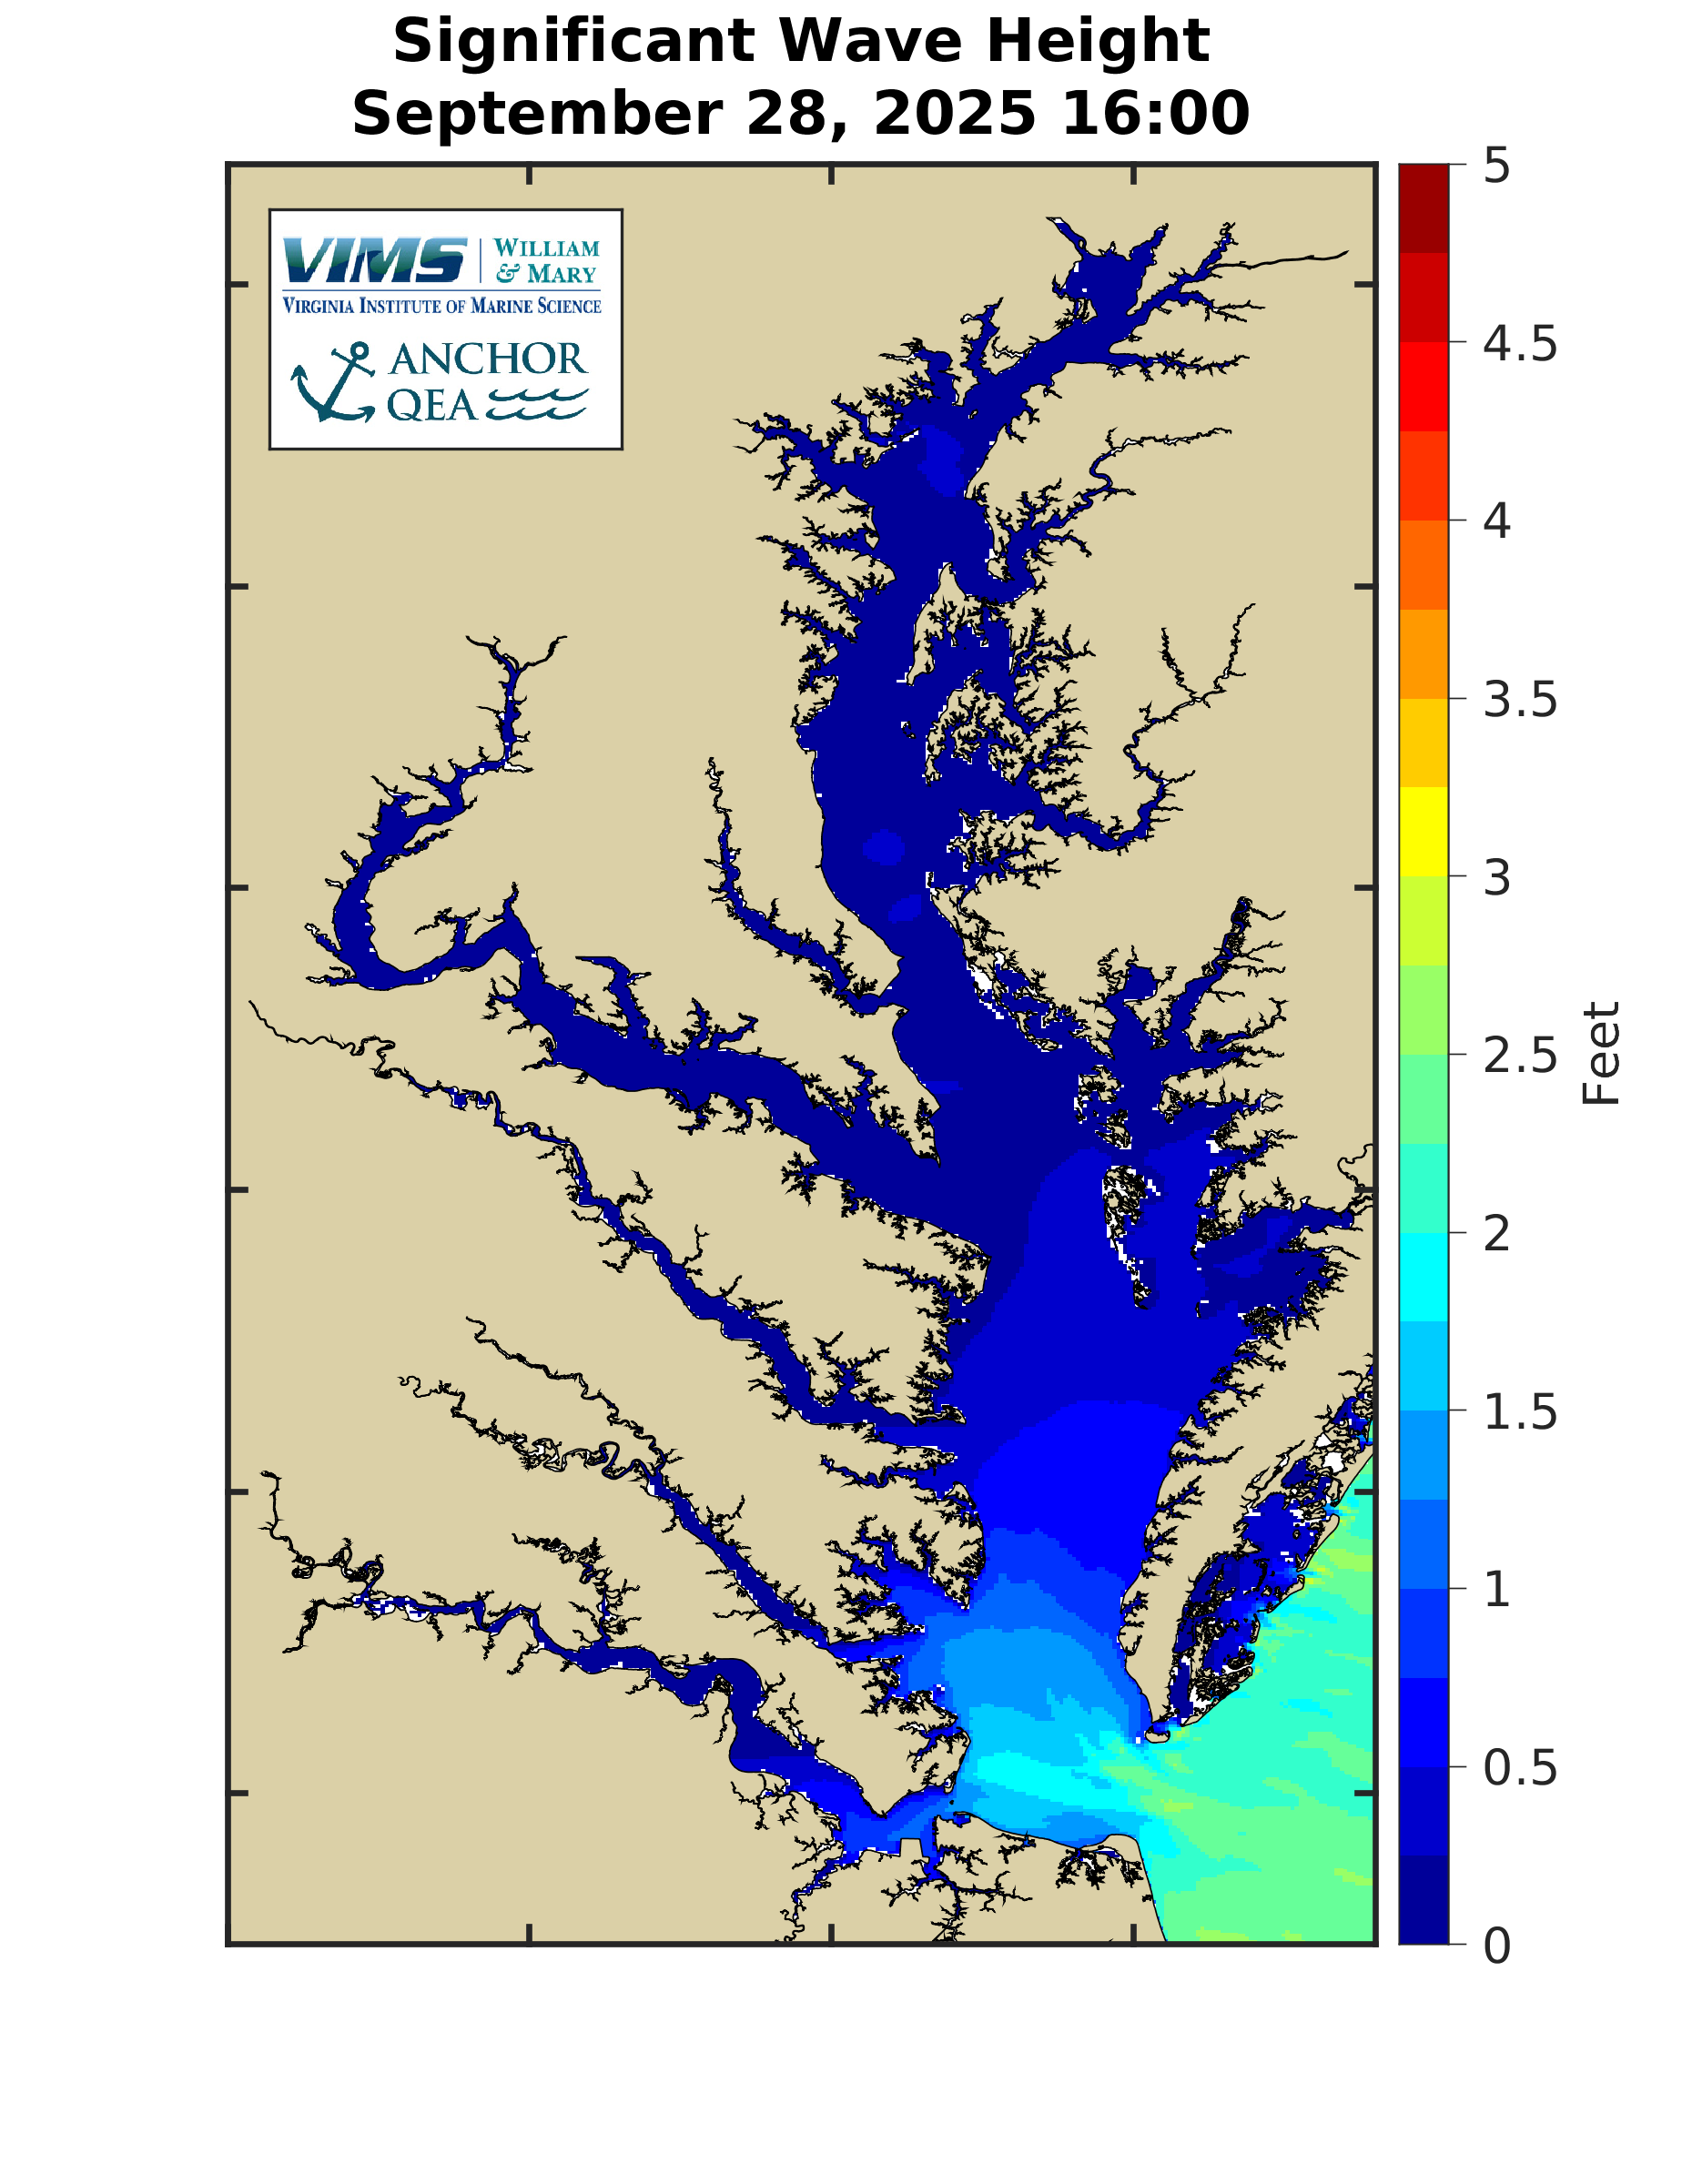
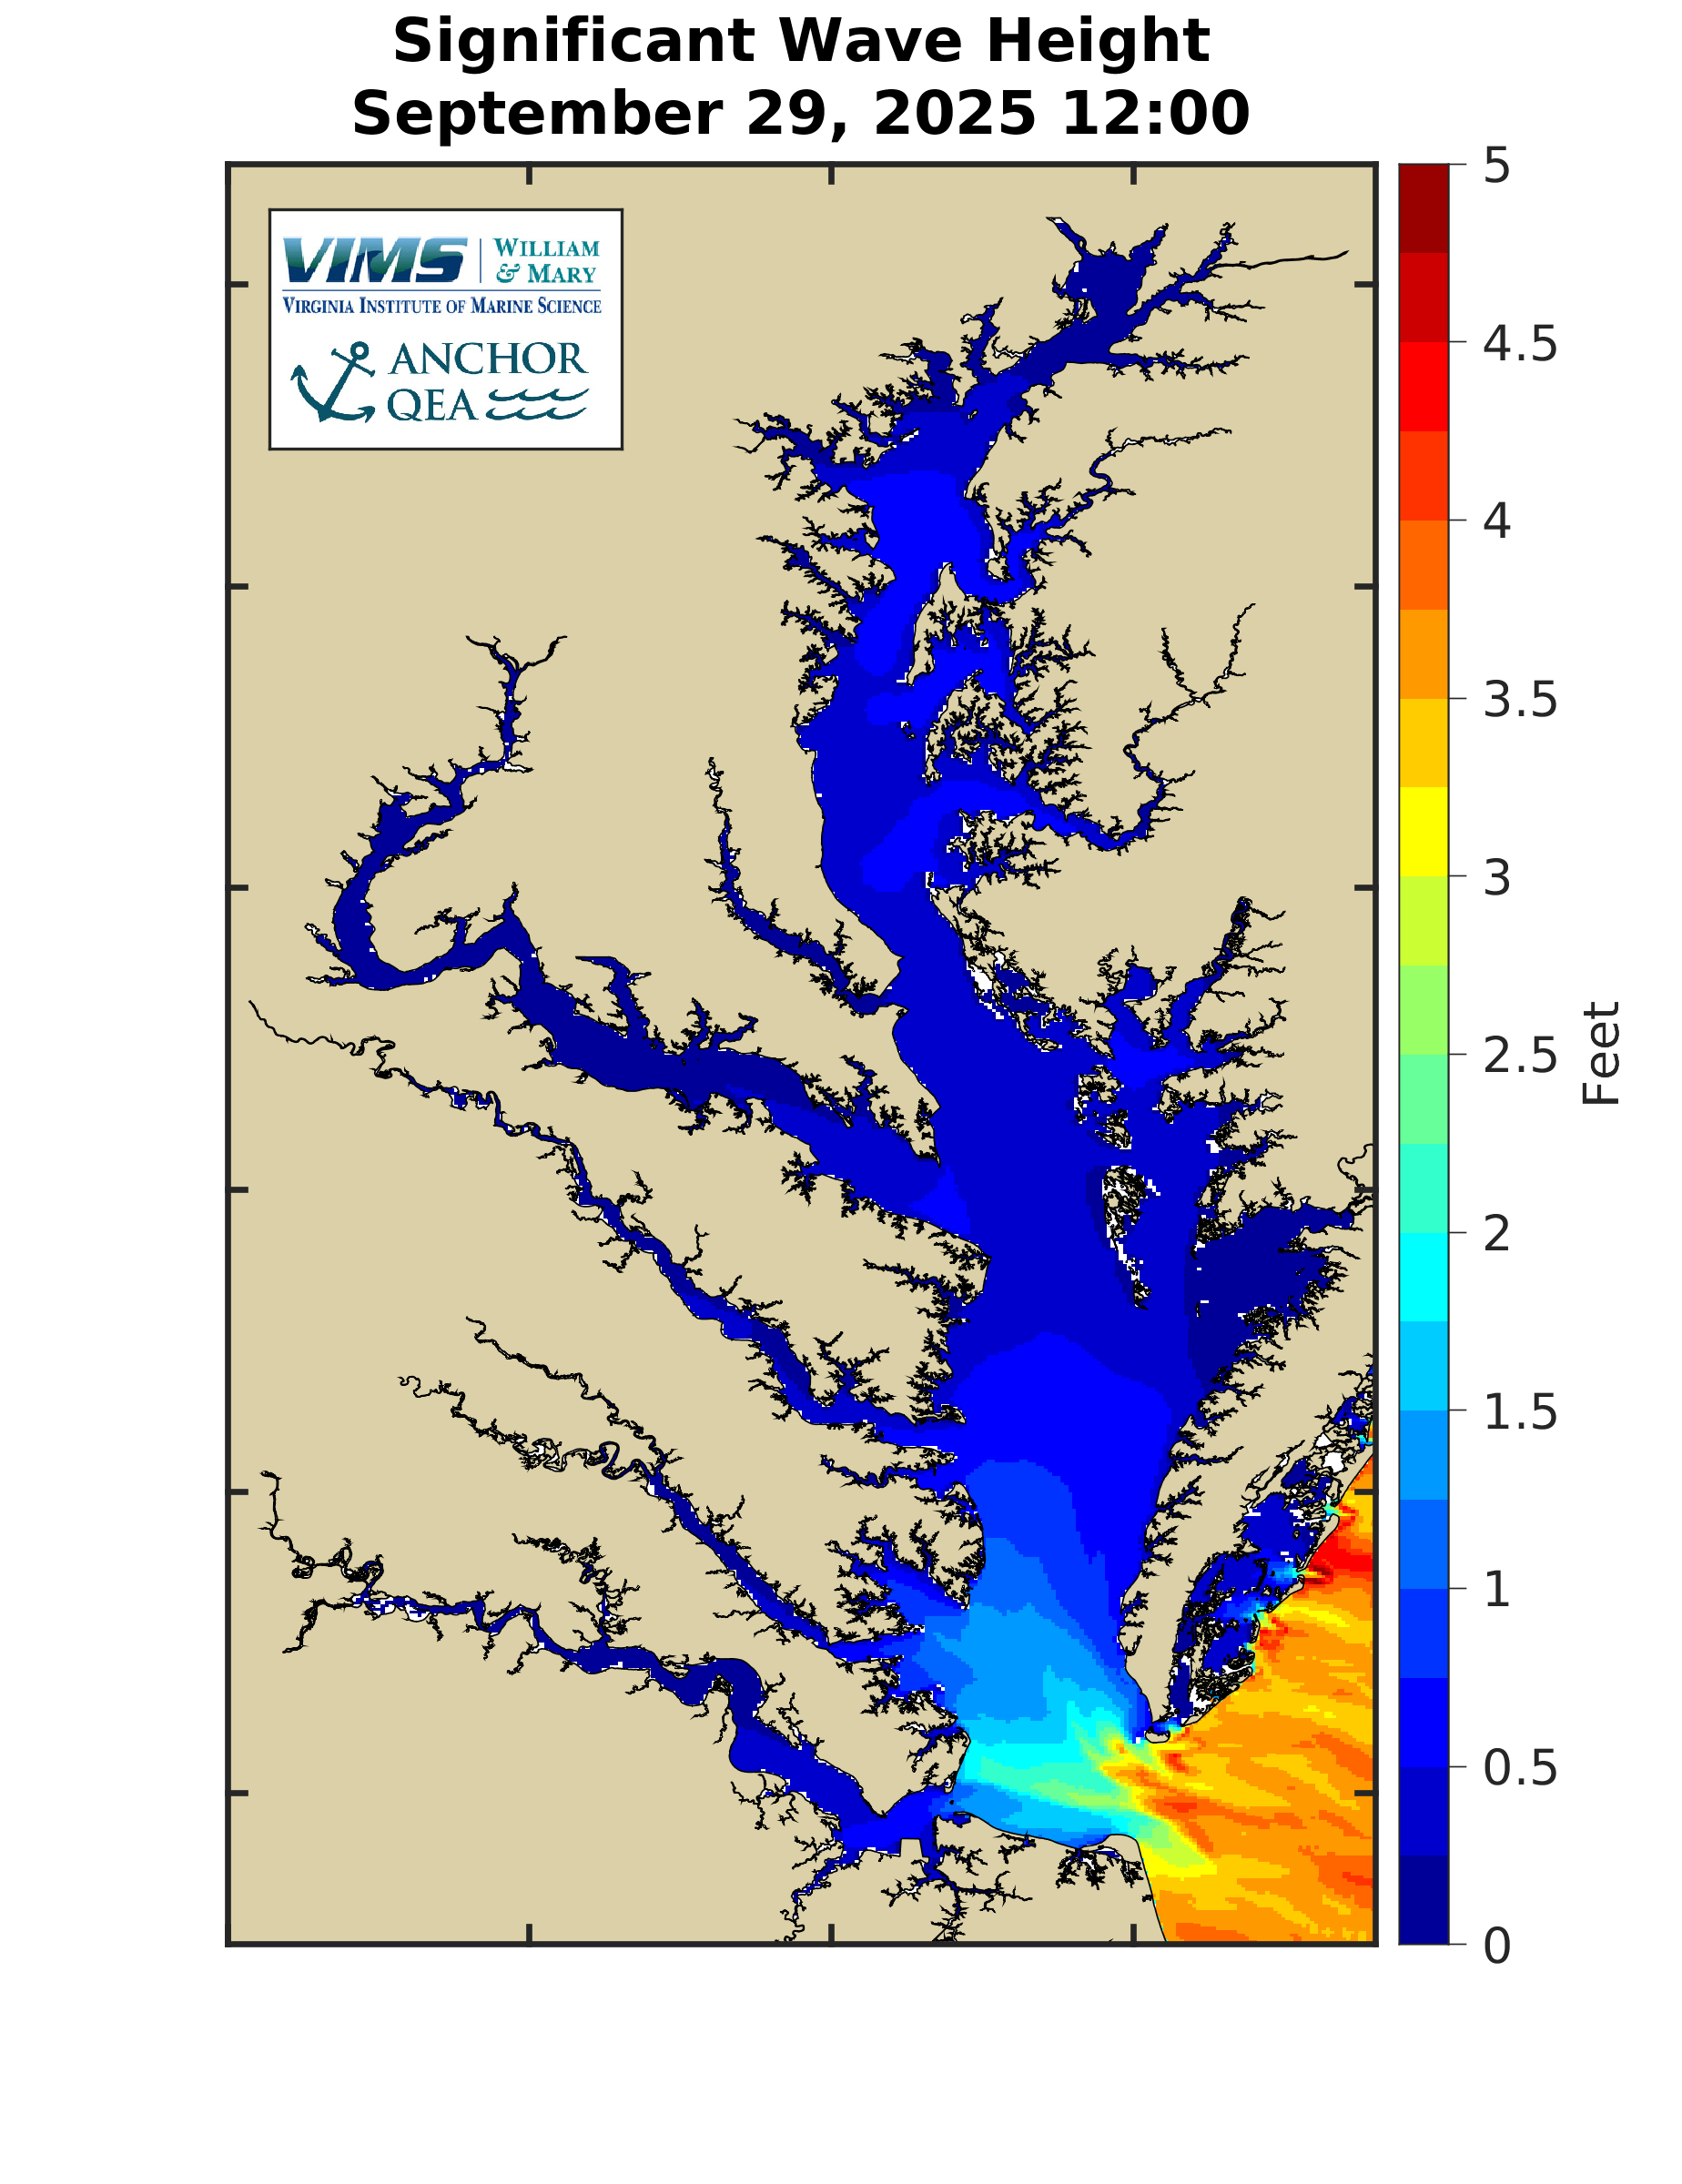
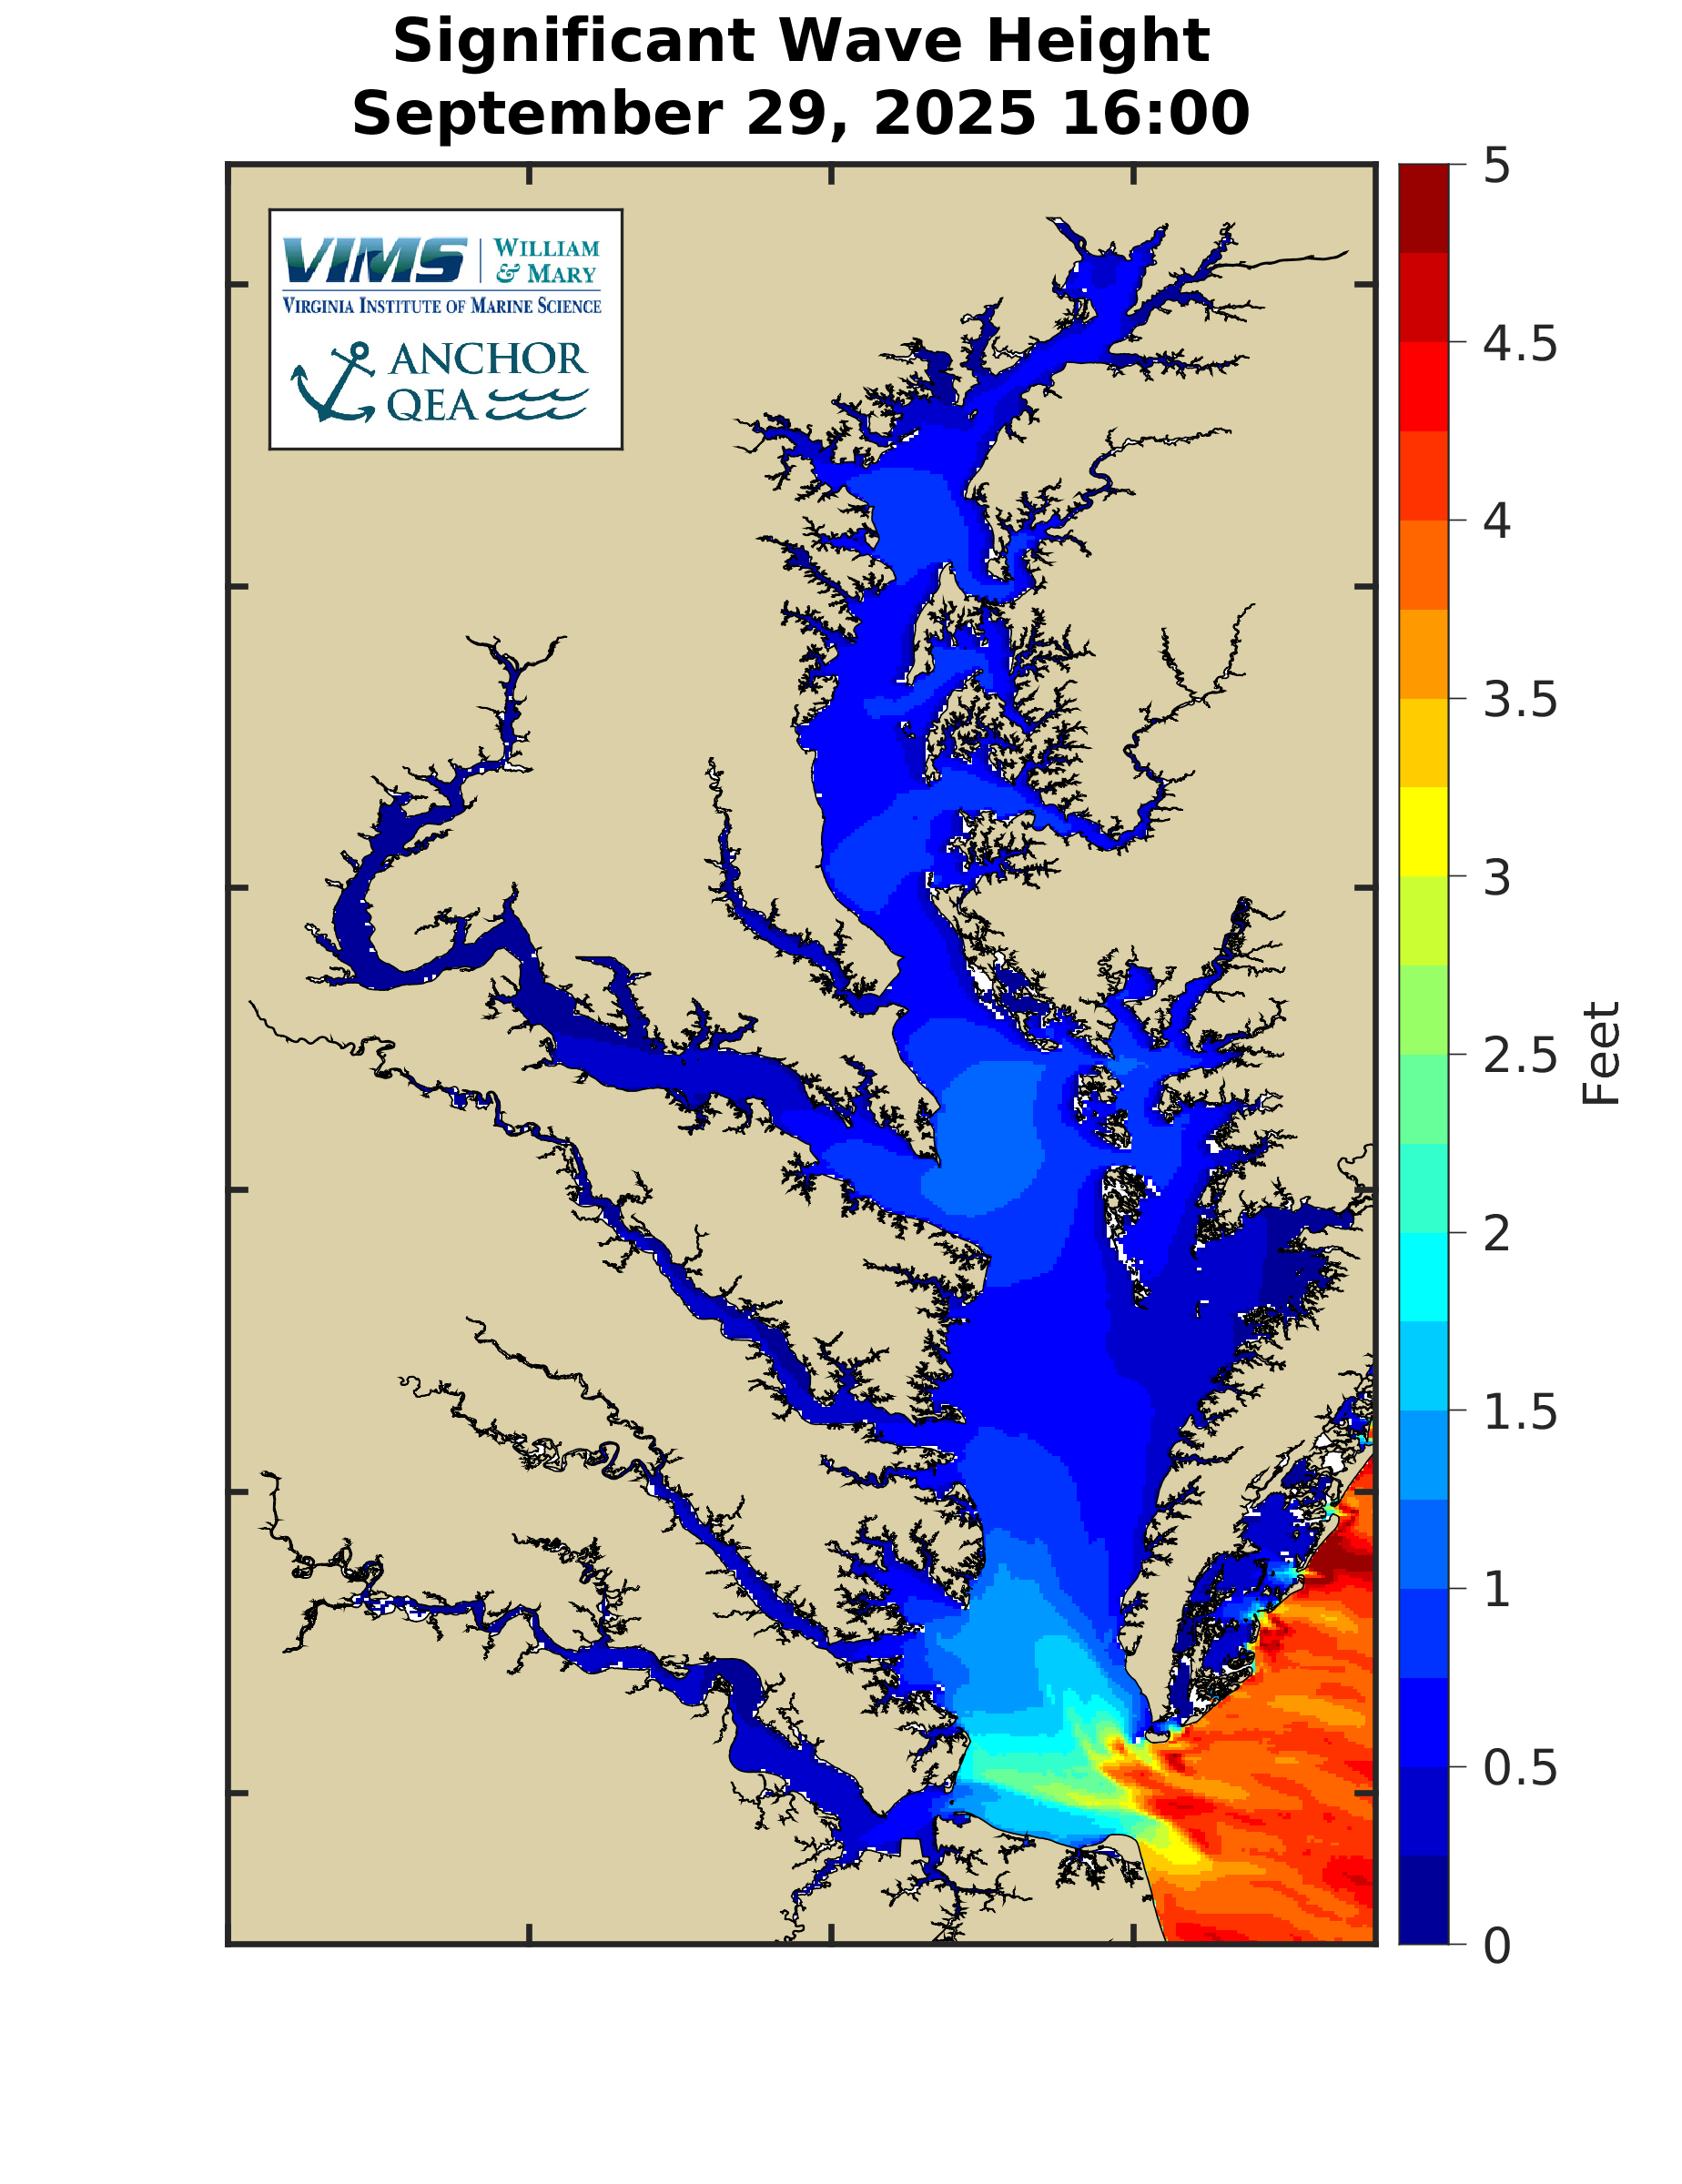
Wave Height MapsMaps show the height of the largest 1/3 of the waves (significant wave height). Please note that exactly how to present the time of day based on the input data used for the wave forecasting versus daylight savings time and standard time is still being evaluated.
|


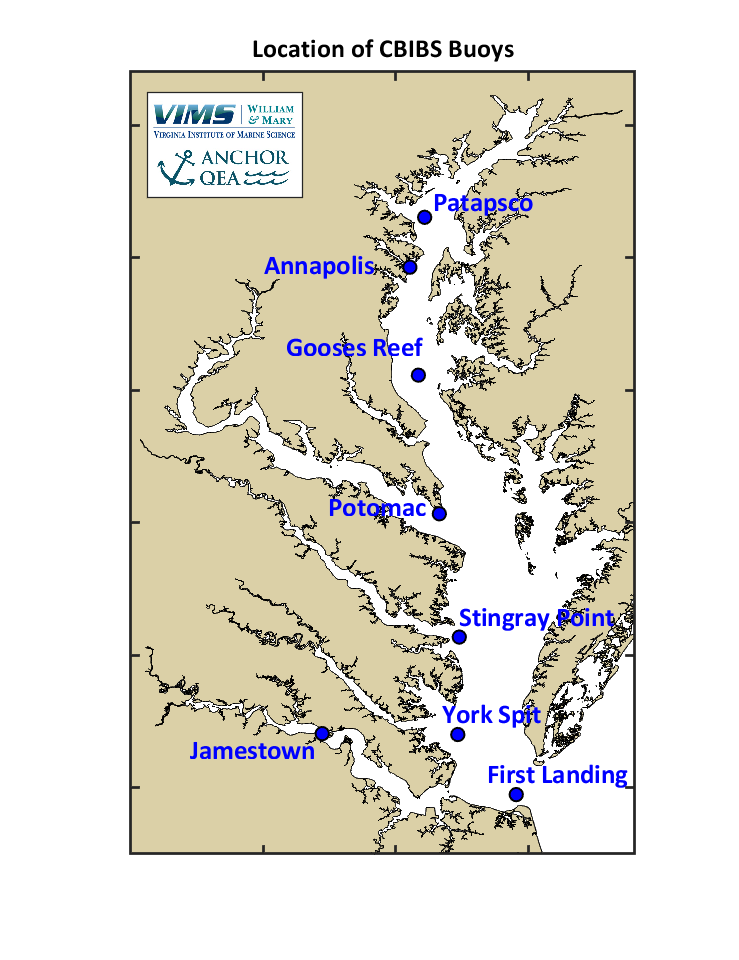
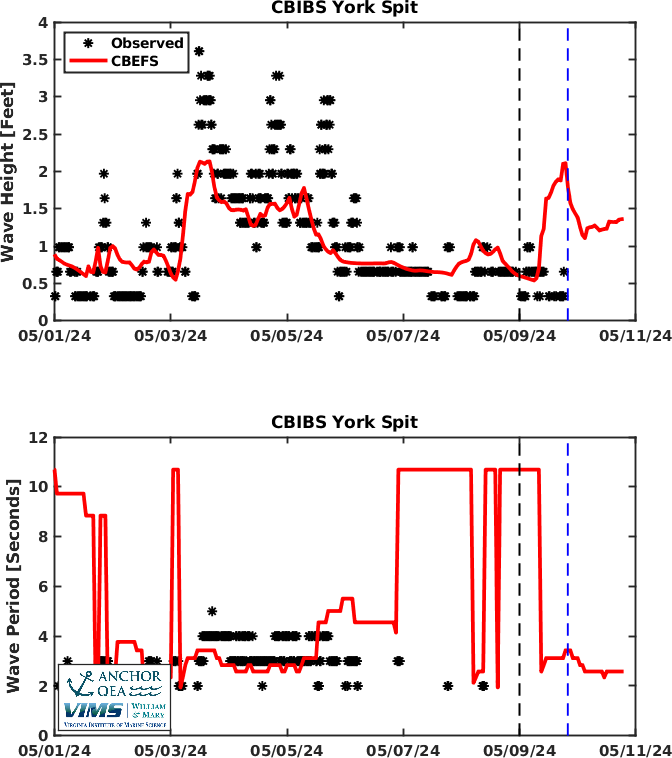
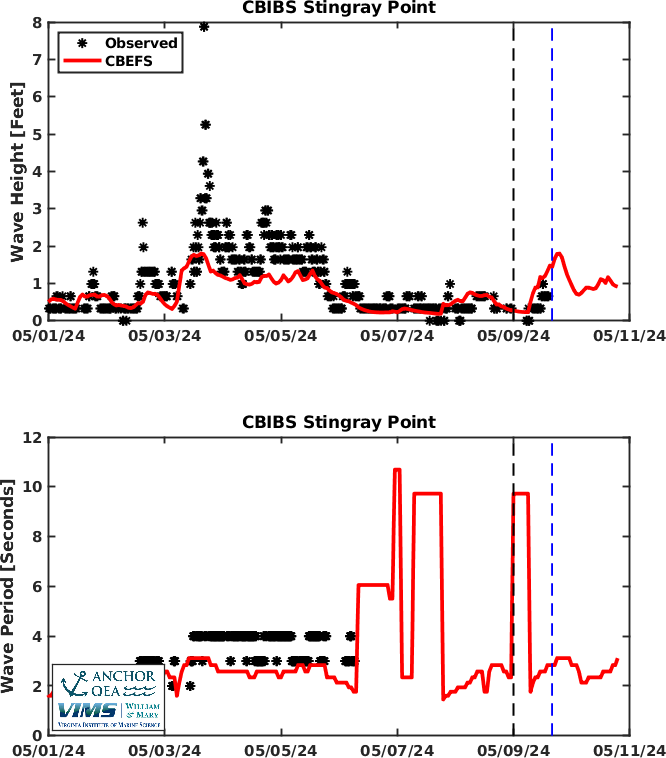
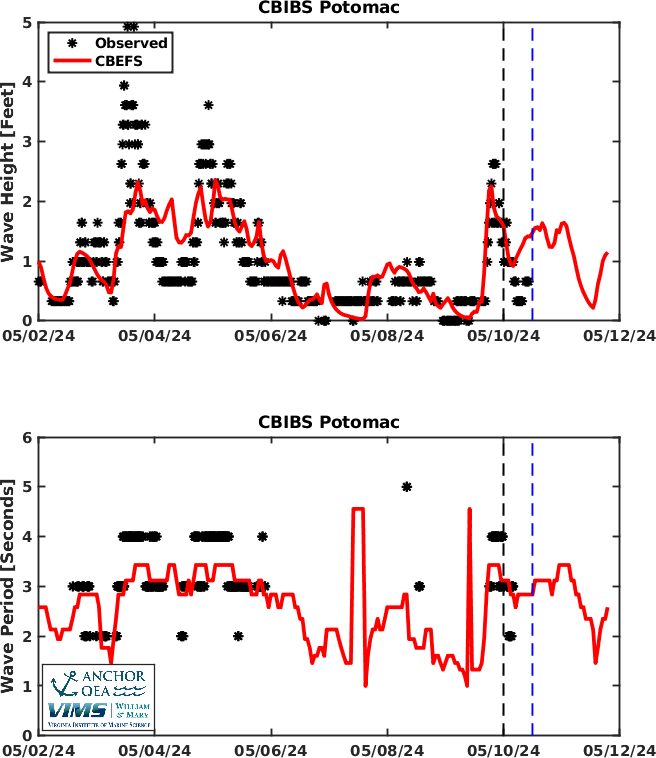
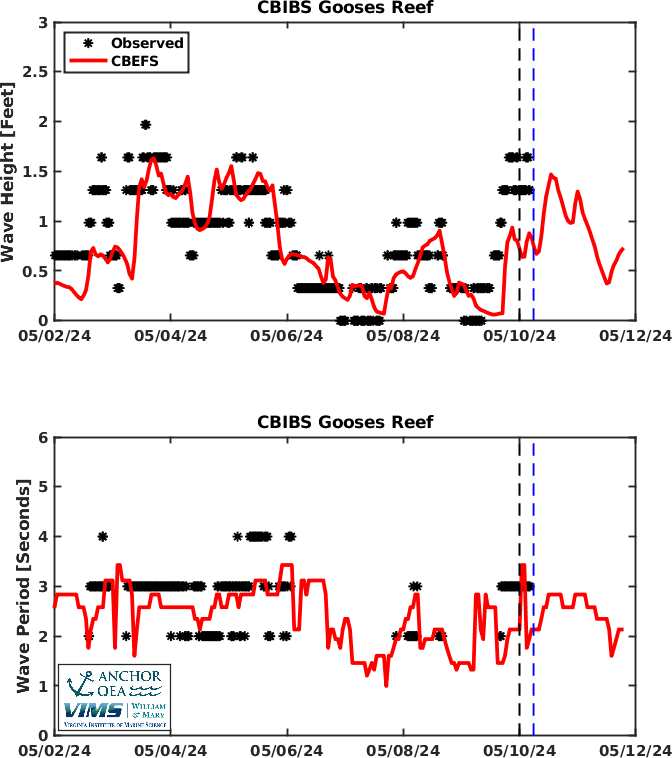
Waves Model-Data ComparisonsCBEFS wave height and period are compared to observed waves at various locations throughout the Bay and offshore of the Bay mouth. Please note that there are very minimal quality assurances or removal of suspect data performed on the observed wave data because they are retrieved daily in real time. The observed waves in the Bay are from the Chesapeake Bay Interpretive Buoy System (CBIBS) and off of the Bay mouth from the National Data Buoy Center (NDBC).
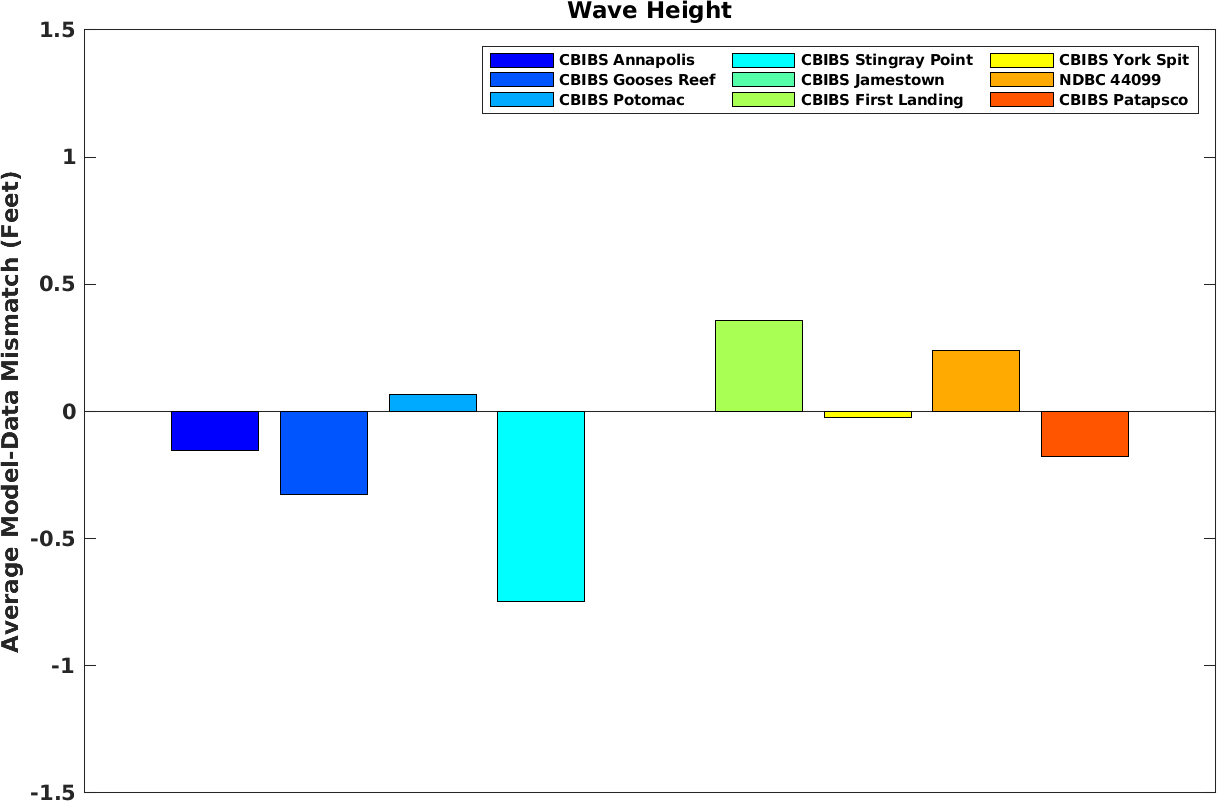
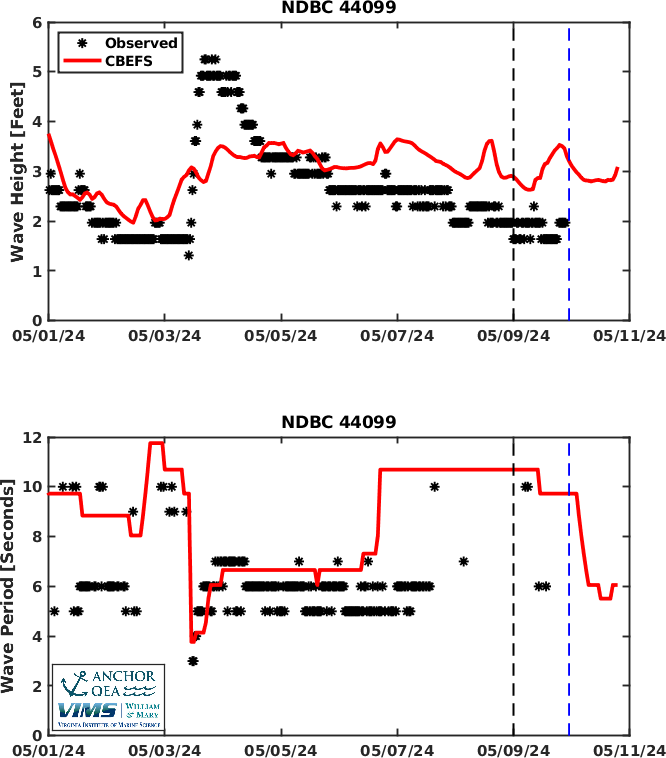
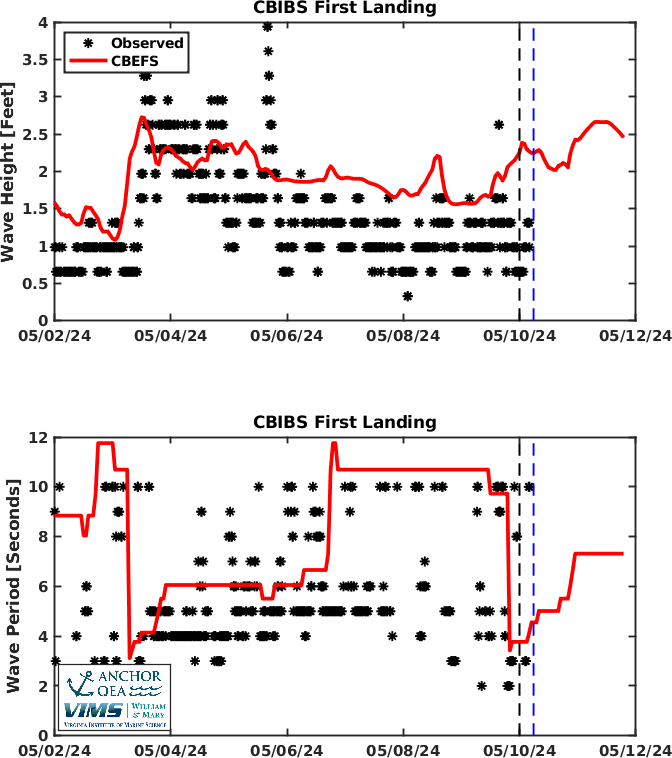
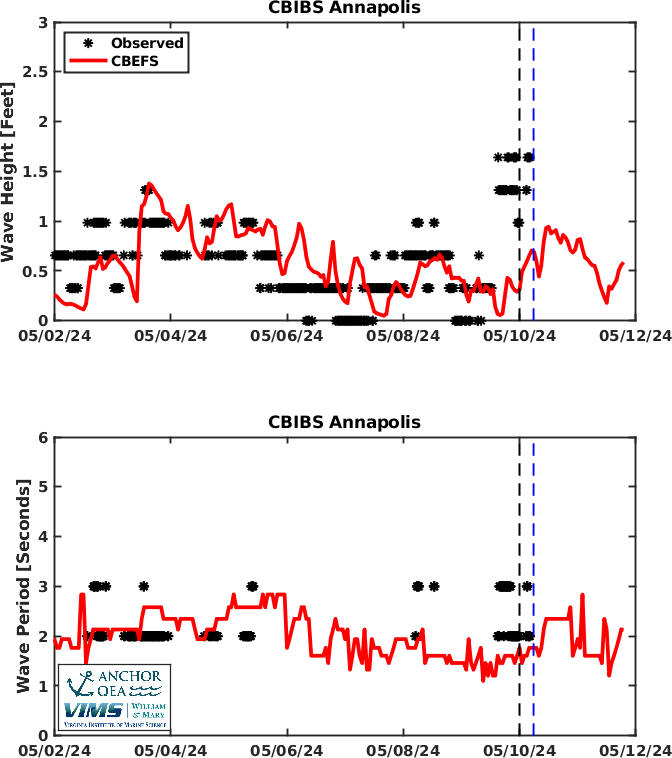
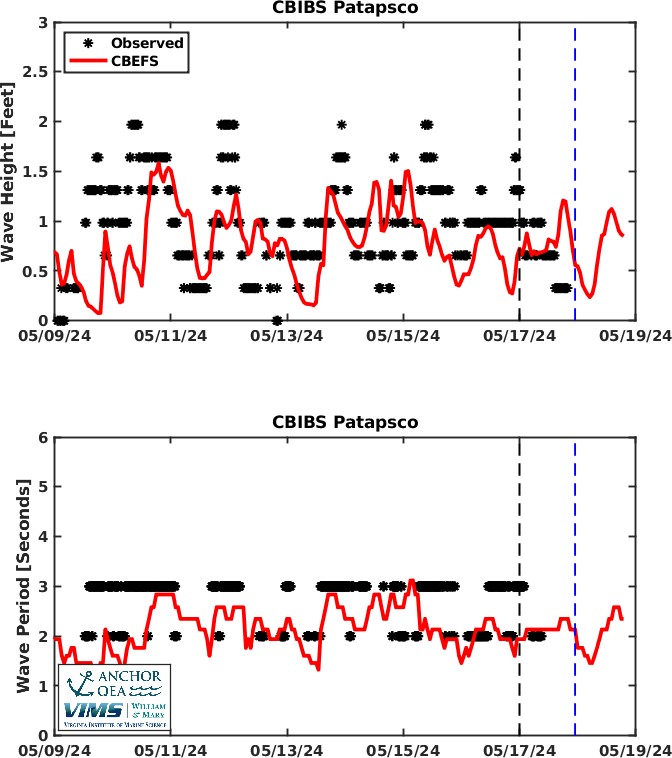
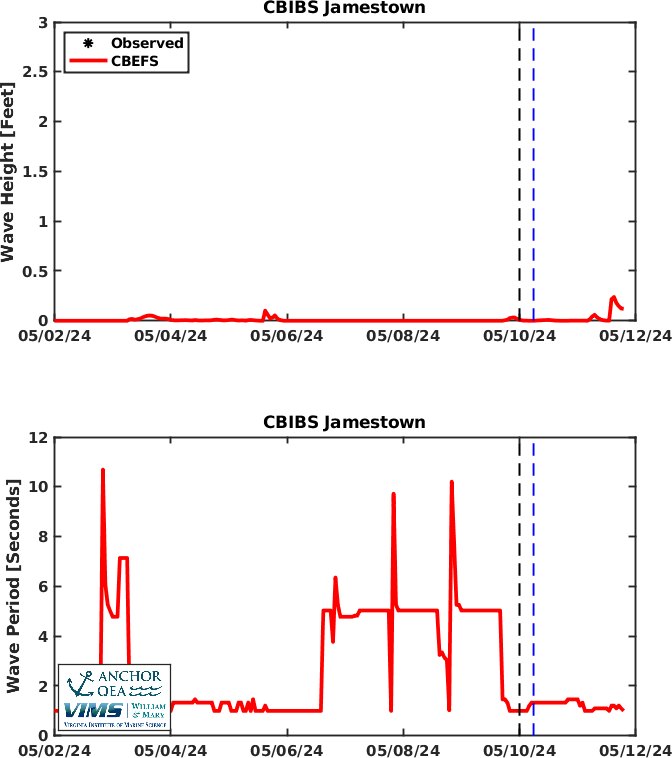
The first image provides the average difference in the height of the waves between the CBEFS waves and the observed waves at each location. The average difference in the wave height is calculated over the last 8 days. This image is used to determine, on average, how well the CBEFS waves matched the observed waves. The next images show the CBEFS waves (red) and the observed waves (black) over the last 8 days and for the 2-day forecast. Midnight last night (today) is marked with a dashed vertical line. These images are used to visually determine how well the height of the CBEFS waves and the timing of large or small waves matches the observed waves.
--------------------------------------------------------------------------------------
--------------------------------------------------------------------------------- ---------------------------------------------------------------------------------
---------------------------------------------------------------------------------
---------------------------------------------------------------------------------
---------------------------------------------------------------------------------
---------------------------------------------------------------------------------
---------------------------------------------------------------------------------
---------------------------------------------------------------------------------
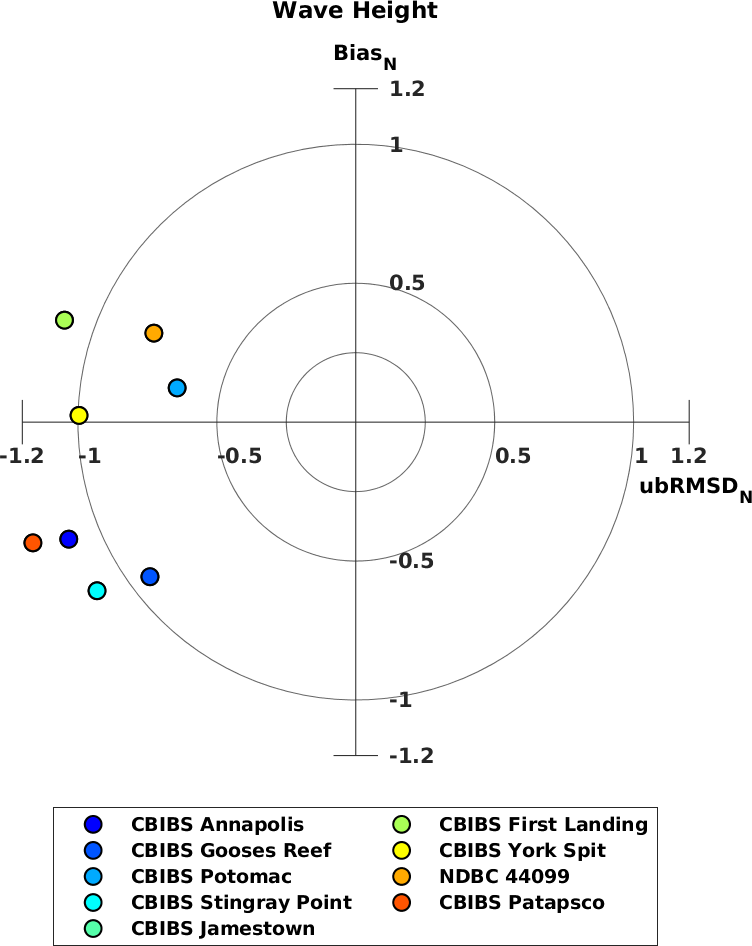
-------------------------------------------------------------------------------------- This final image is called a "target diagram" and statistically compares the CBEFS and observed wave height. The closer to the center of the bullseye the more accurate the CBEFS waves were. Points plotting above the zero value (above the bullseye) show that the CBEFS waves were on average larger than observed, below the bullseye shows the CBEFS waves were on average smaller than observed. Points plotting to the left of the bullseye show the variability through time in the CBEFS waves was less than the observed waves, and to the right of the bullseye show the variability through time in the CBEFS waves was more than the observed waves.
|
These wave products were developed to help improve ecological forecasting in the Chesapeake Bay and not for navigational purposes. The user assumes the entire risk related to its use of information on Chesapeake Bay Environmental Forecasting System web pages. Information is provided "as is," with no warranties, whether express or implied, including (without limitation) any implied warranties of merchantability or fitness for a particular purpose. In no event will anyone be liable to you or to any third party for any direct, indirect, incidental, consequential, special or exemplary damages or for any claims, losses, damages, costs, expenses and other liabilities, including (but not limited to) reasonable attorneys' fees, whether known or unknown, foreseen or unforeseen, relating to property damage or the death, injury, pain or mental trauma to you, or any other person, which results, directly or indirectly from, or arises out of, any use or misuse of this data.