
Acidification Forecasts
Quick SummaryAcidification occurs when the amount of CO2 dissolved in the water changes, thus changing the water pH. Acidification of estuaries and the coastal ocean can have detrimental effects on shellfish, such as oysters, by impacting their growth and survival. The impacts of acidification may be more prominent in lower salinity waters, particularly those impacted by eutrophication. Eutrophication leads to excessive growth of algae and a corresponding increase in respiration (decay of the algae). The increased respiration decreases the pH through the production of CO2. This means the Chesapeake Bay may be especially vulnerable to acidification. Water CO2 concentrations are also increasing globally as the concentration of CO2 in the atmosphere increases, resulting in a global-scale decrease in pH. |
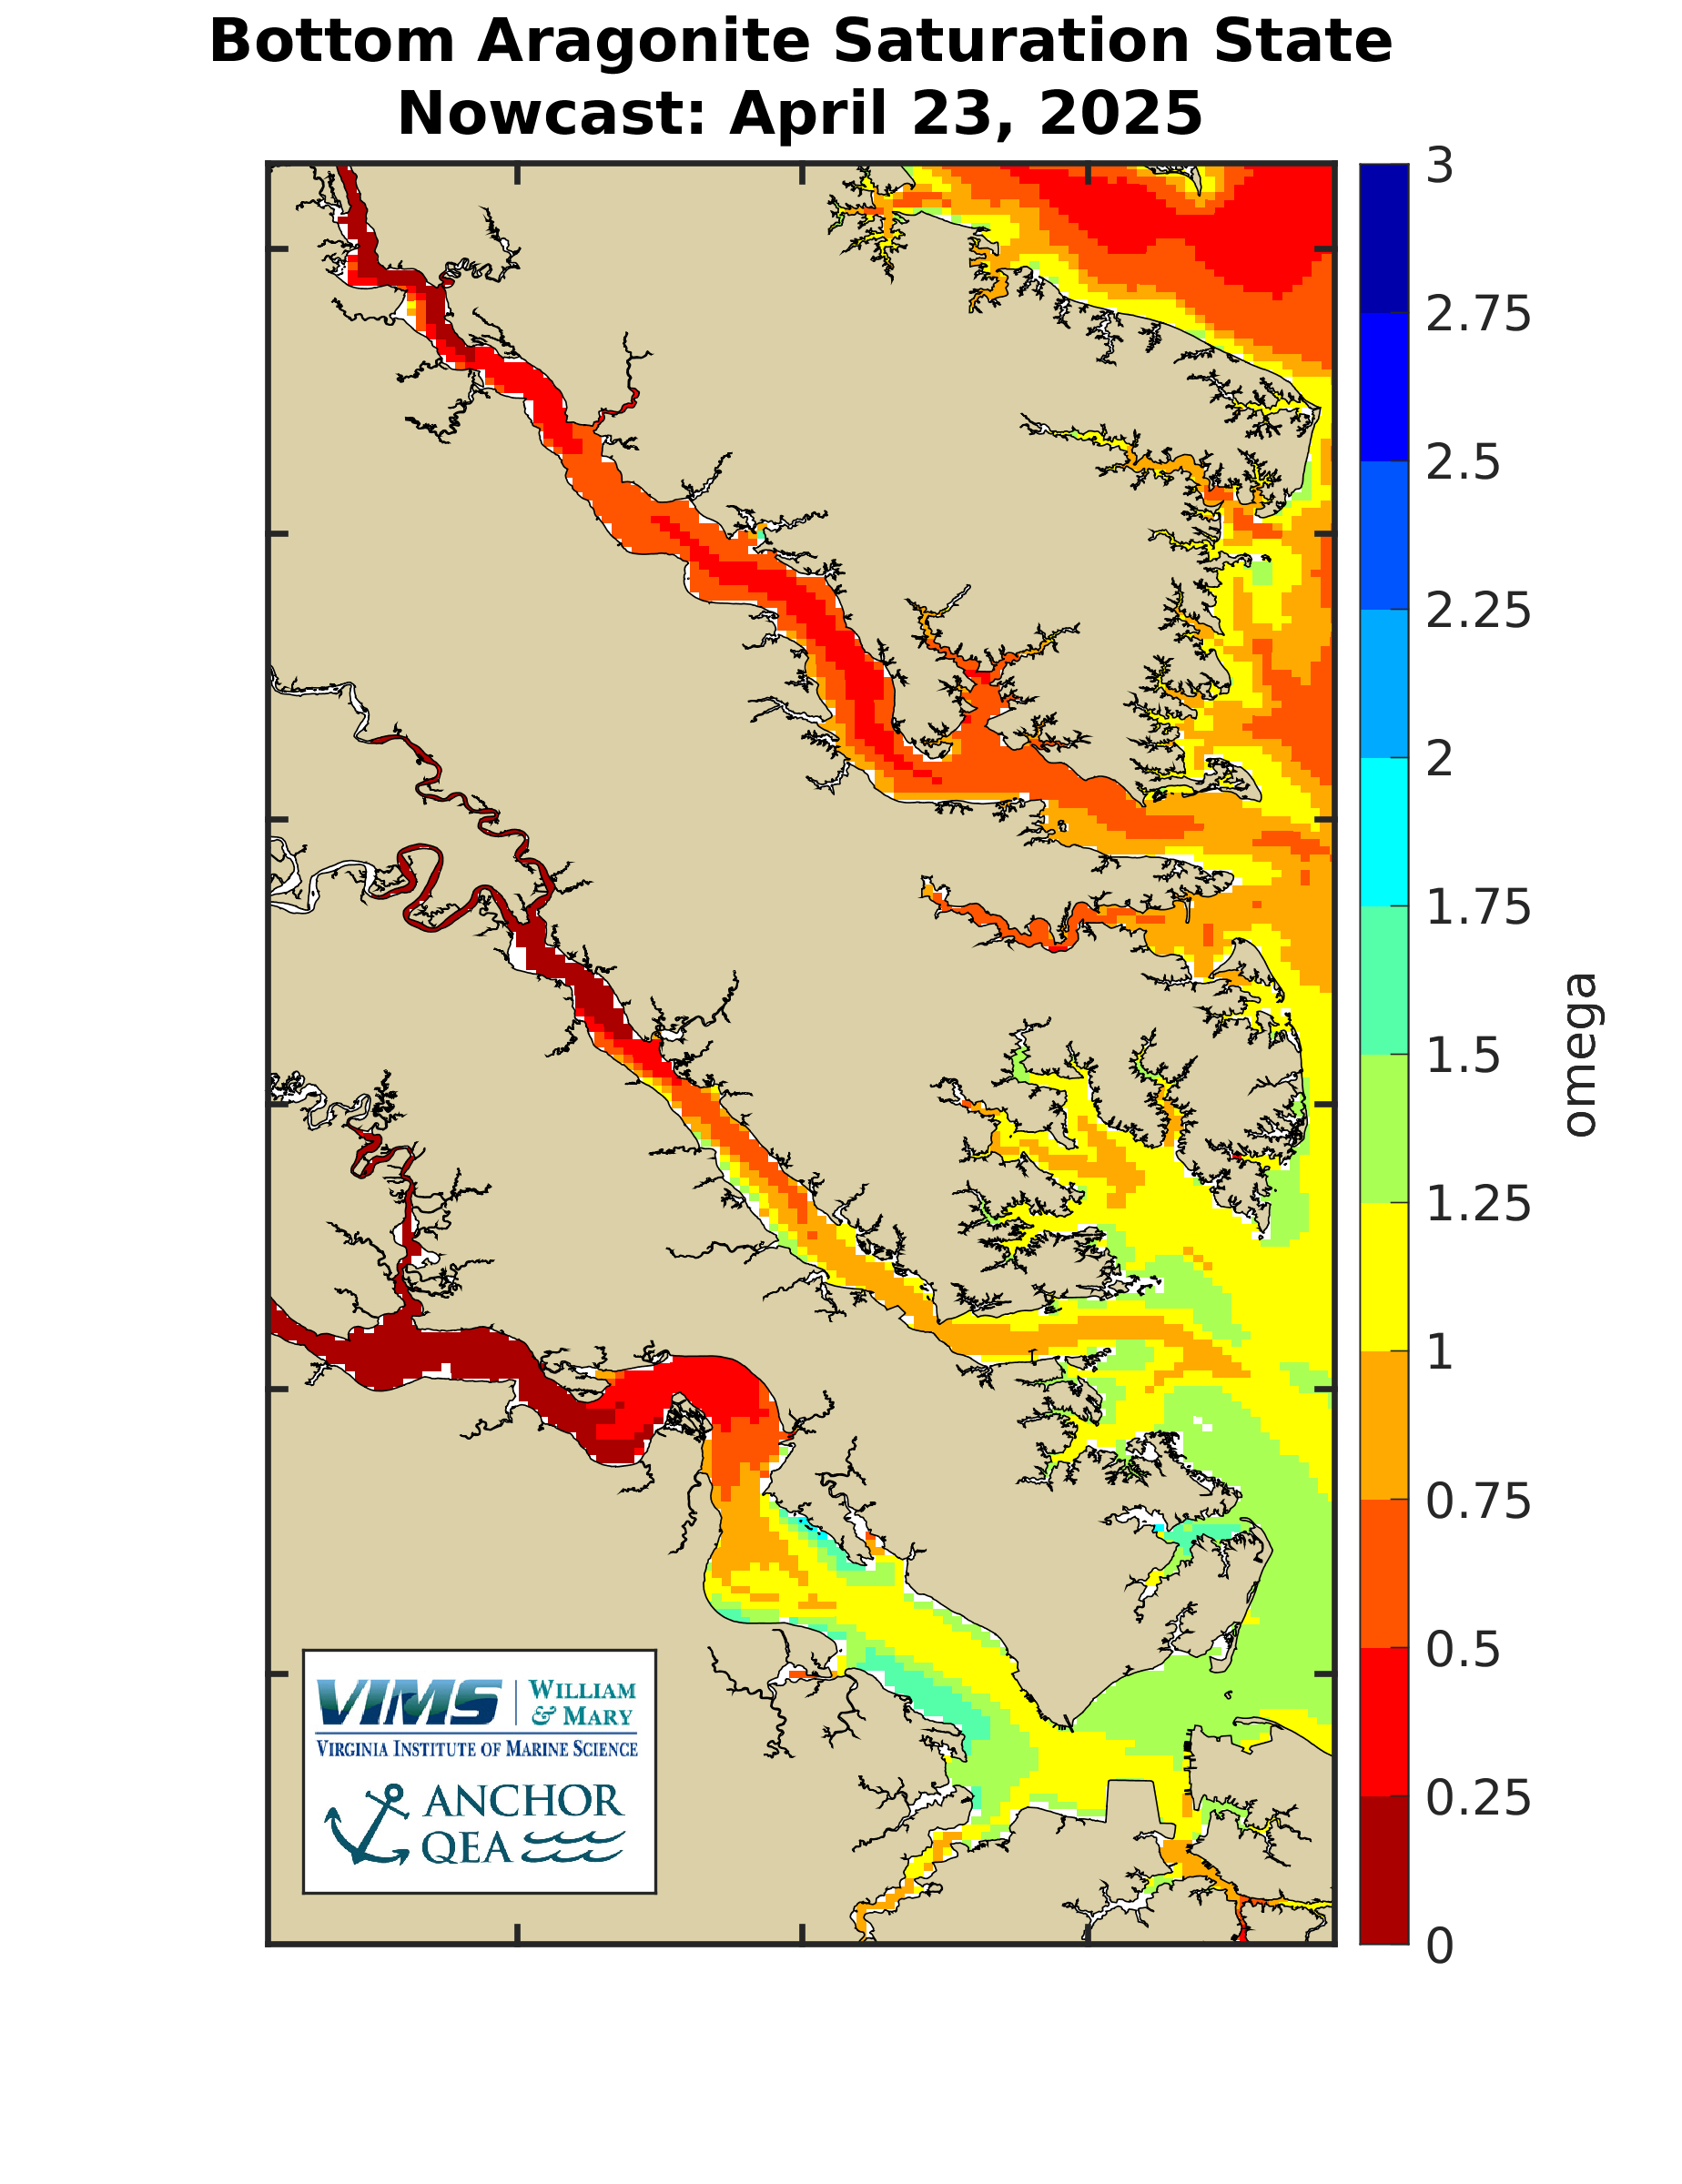
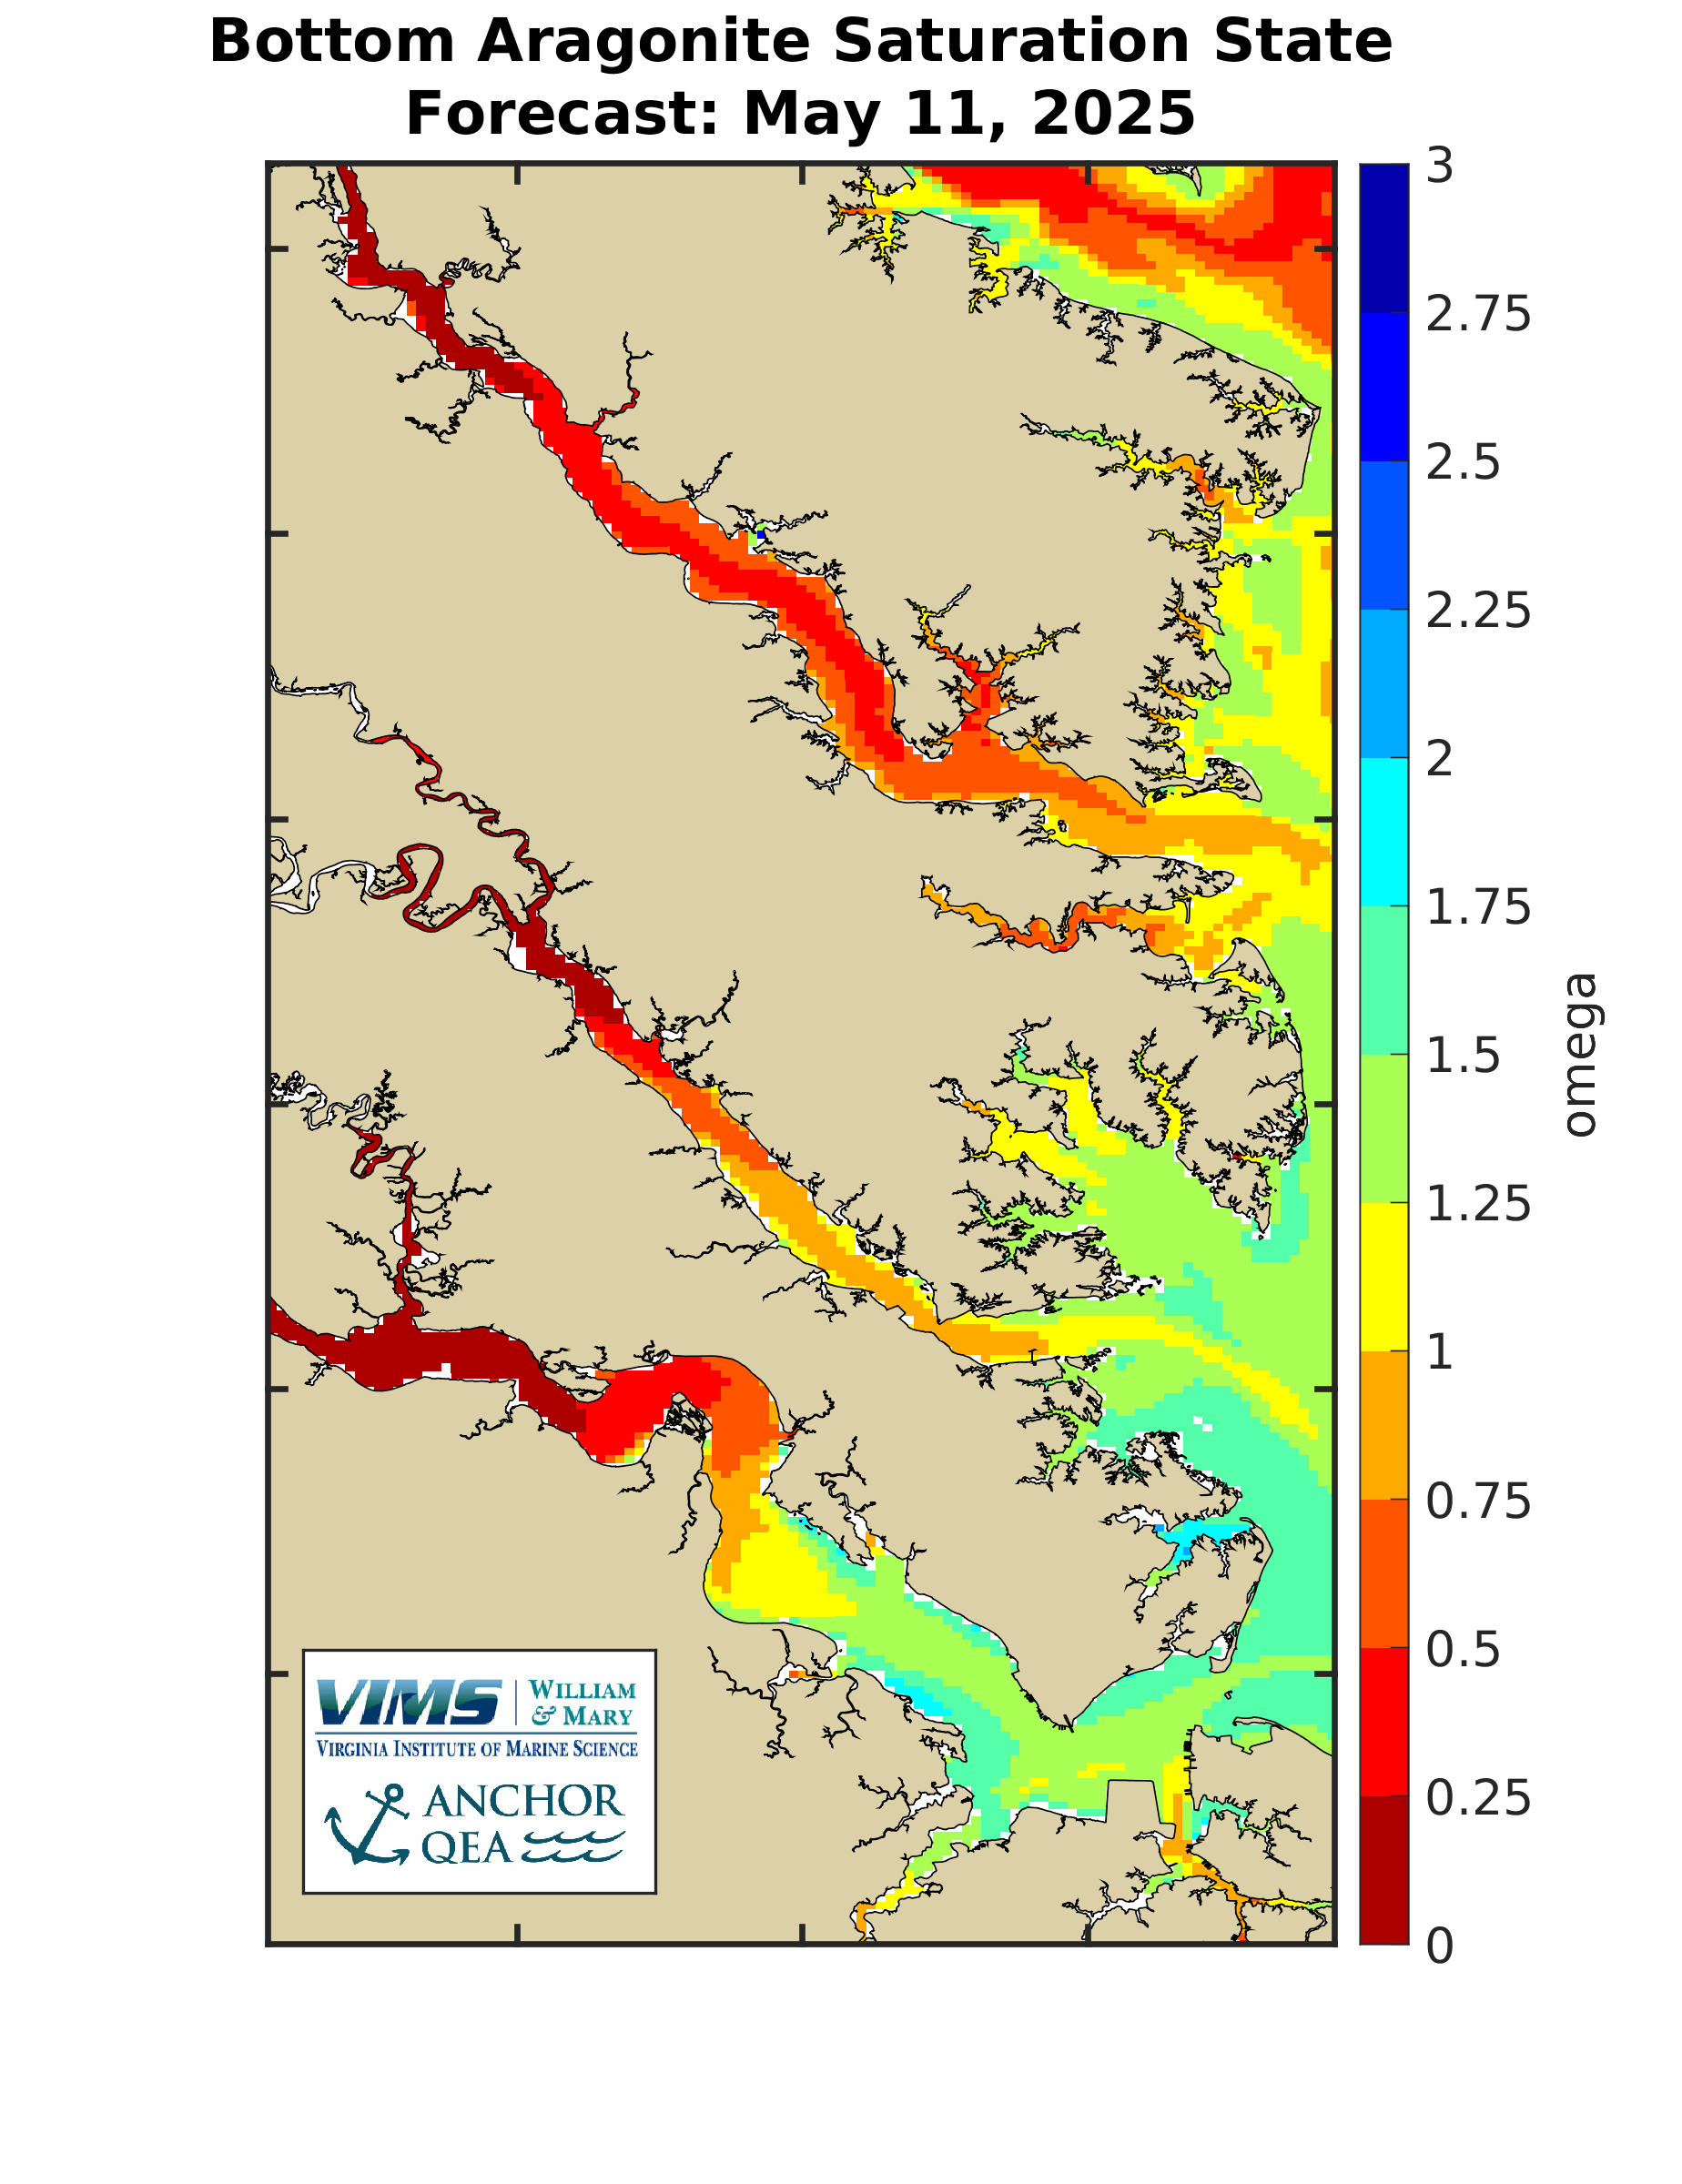
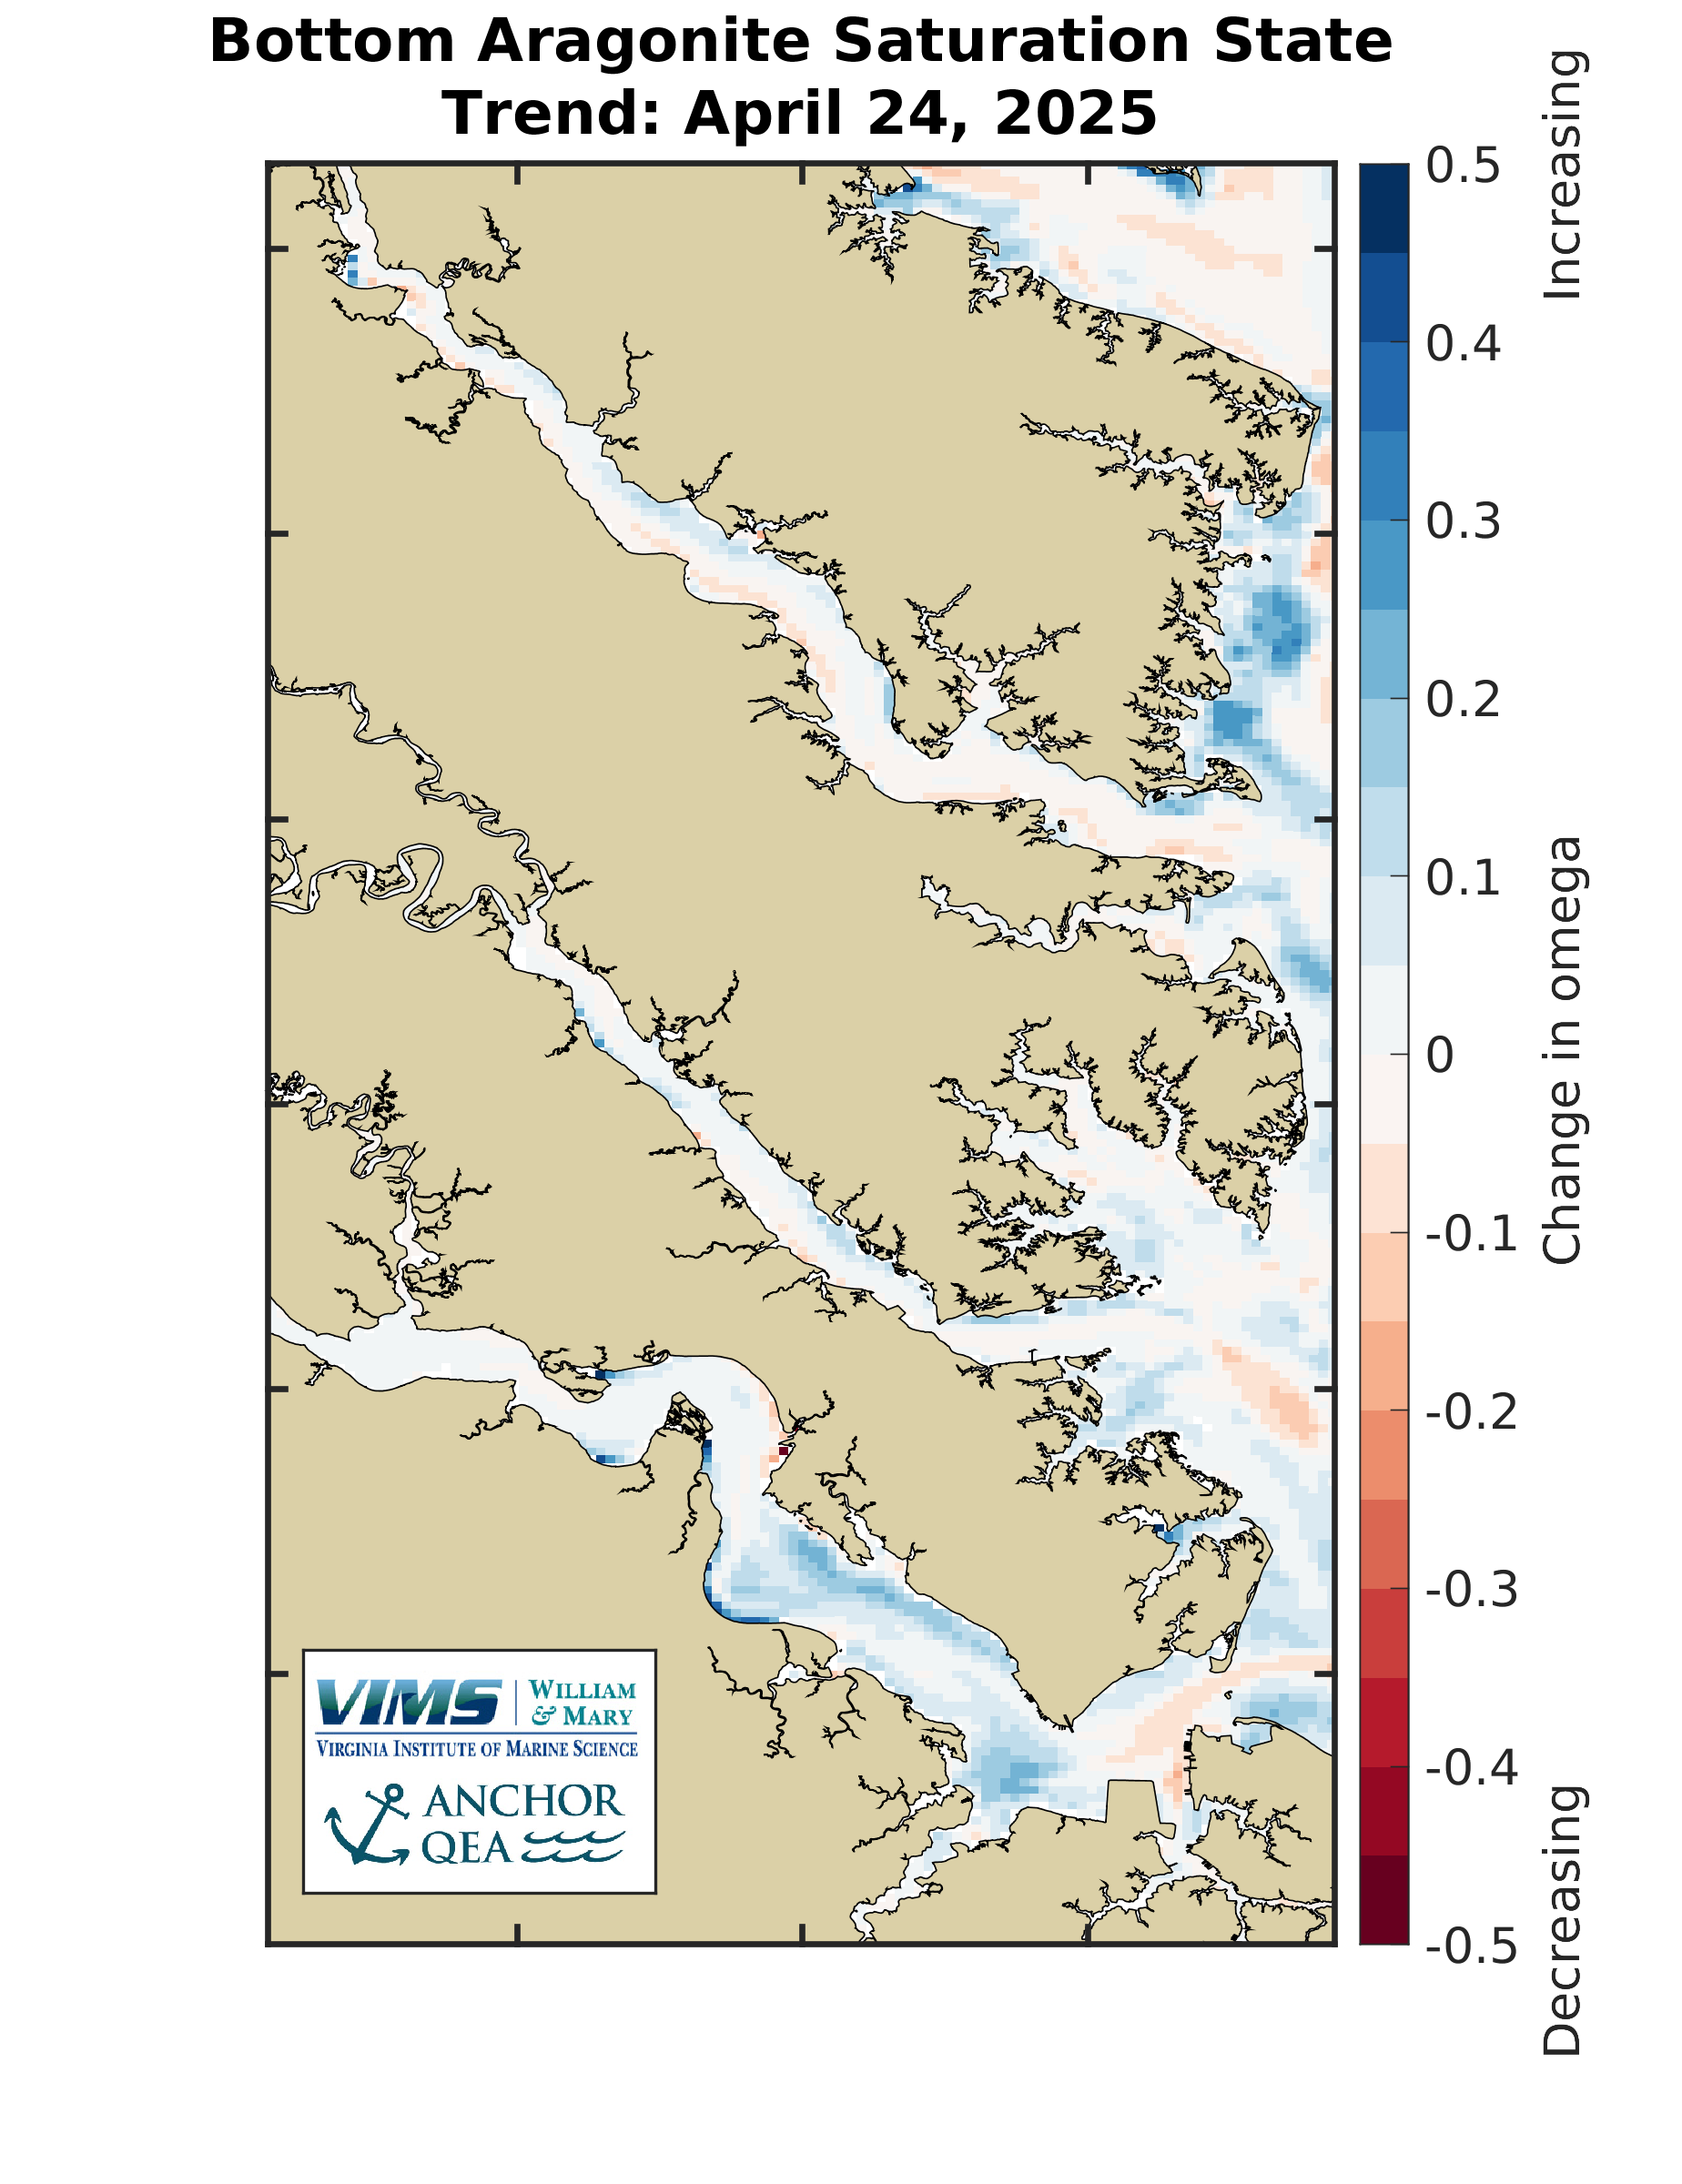
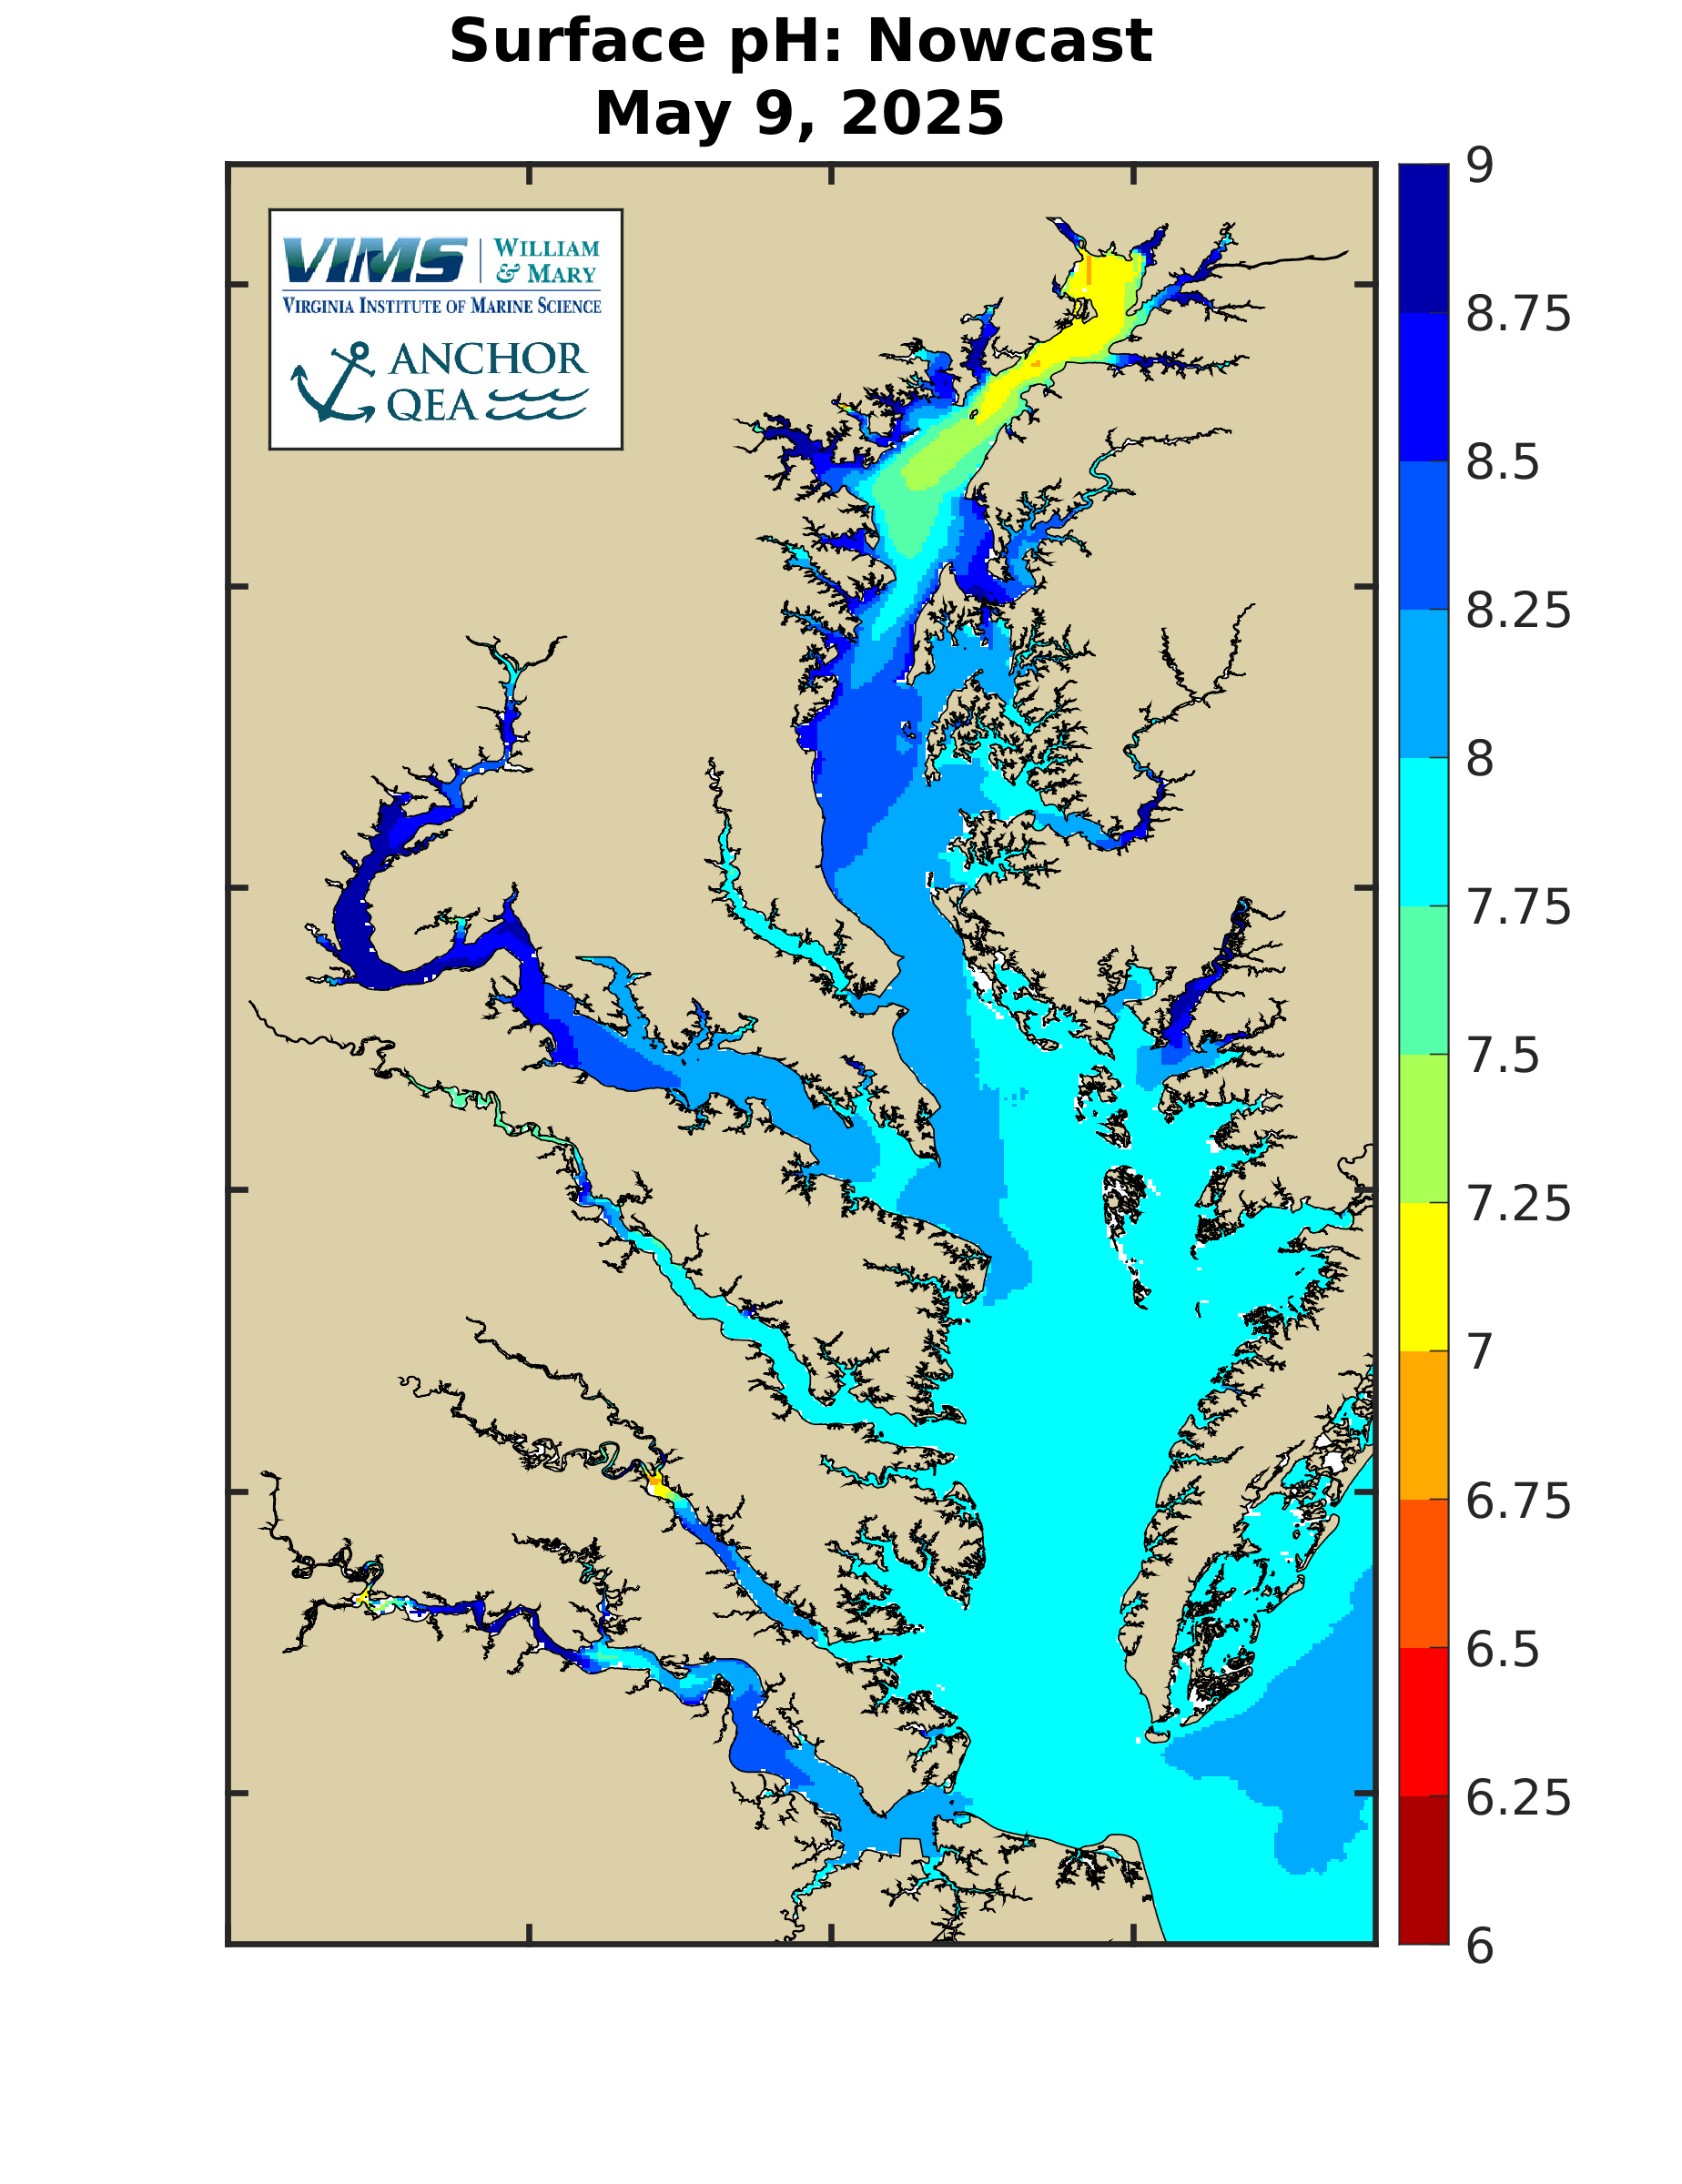
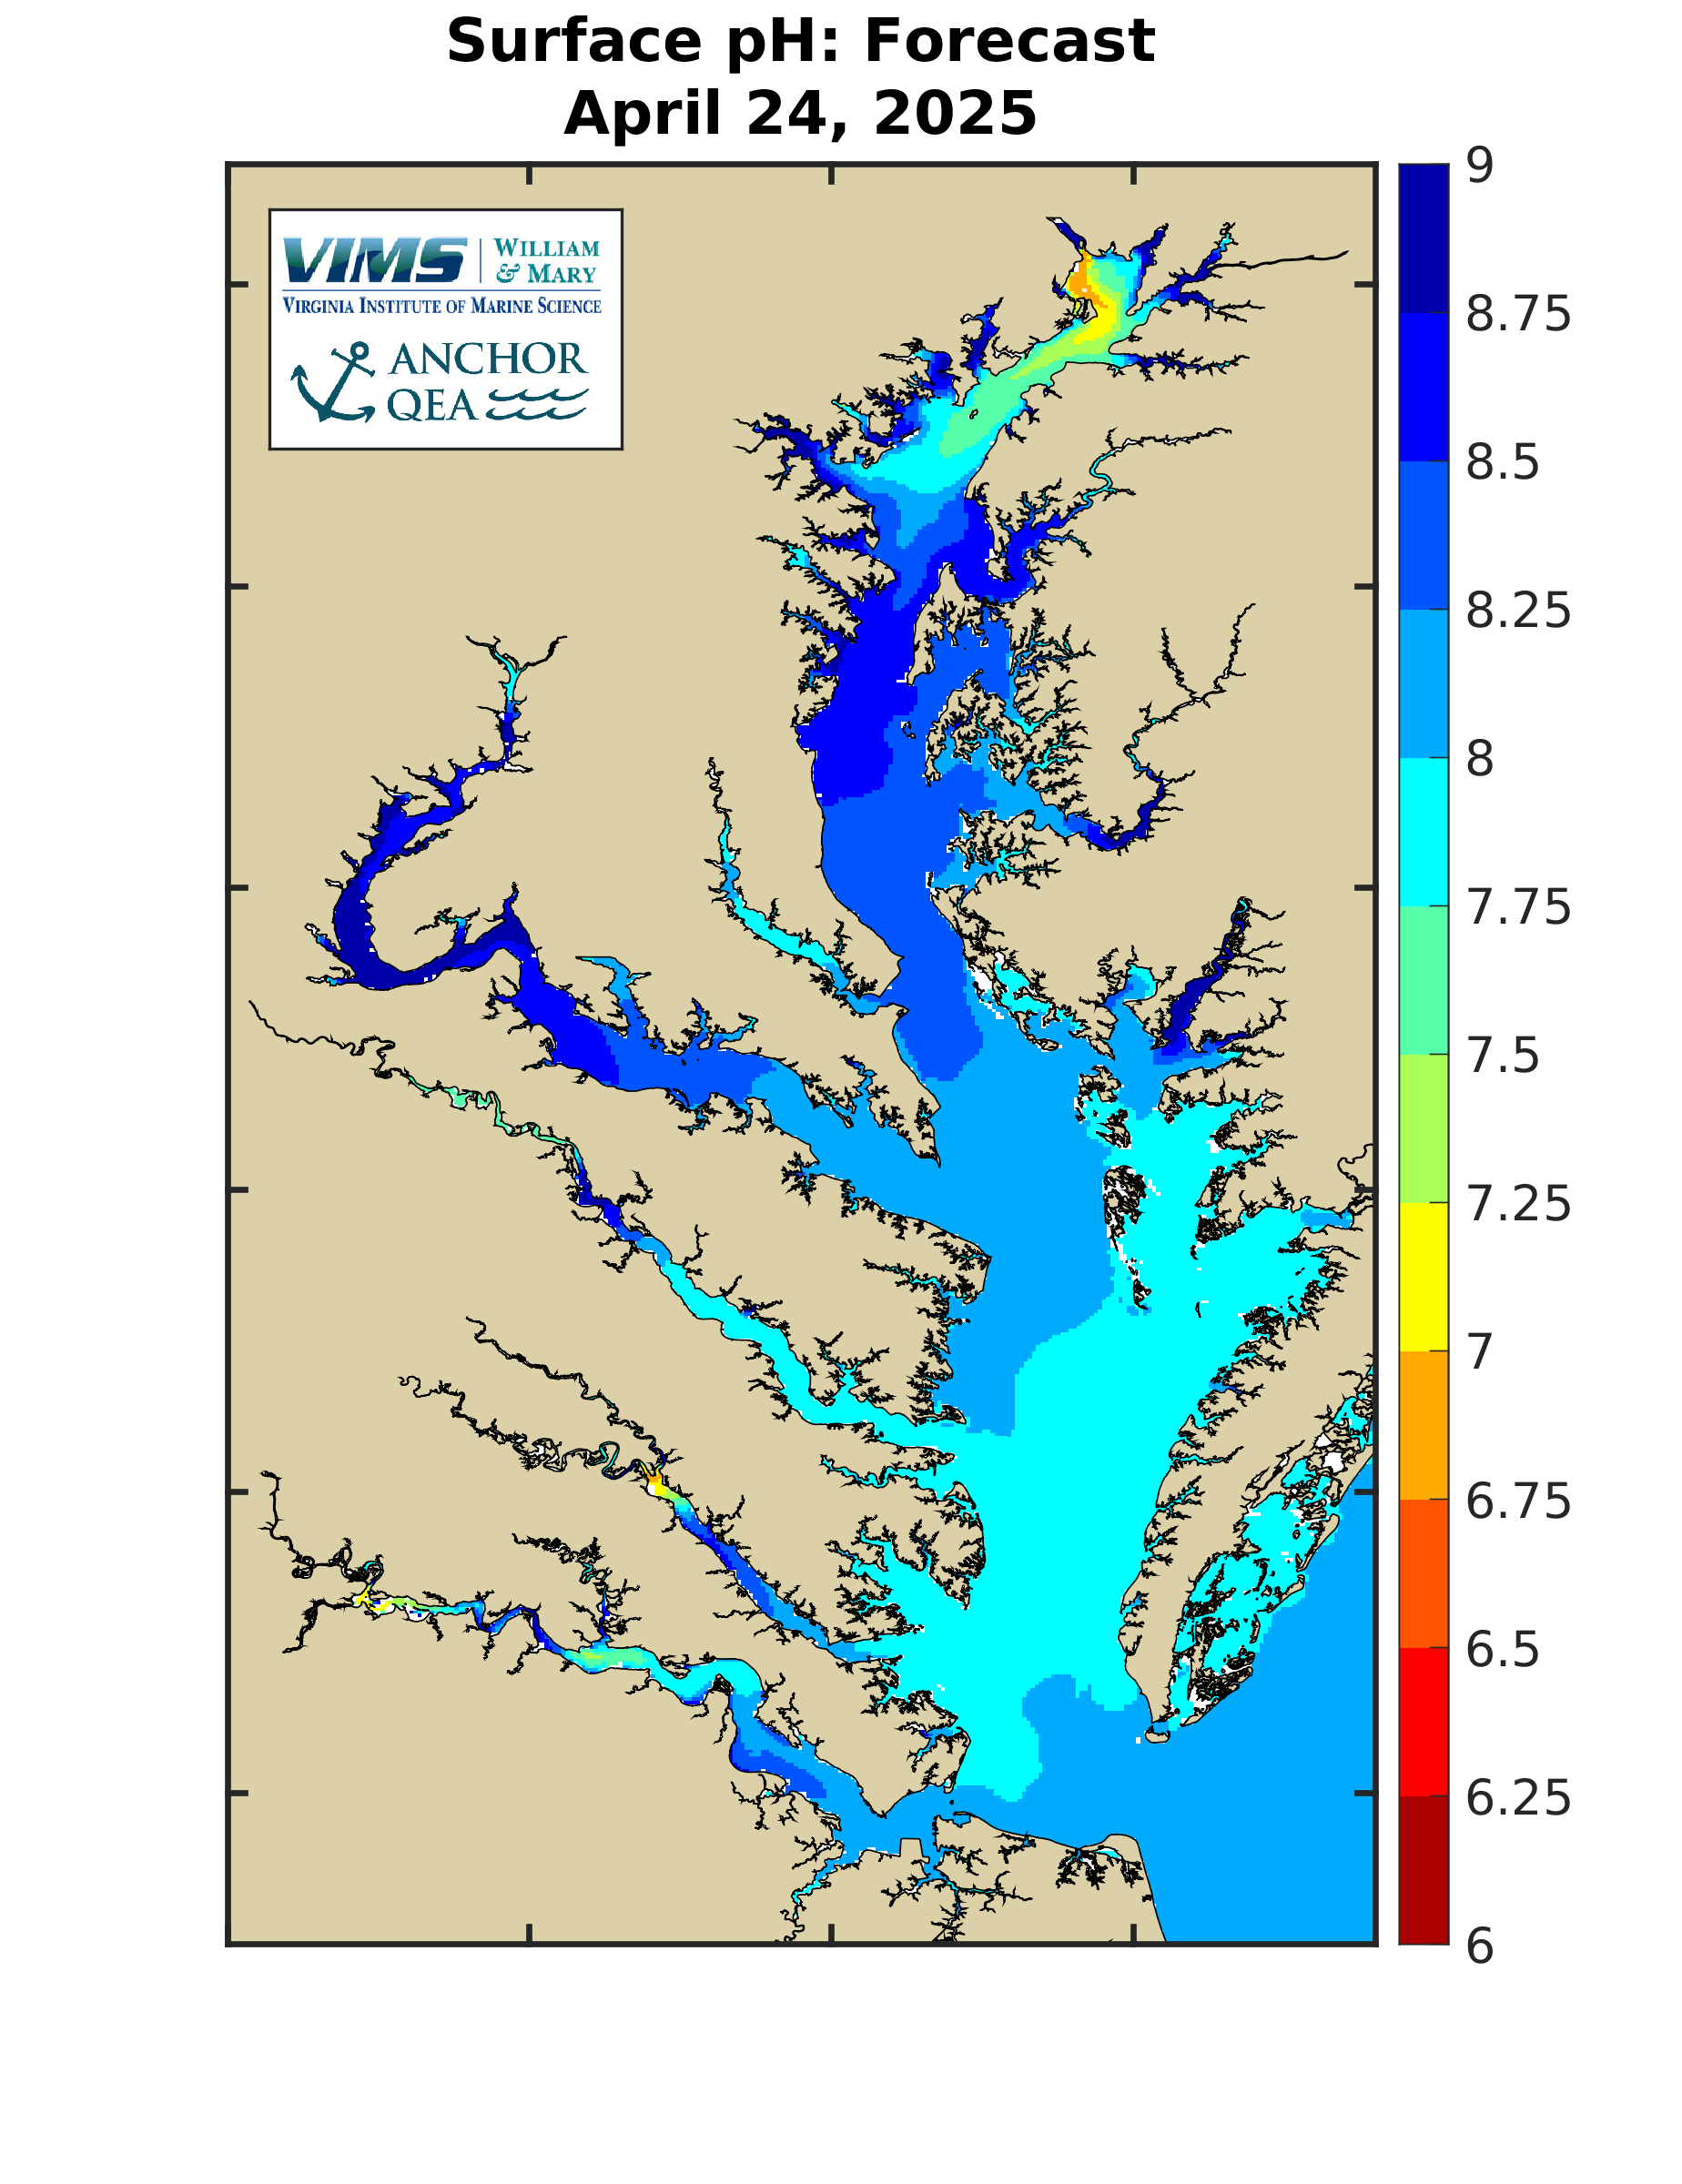
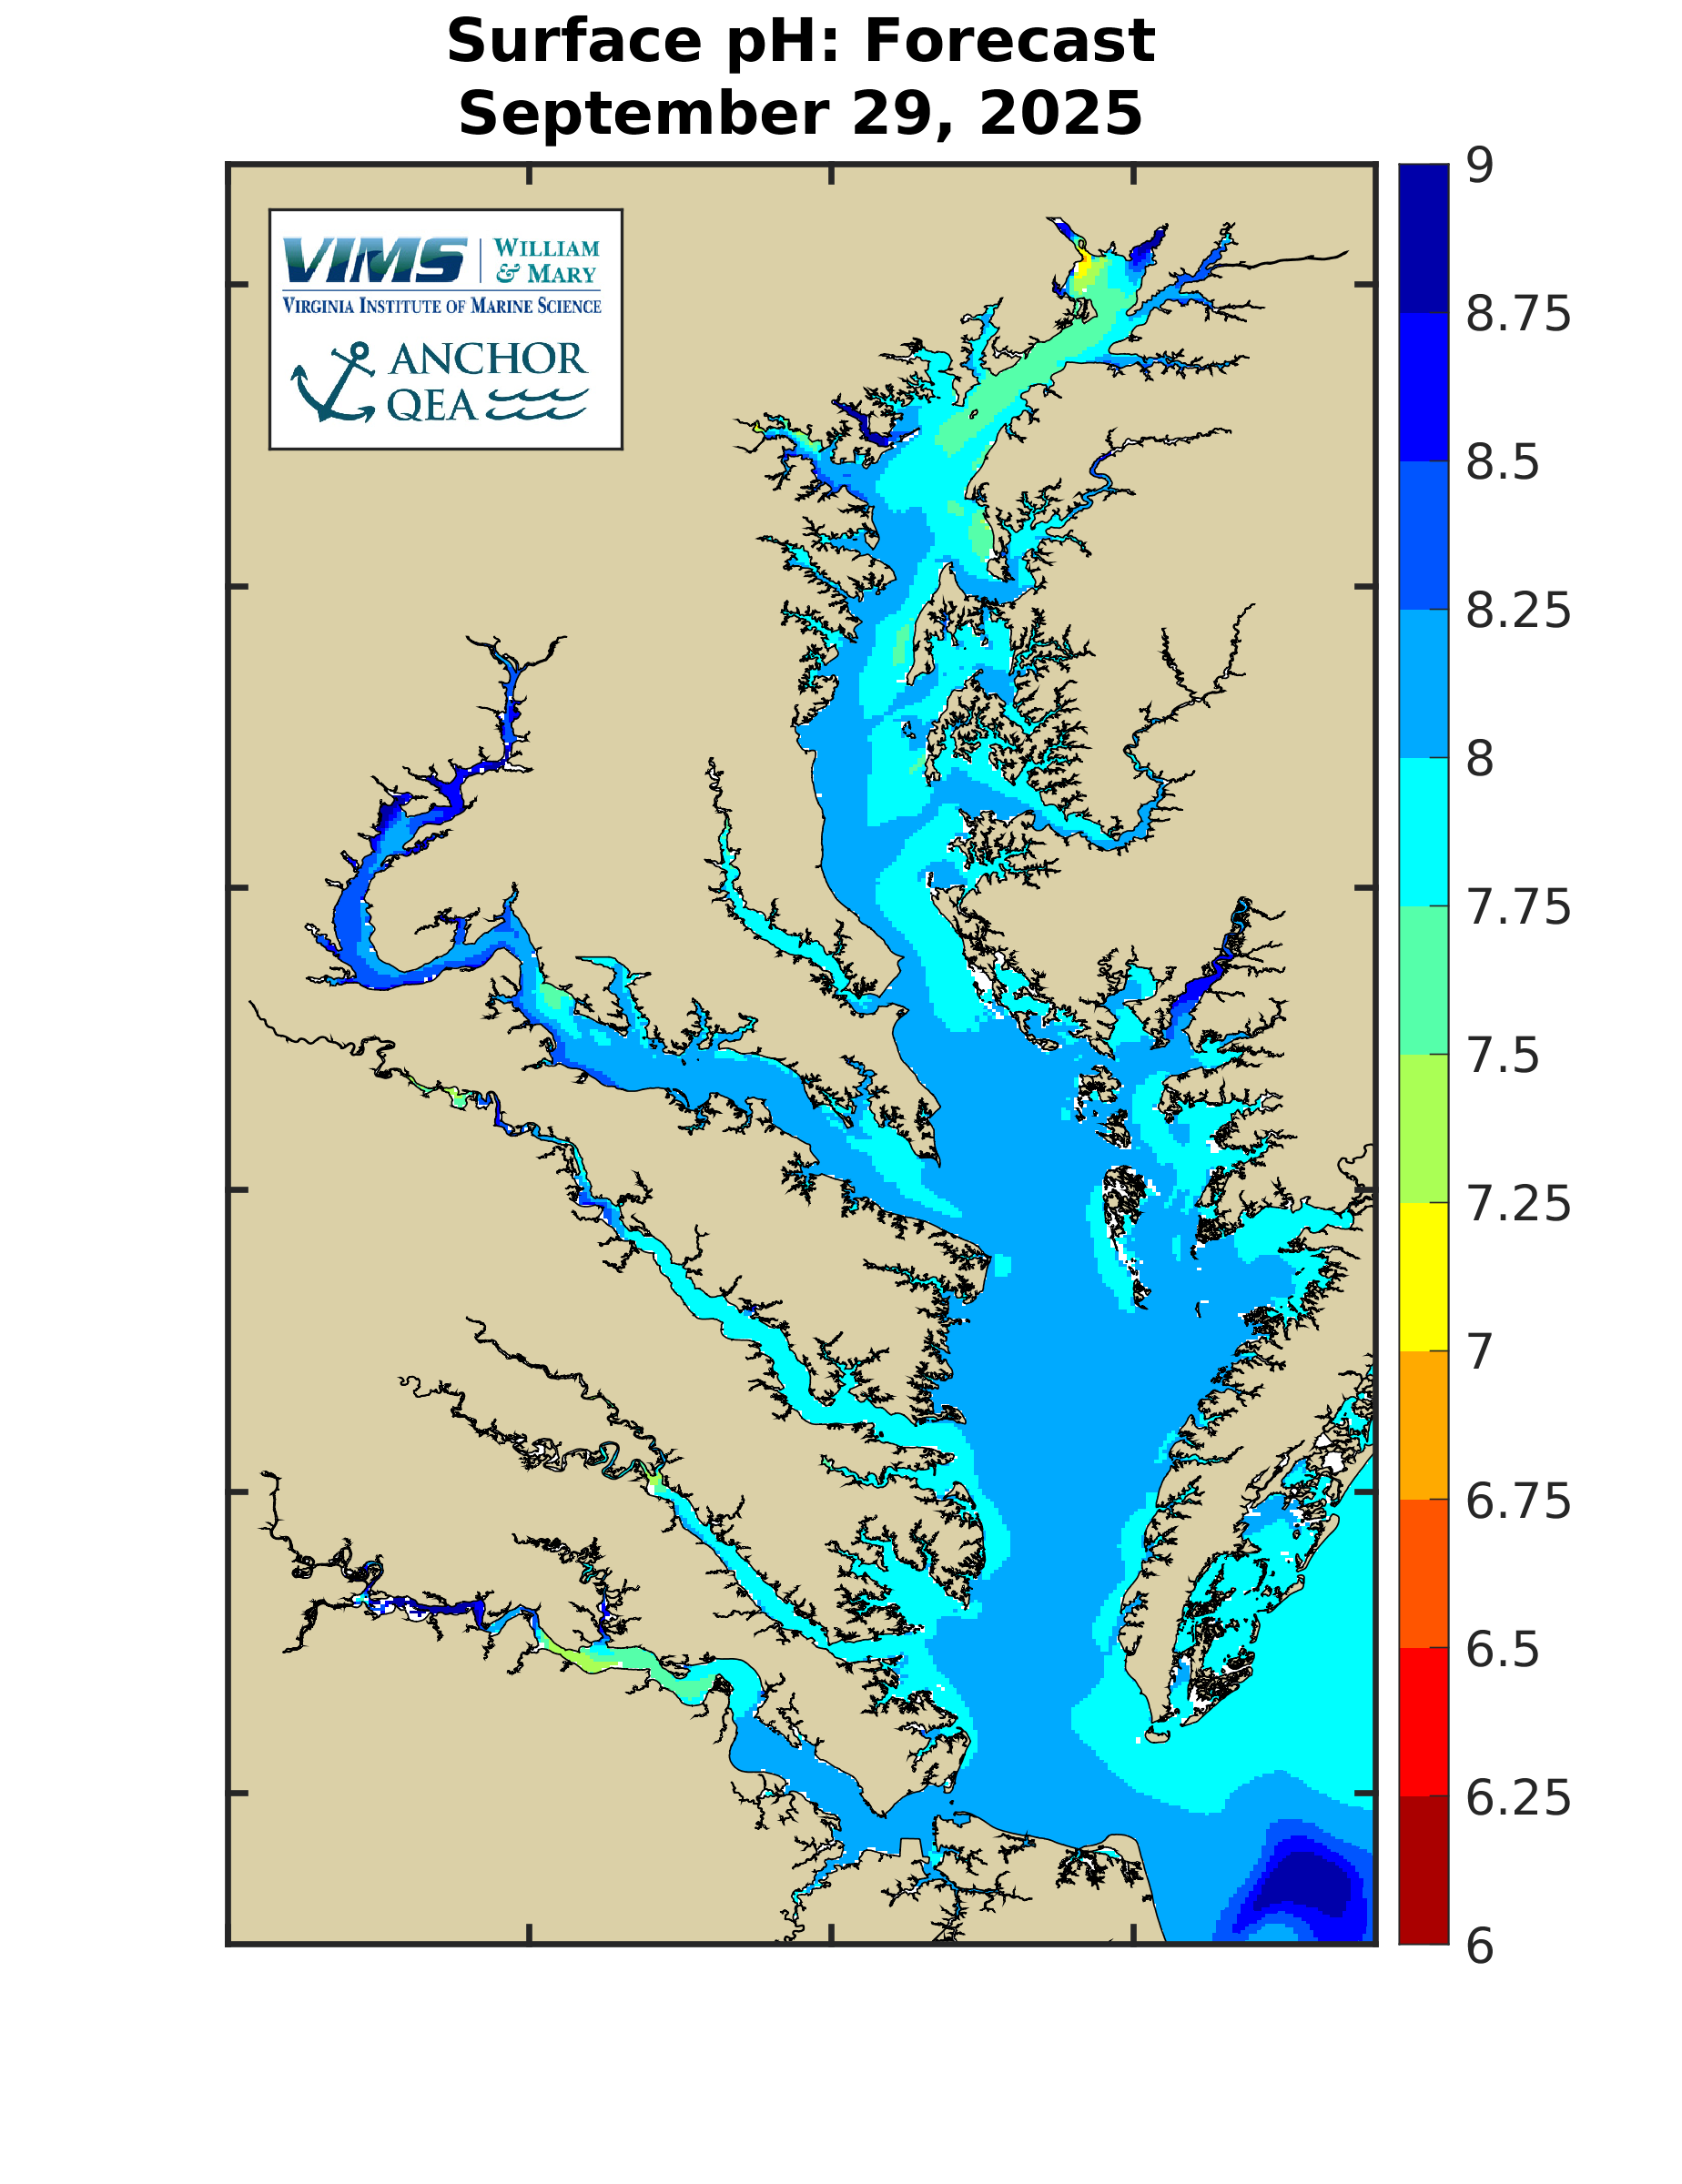
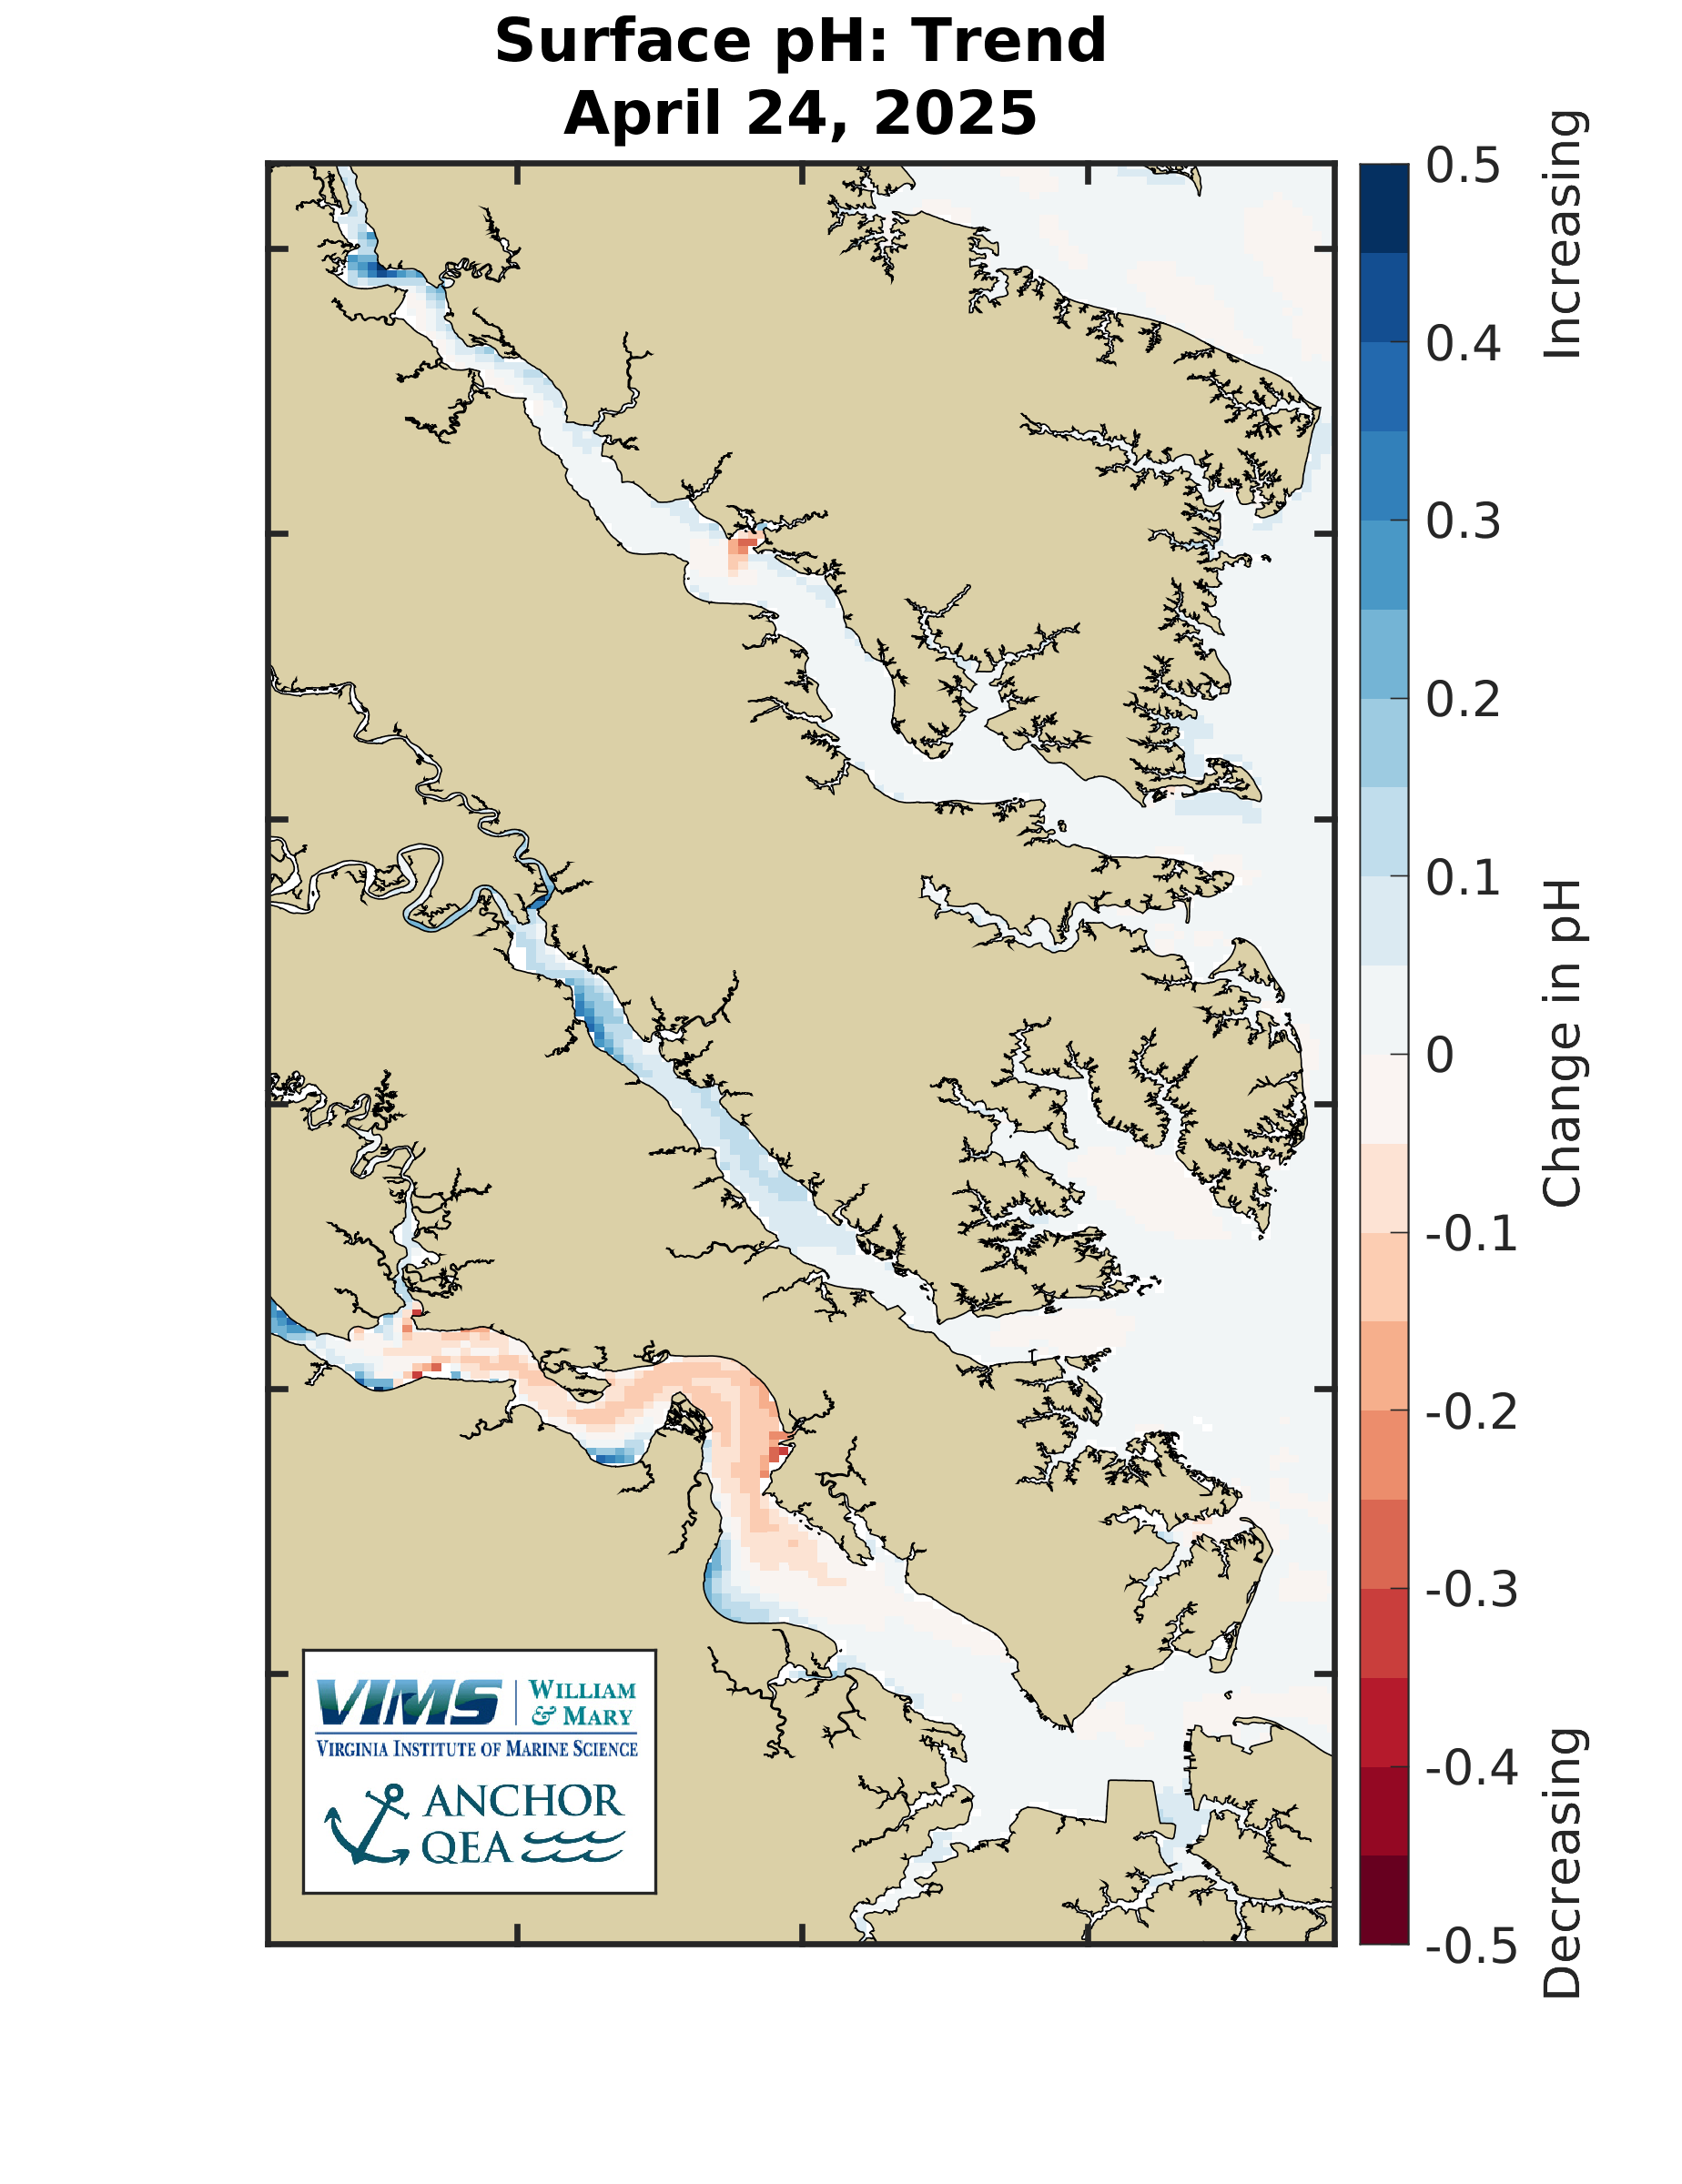
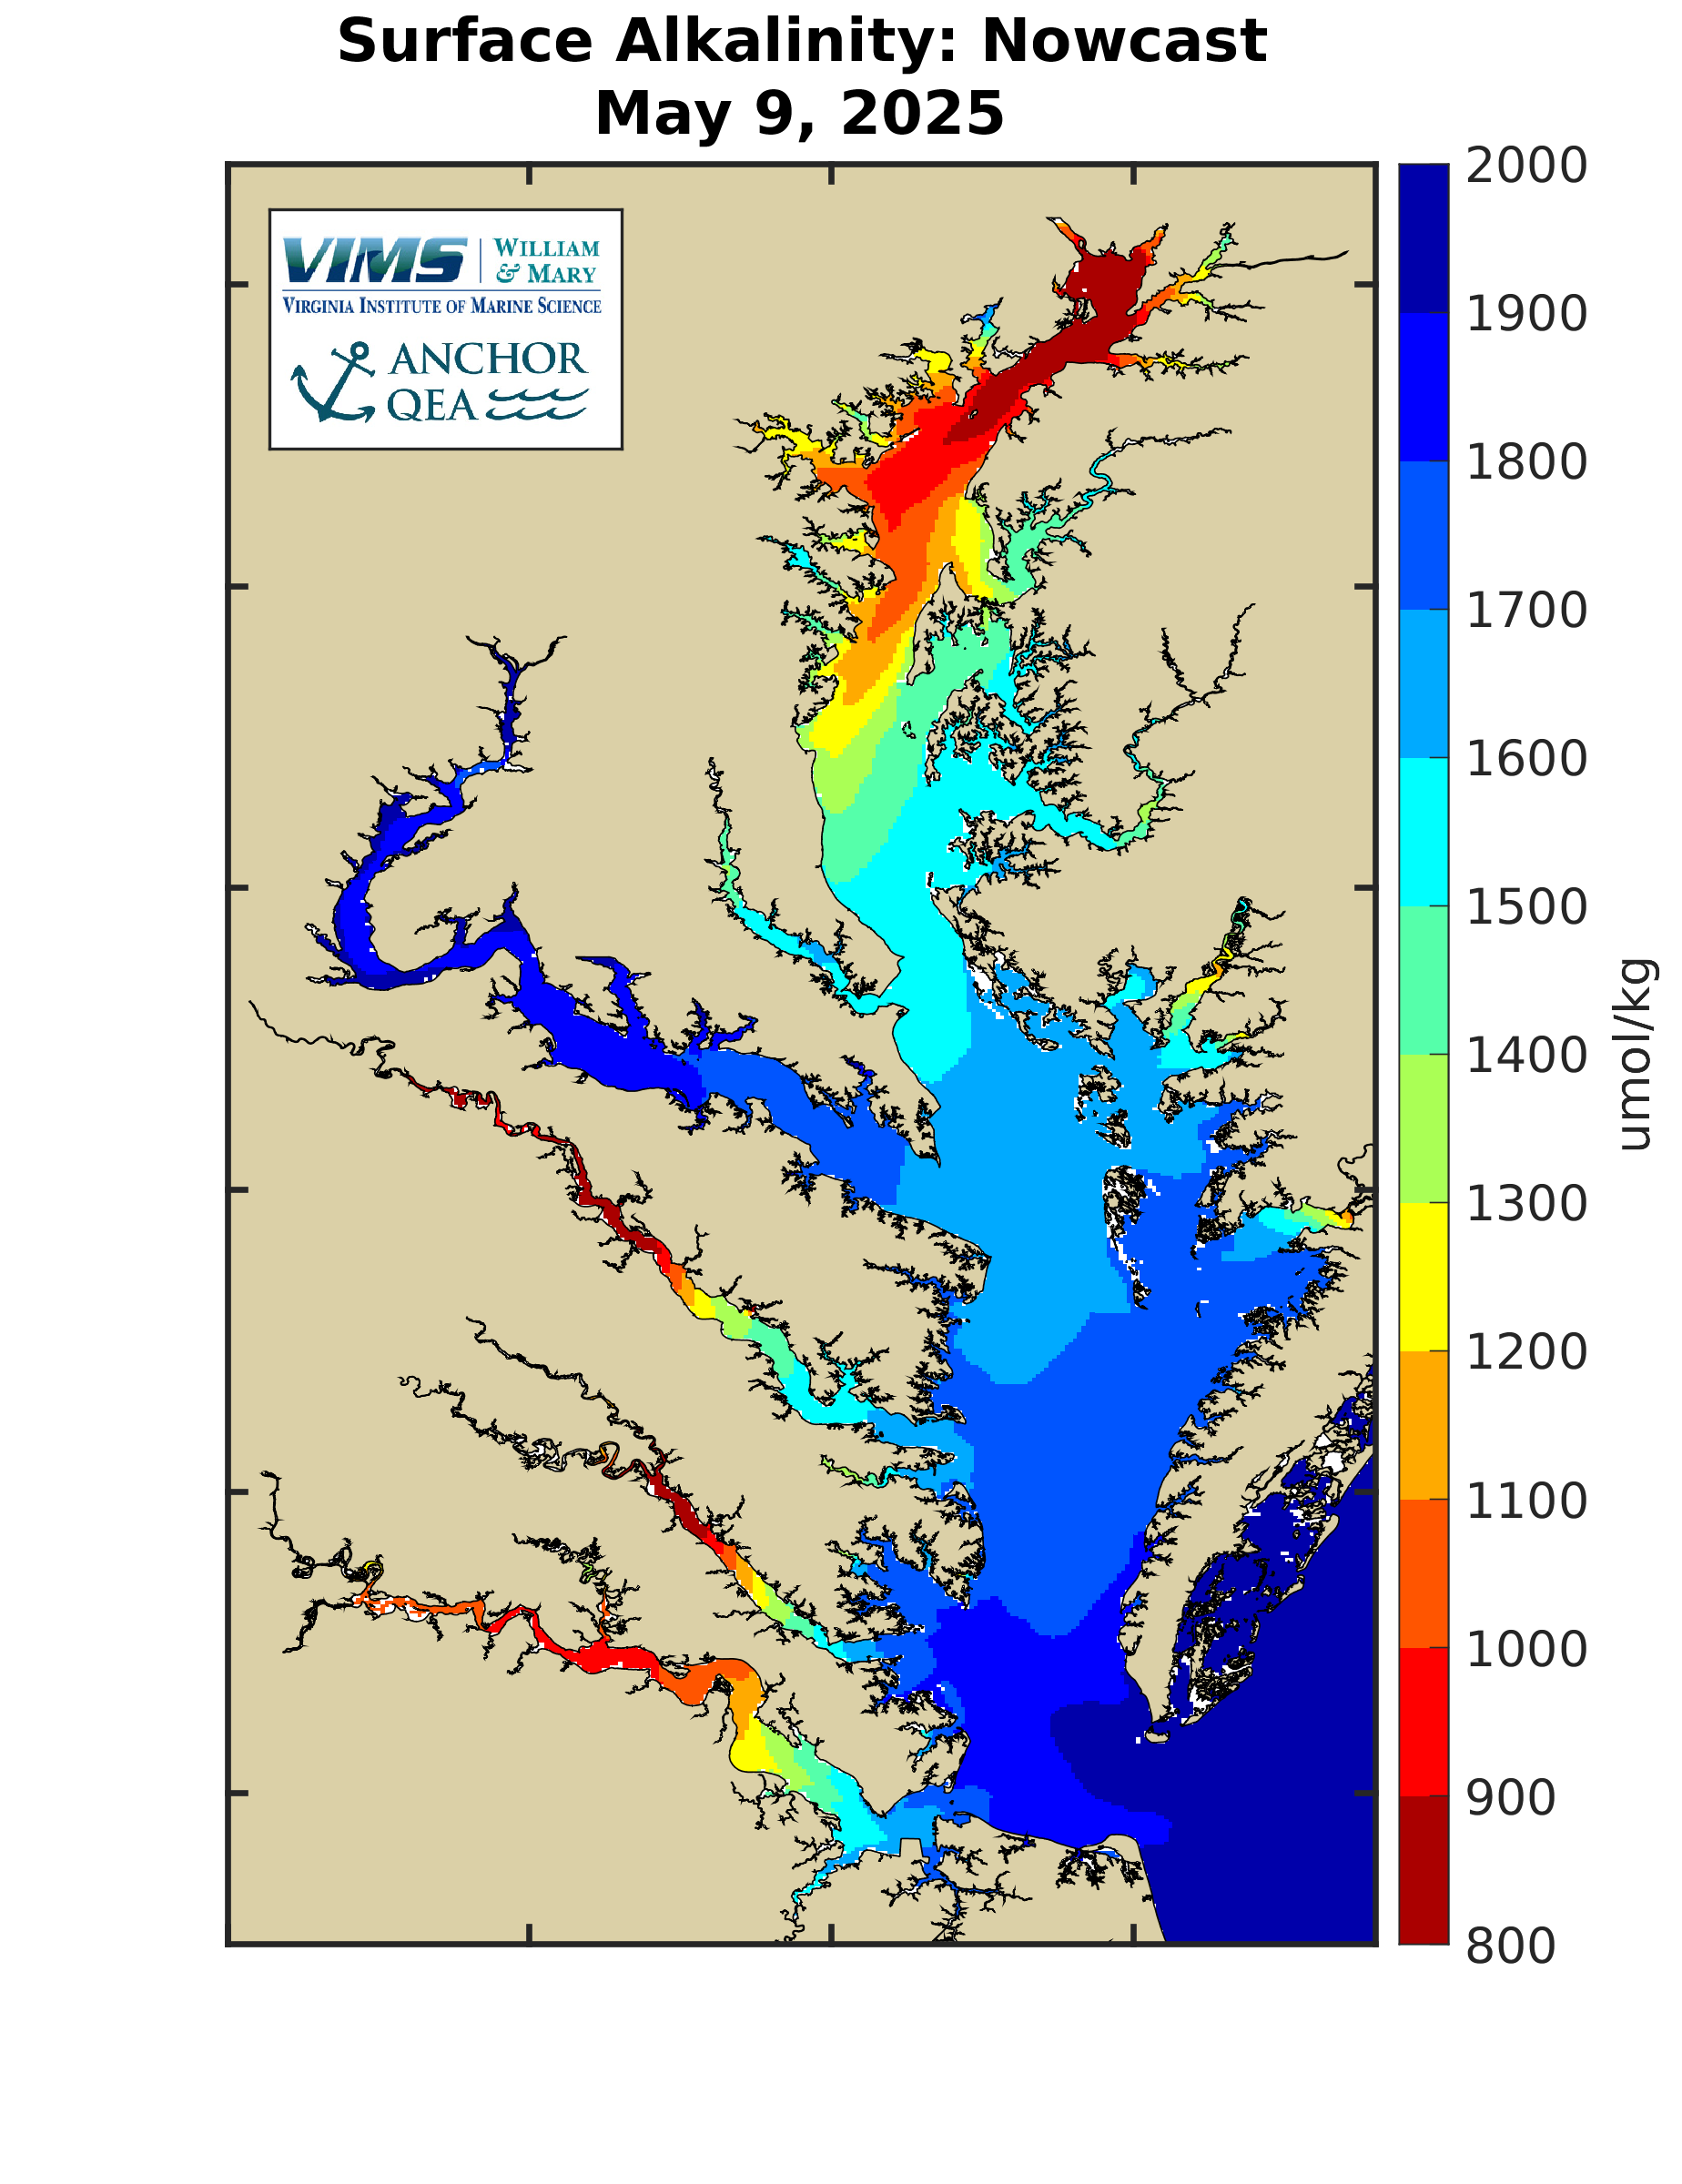
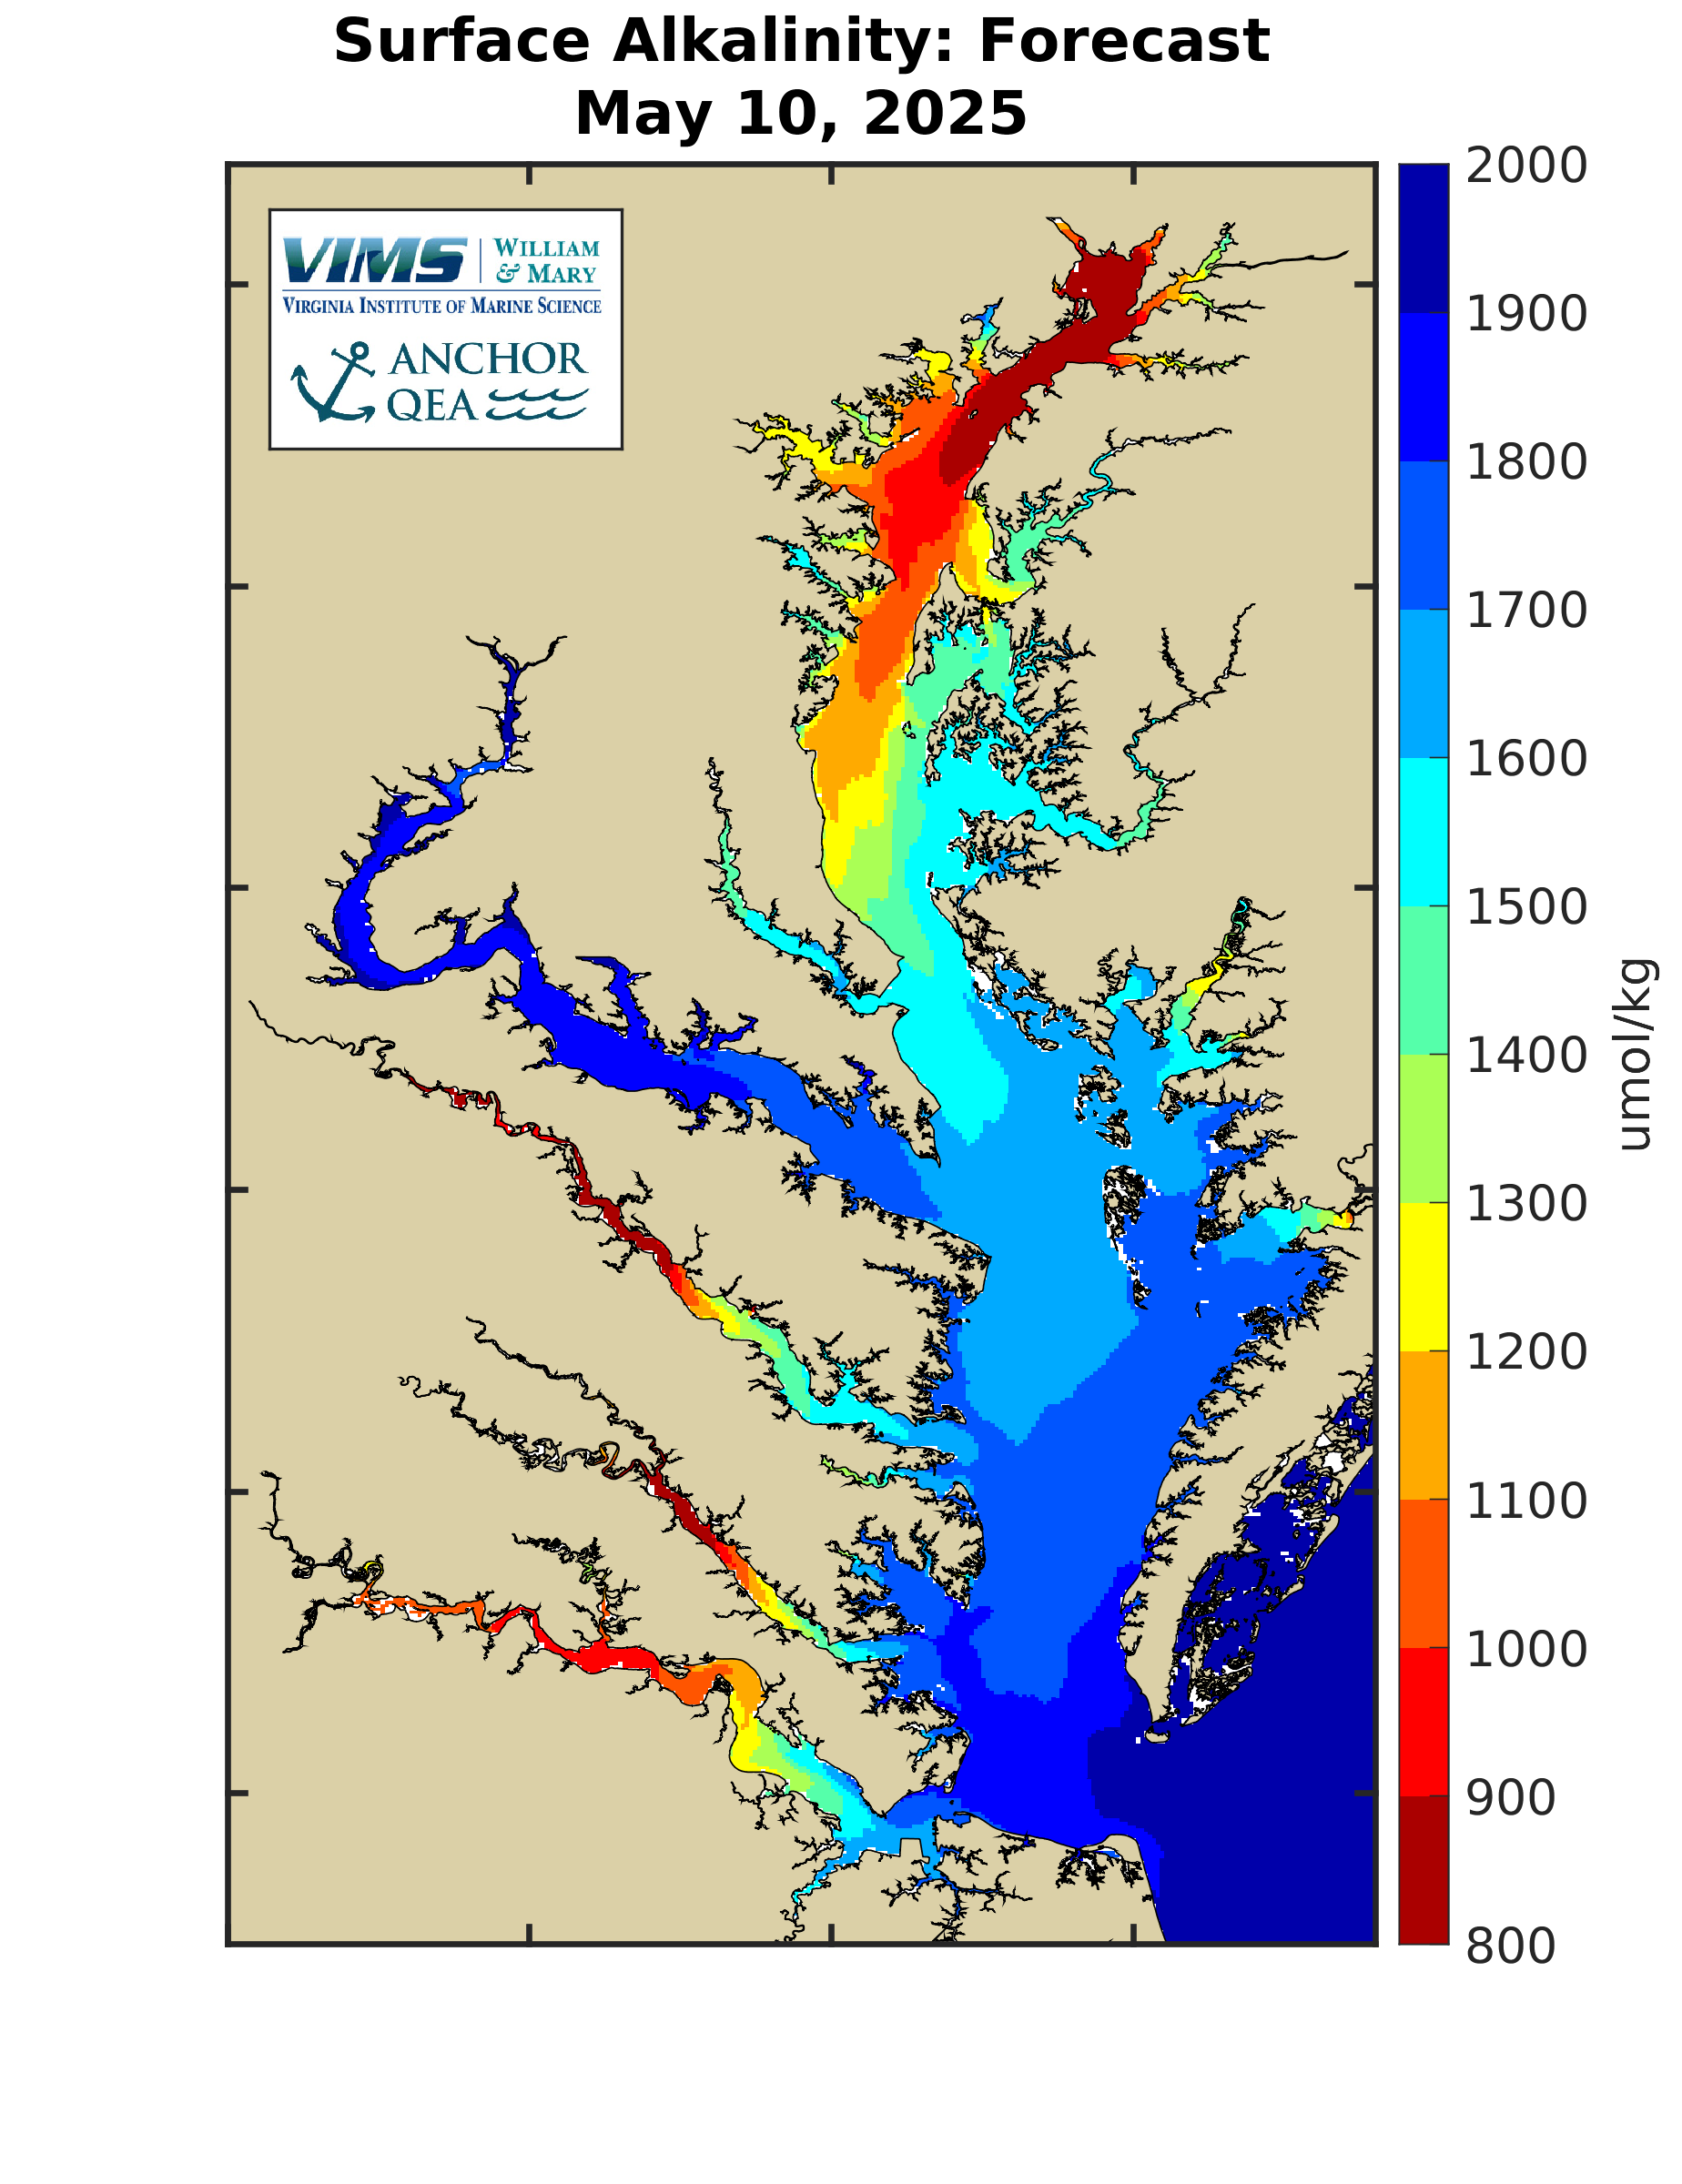
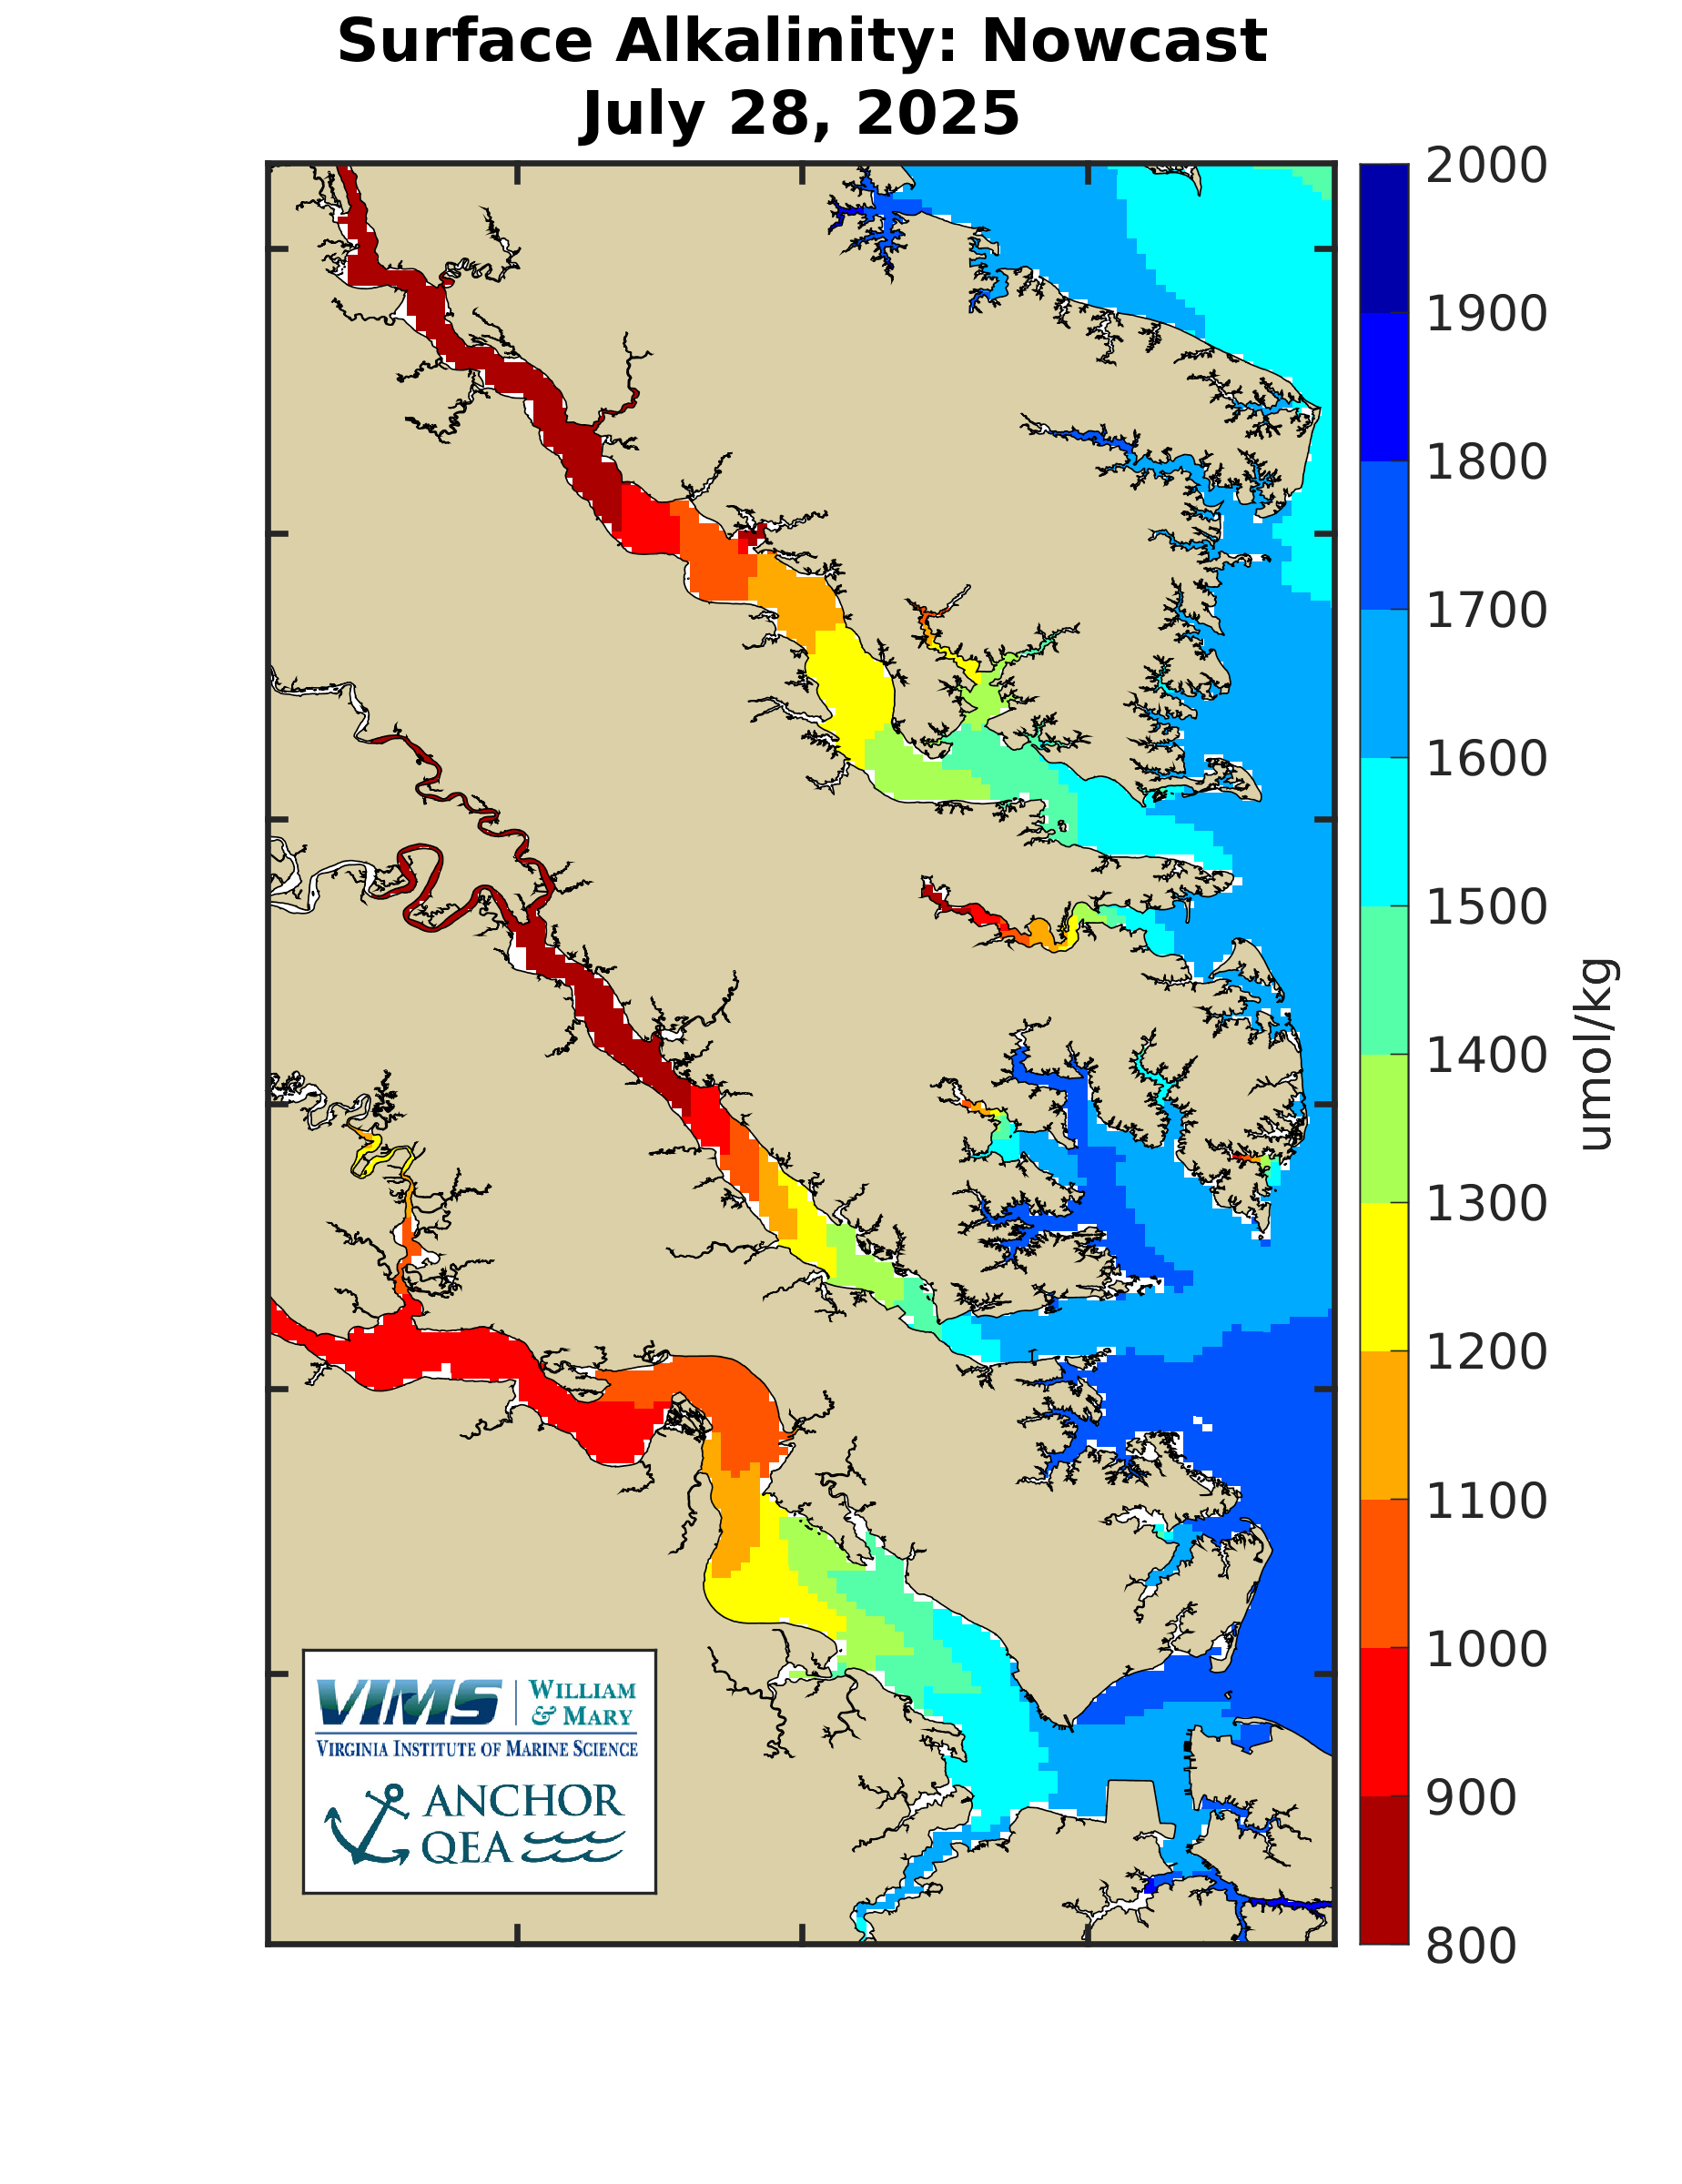
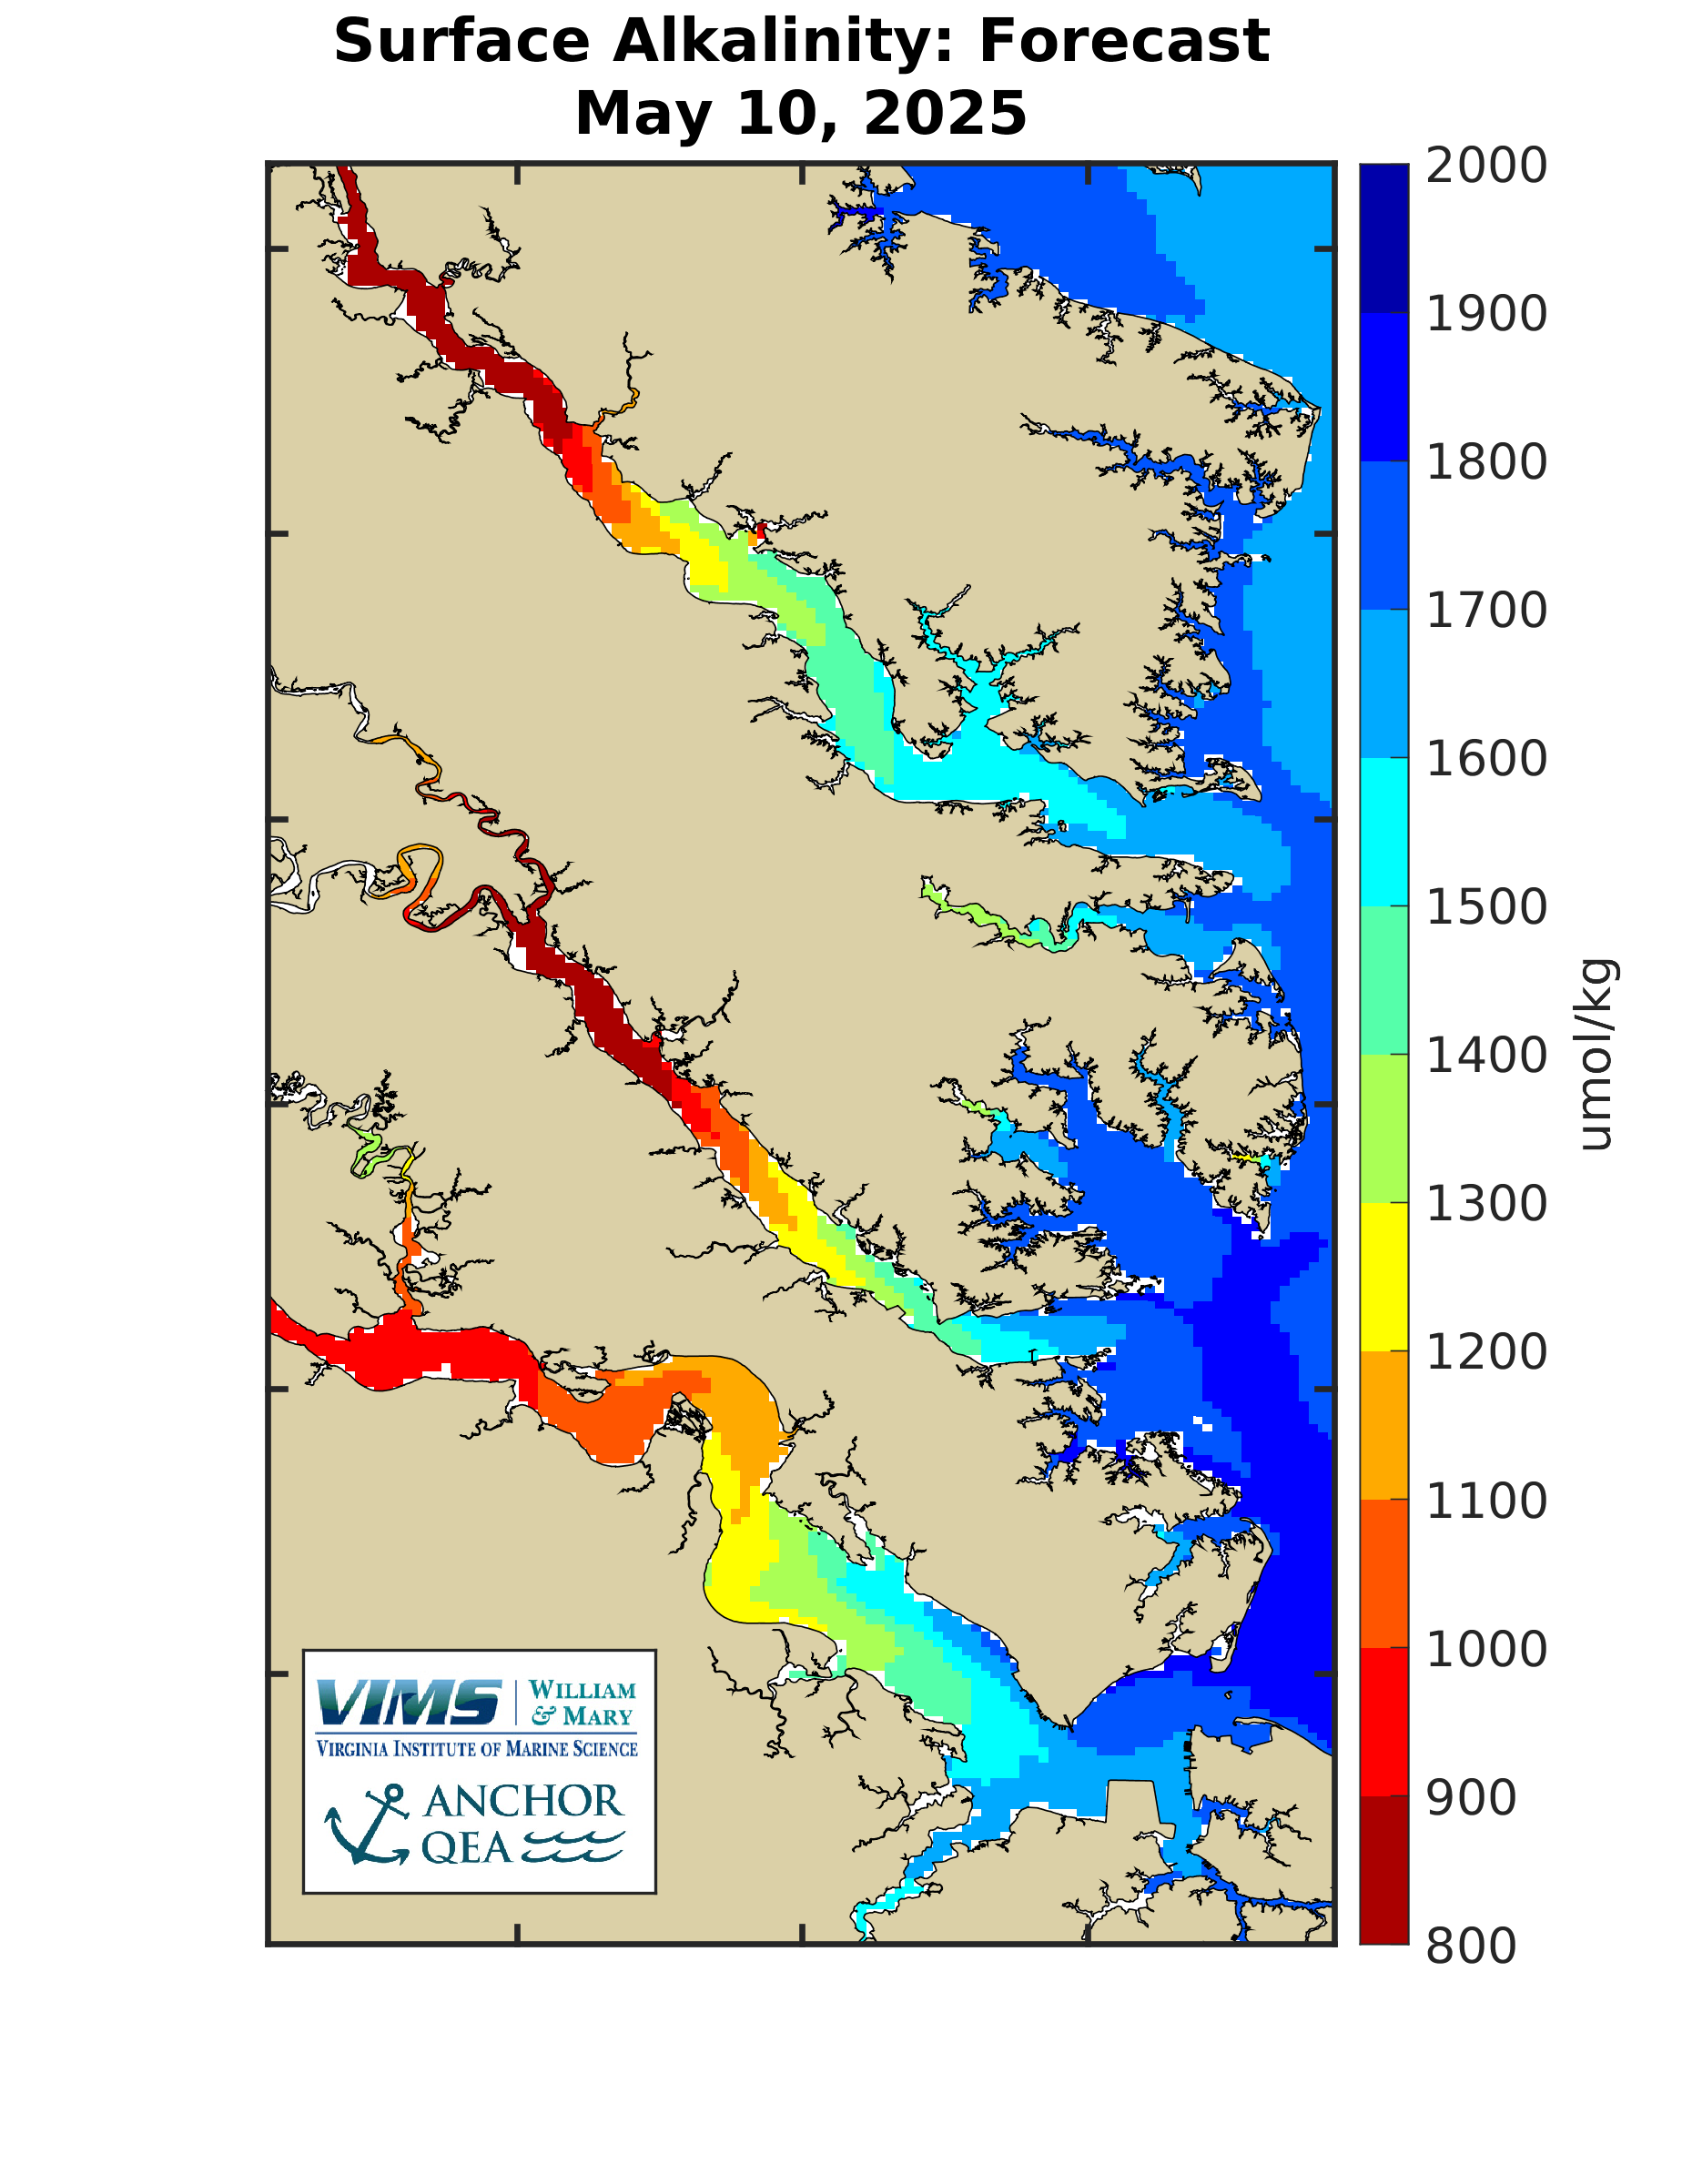
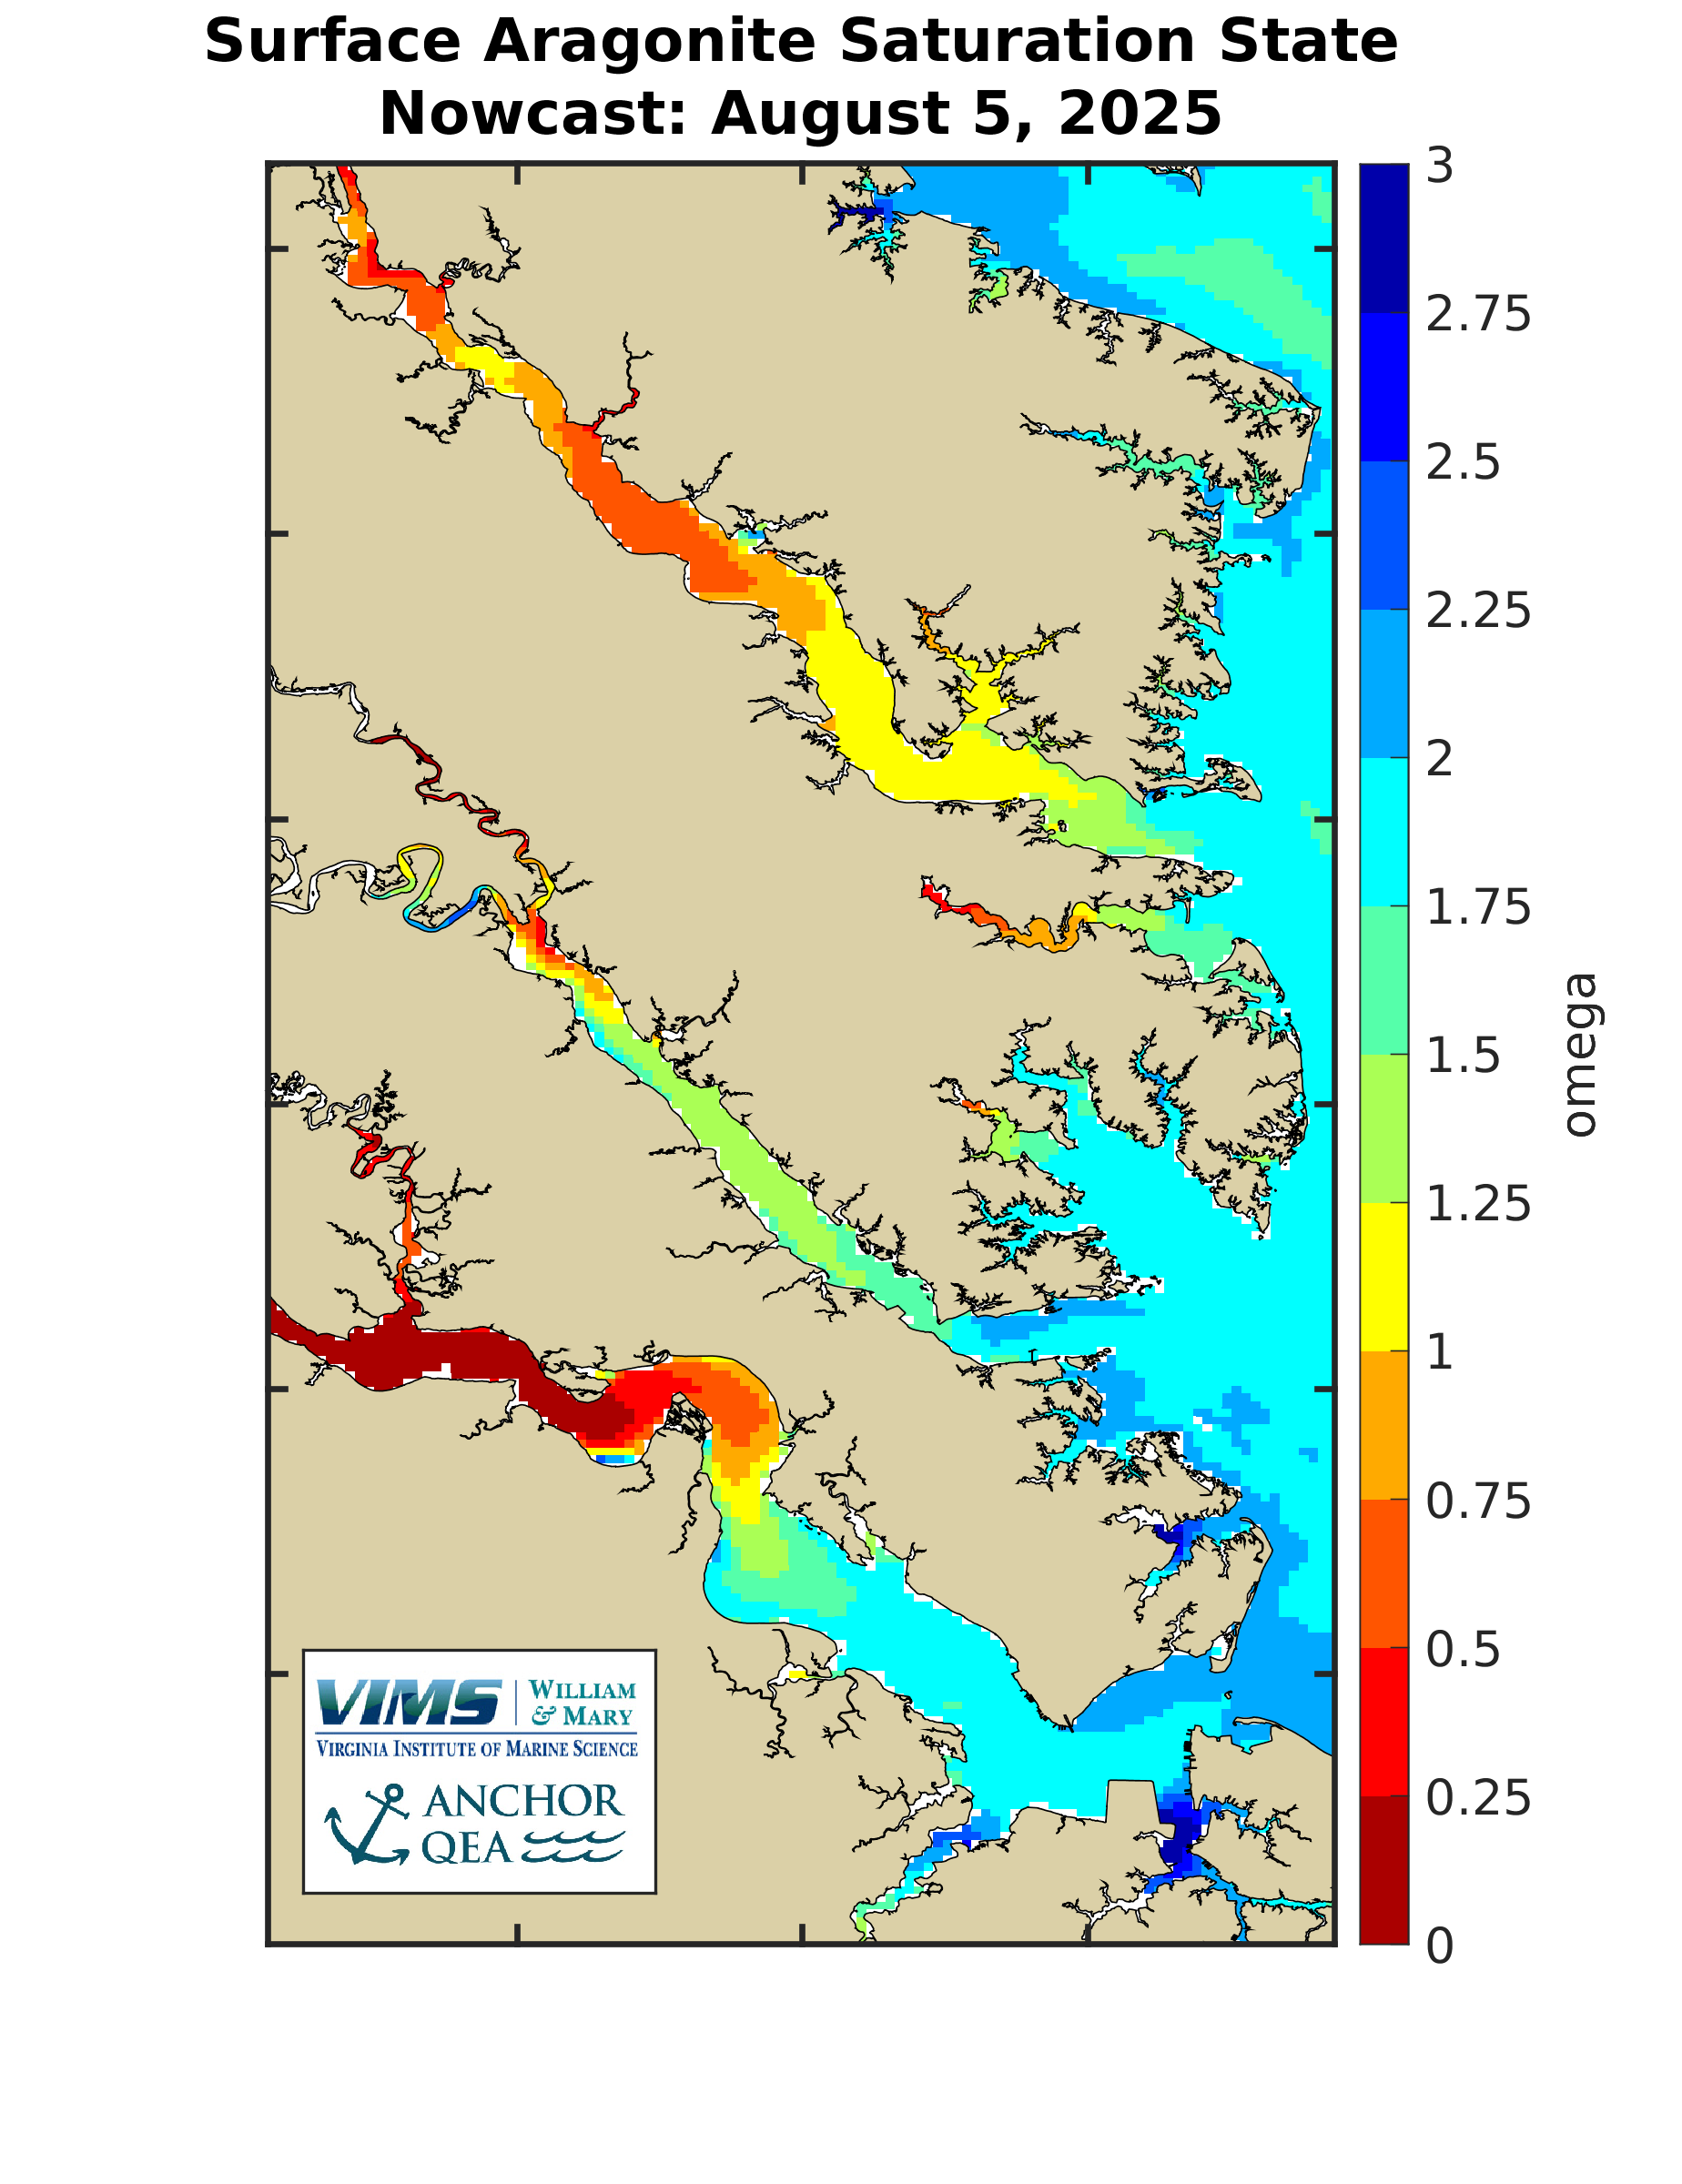
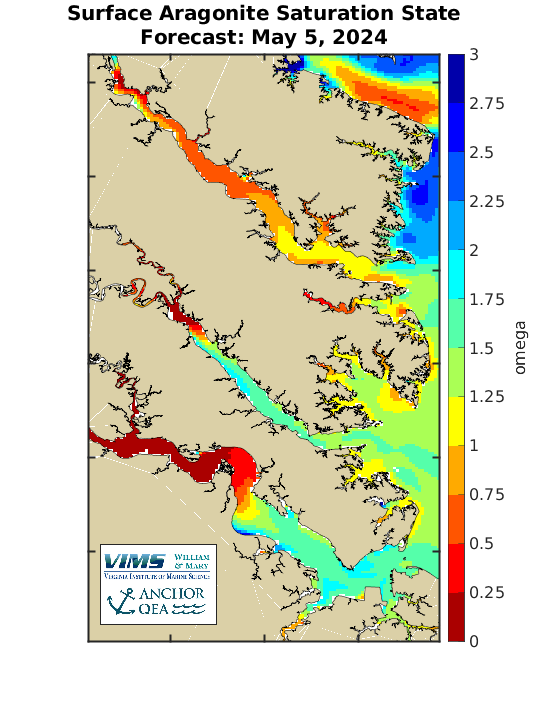
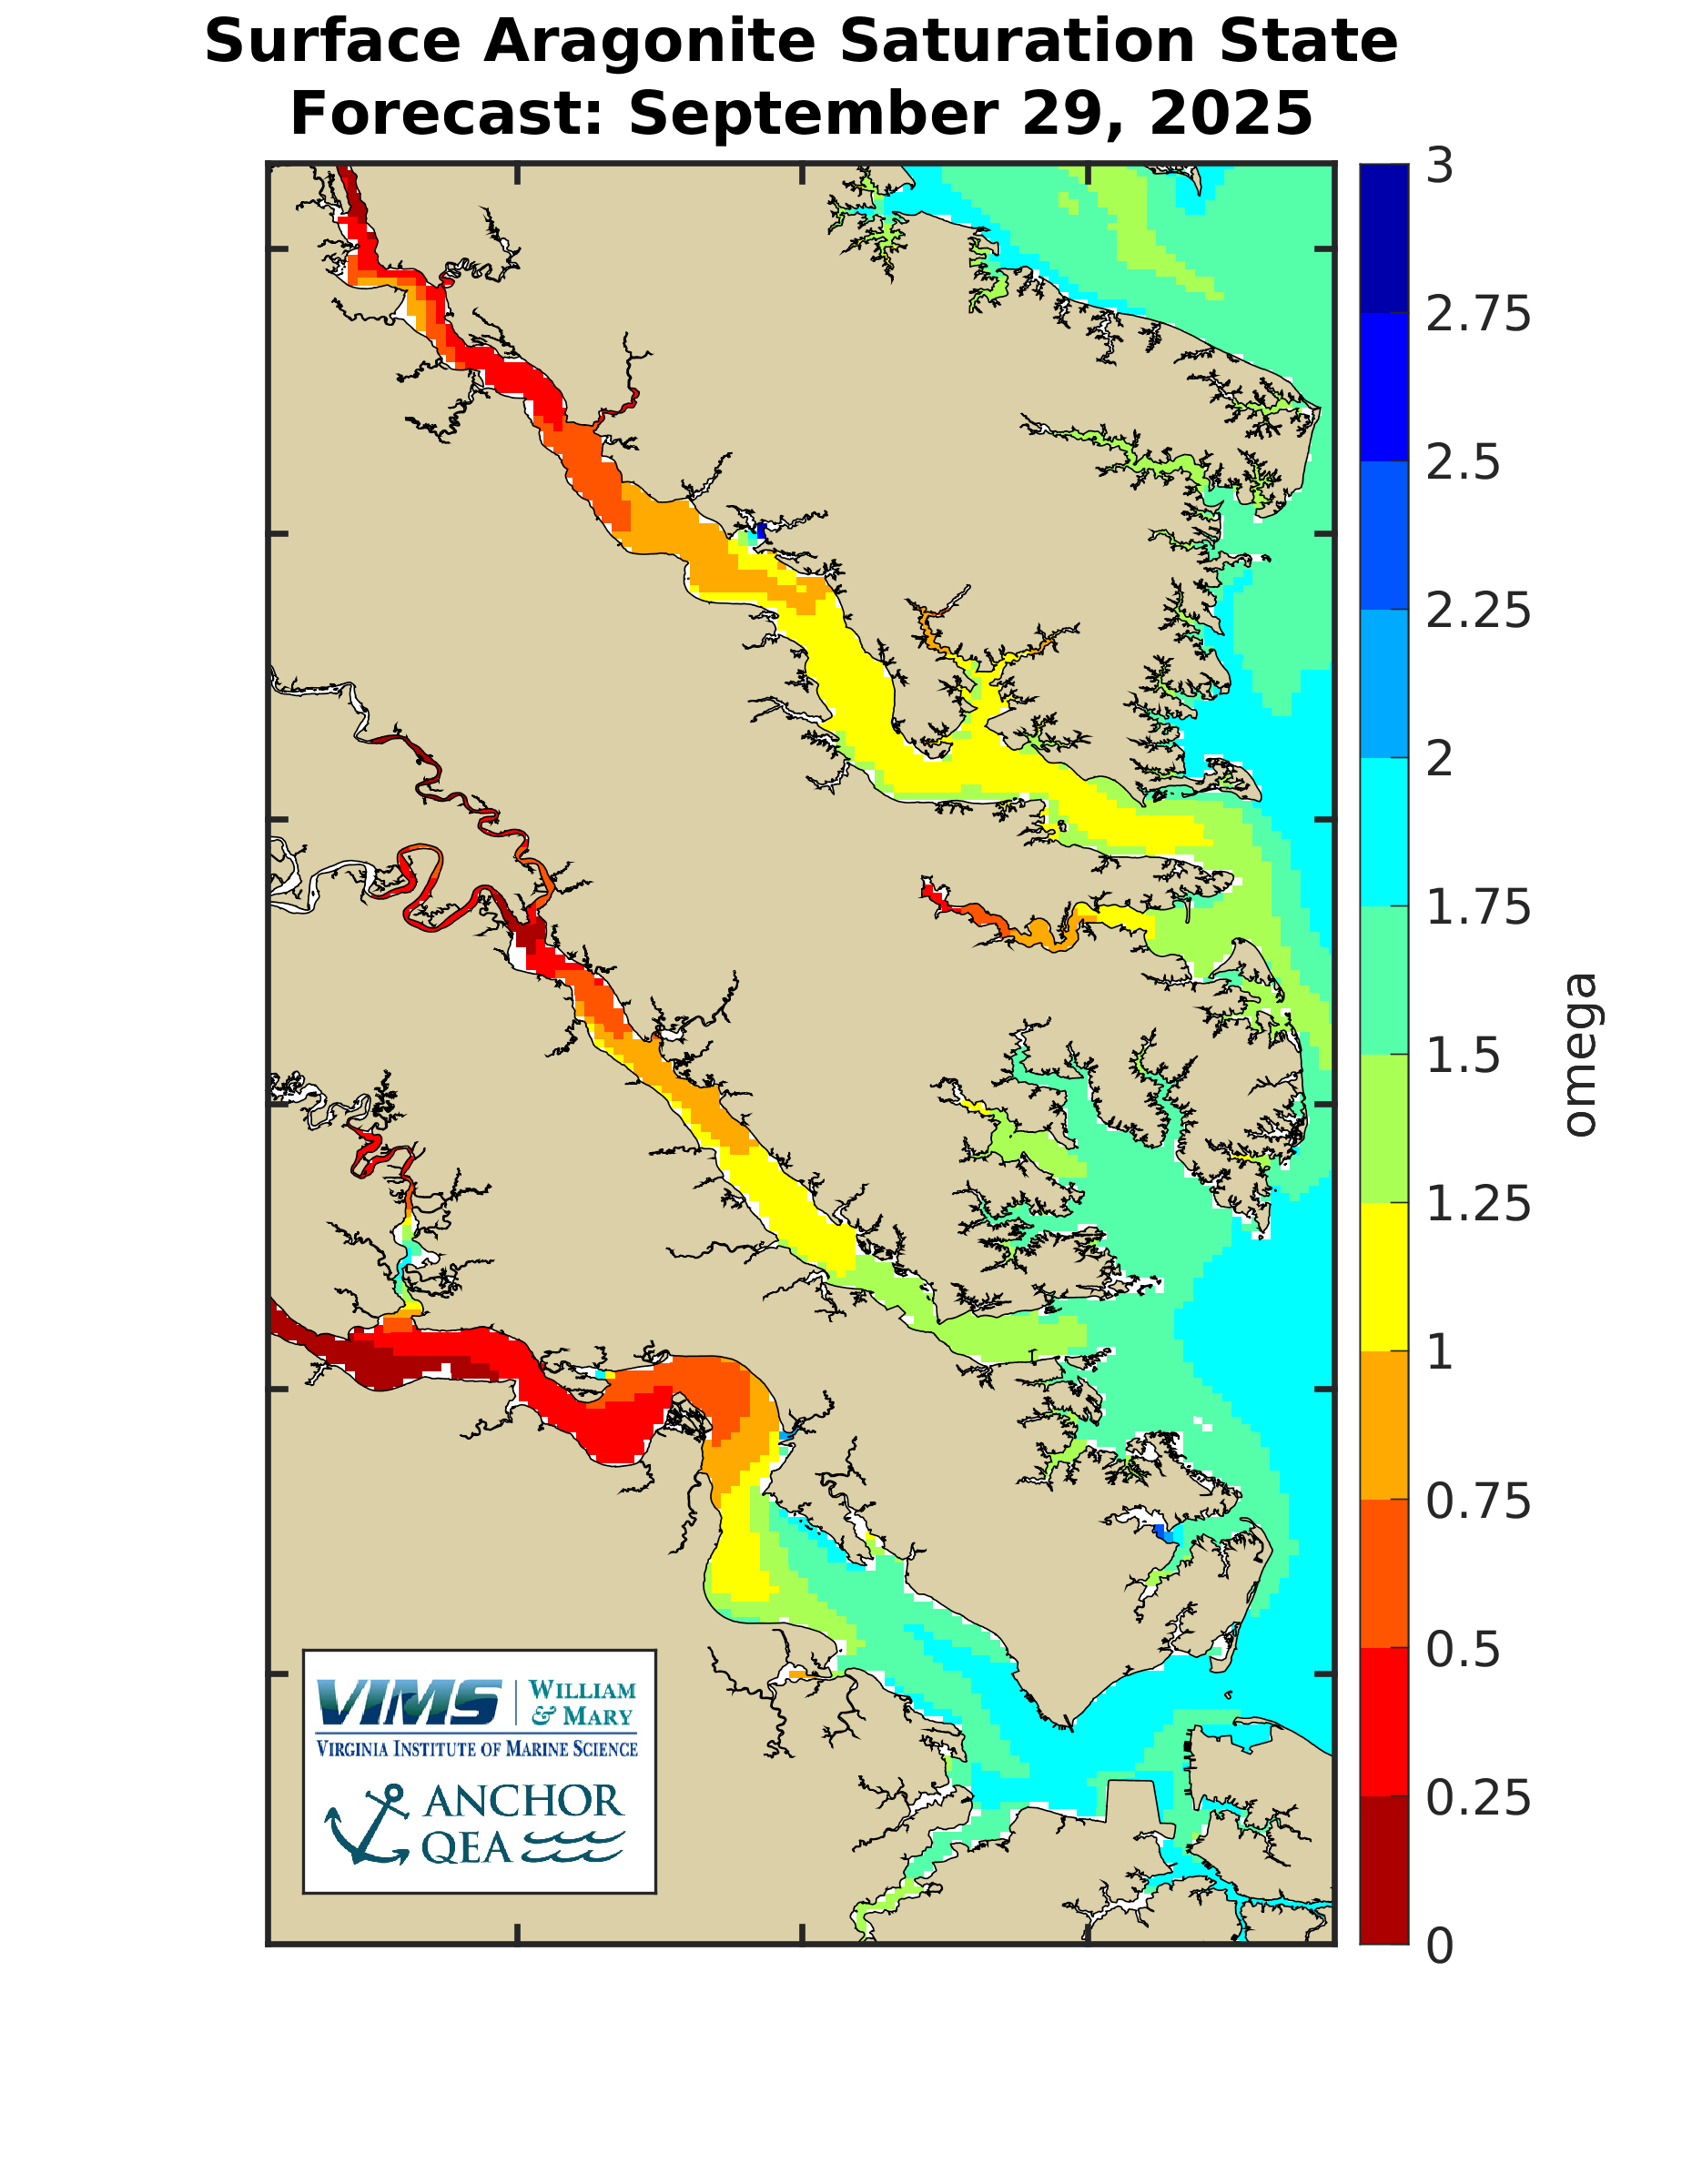
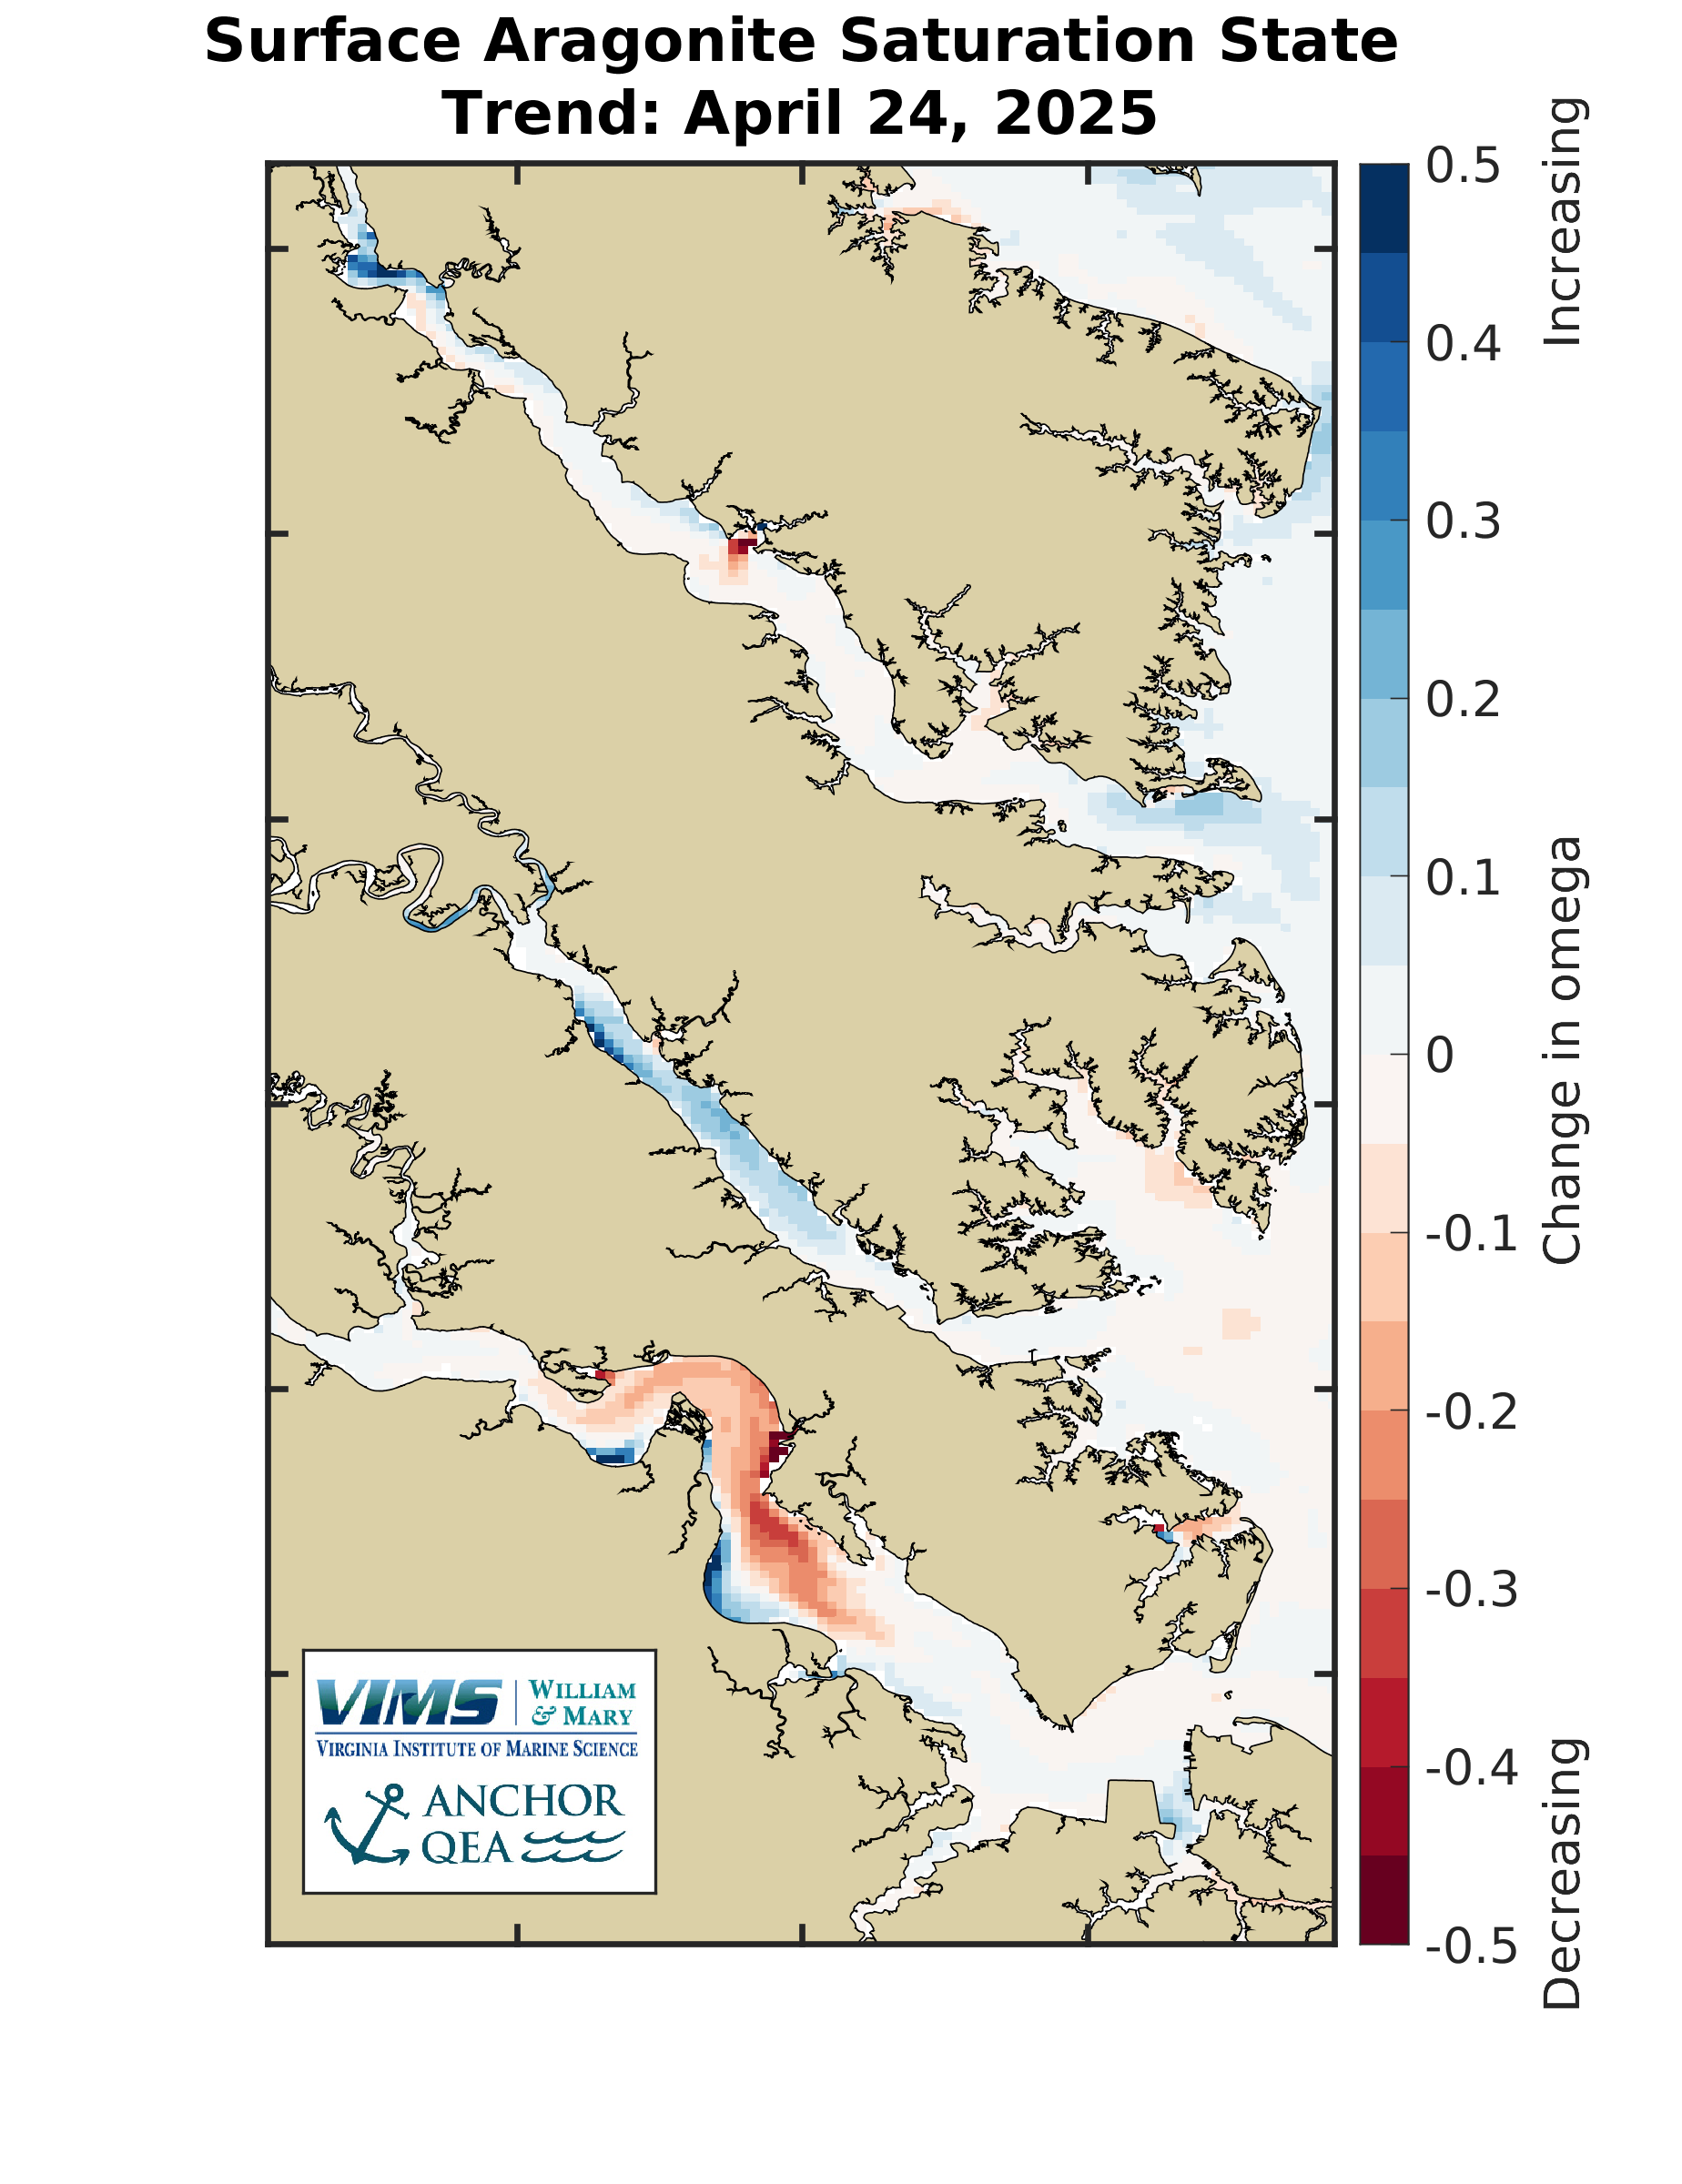
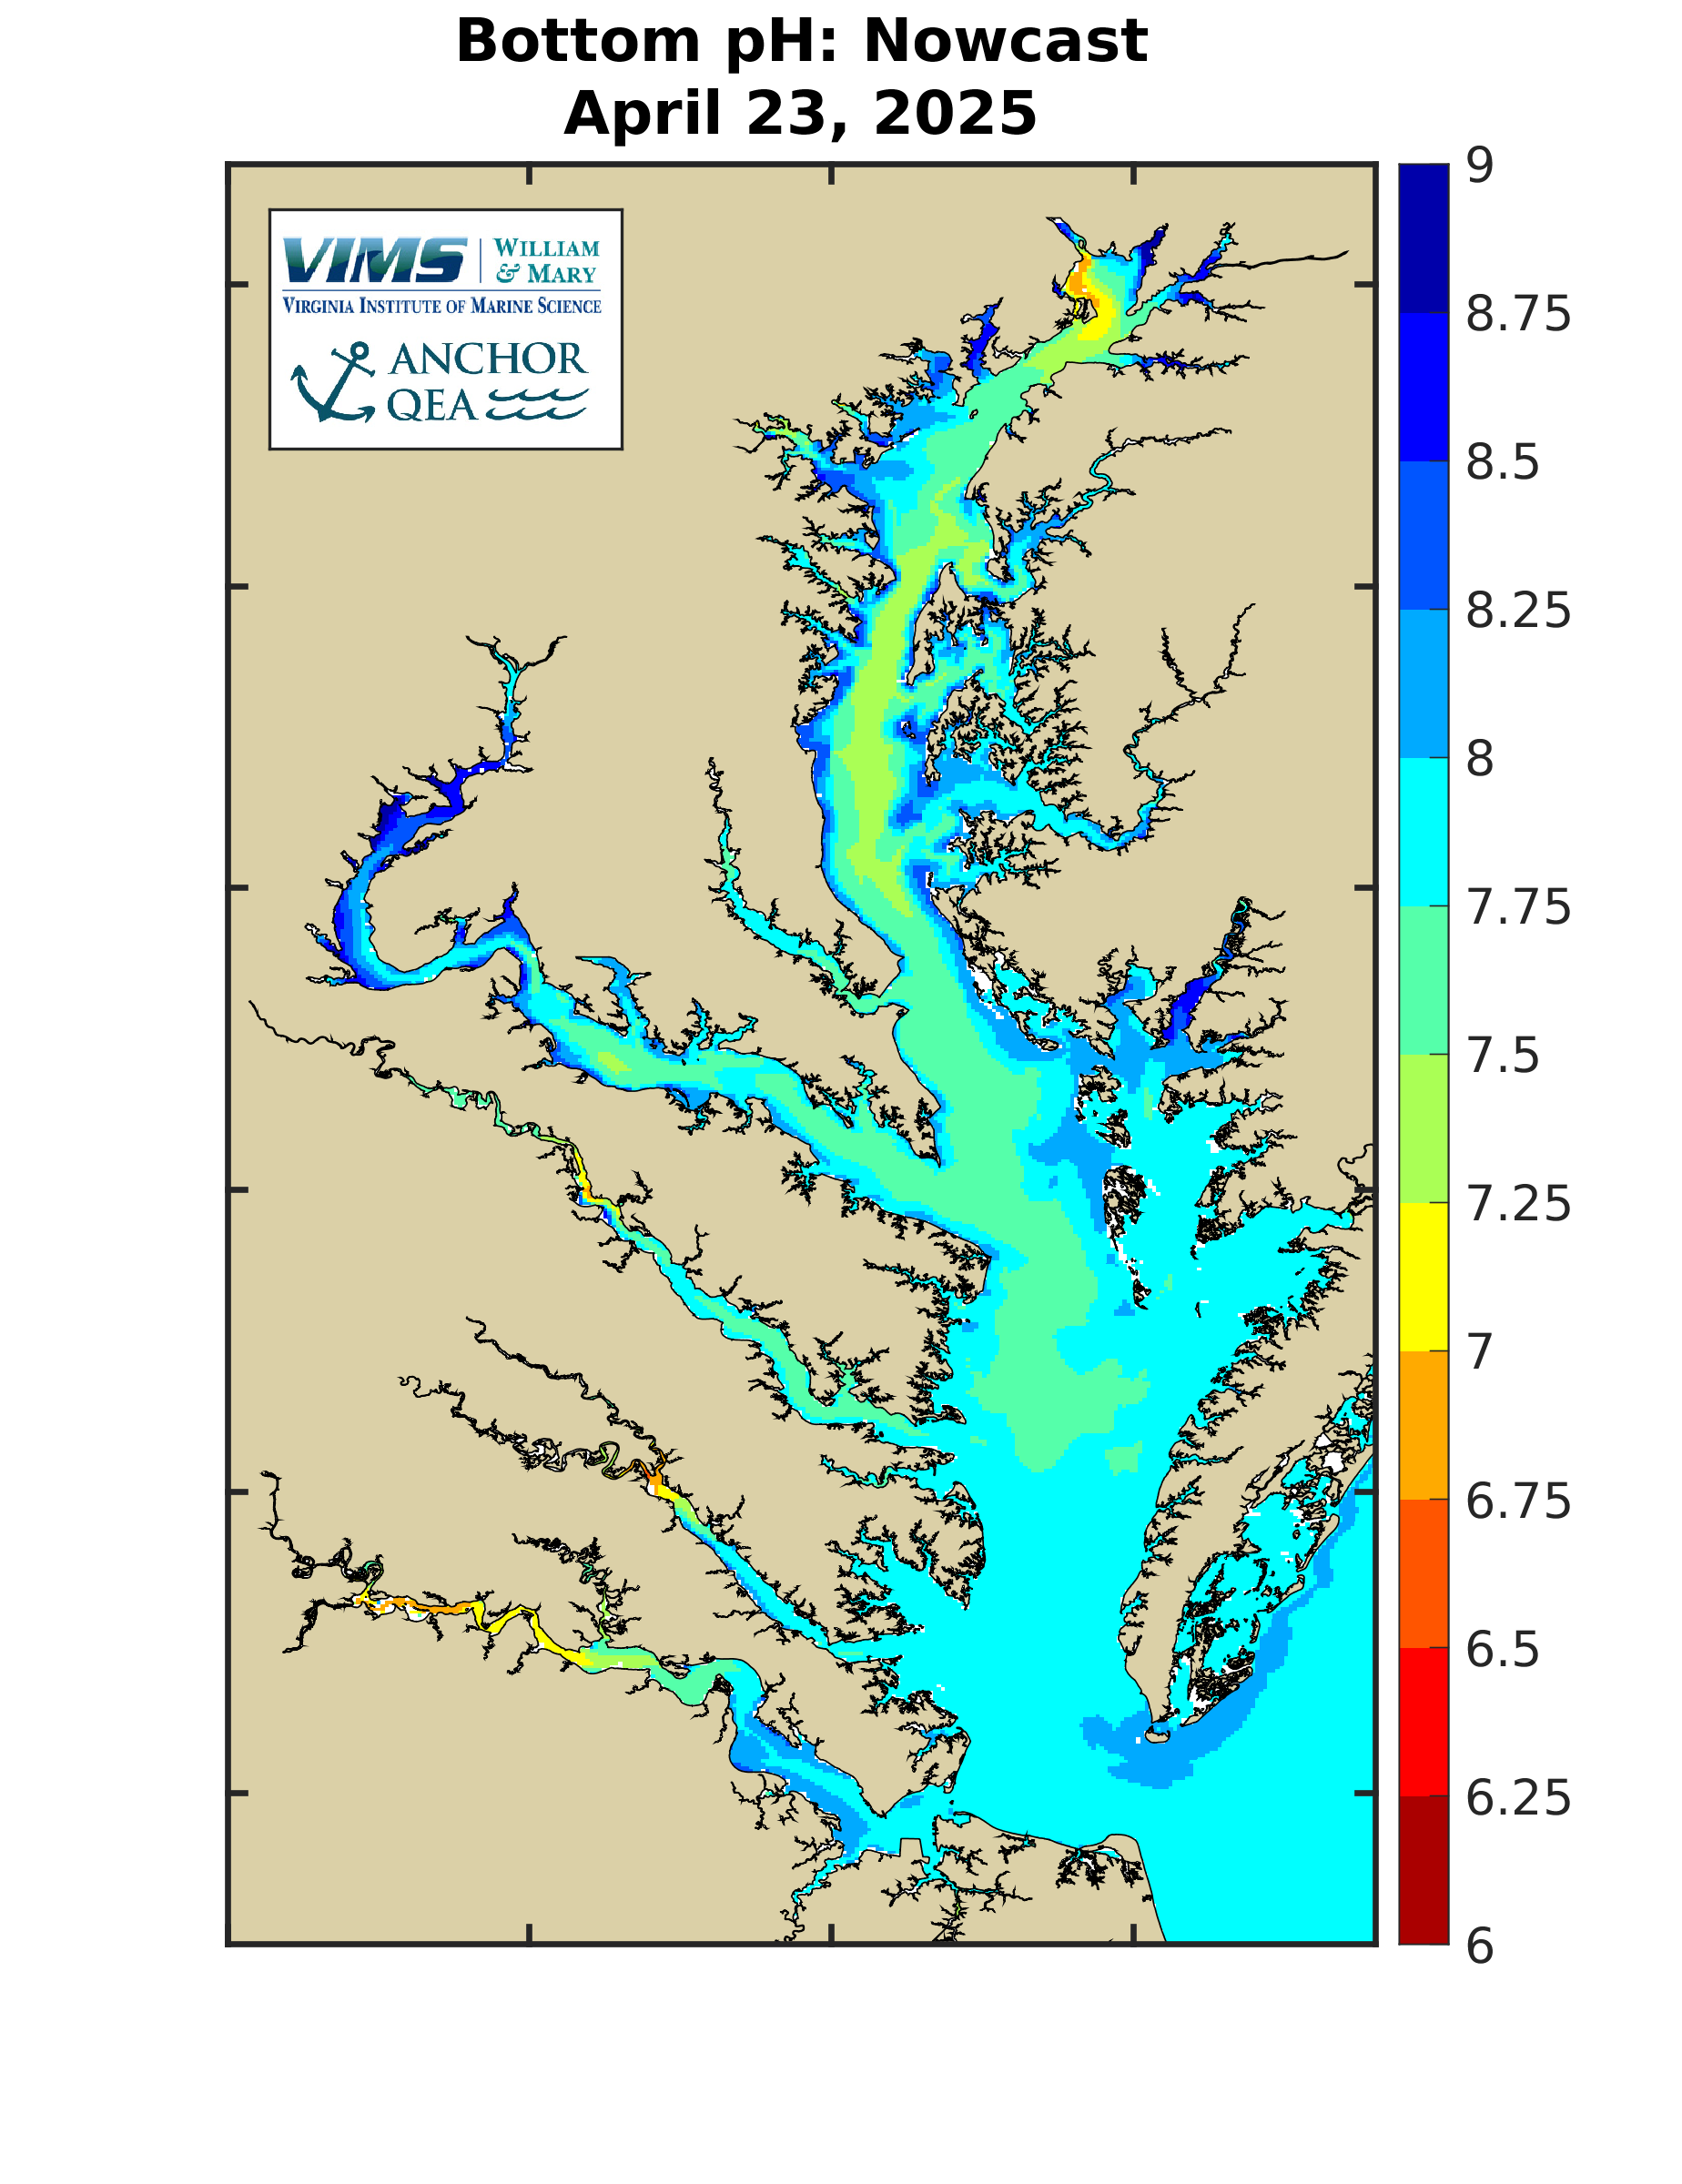
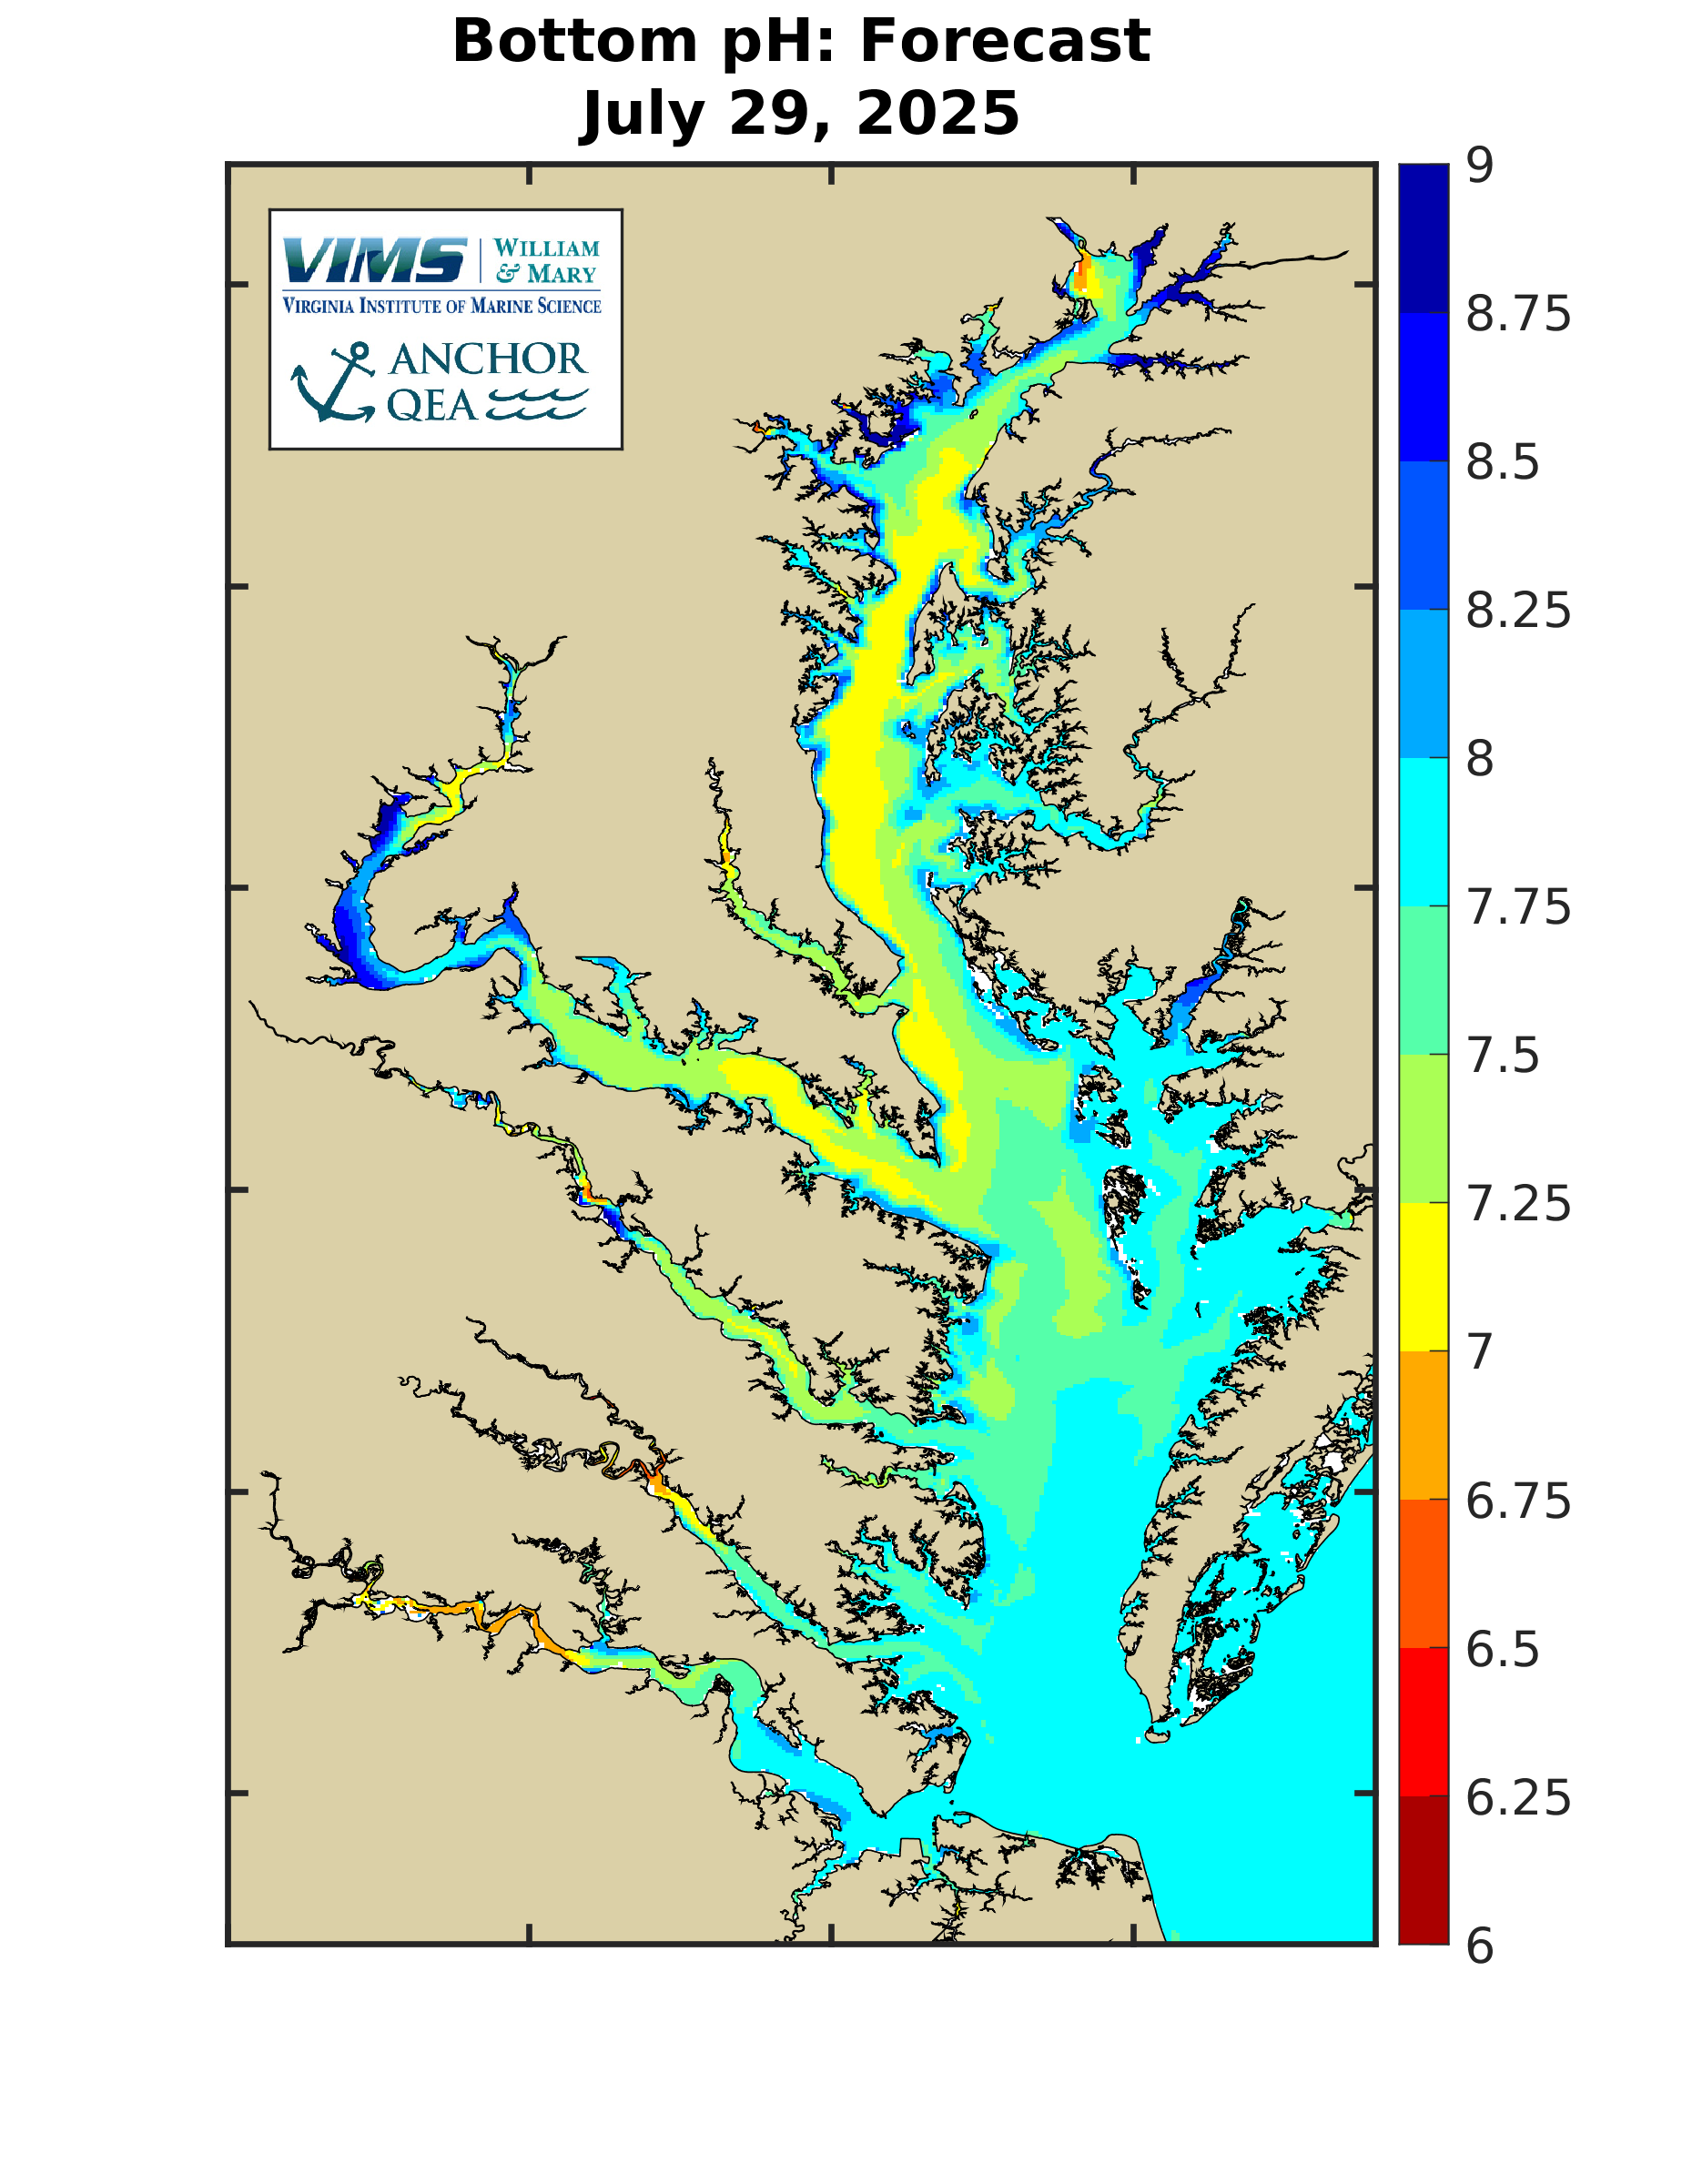
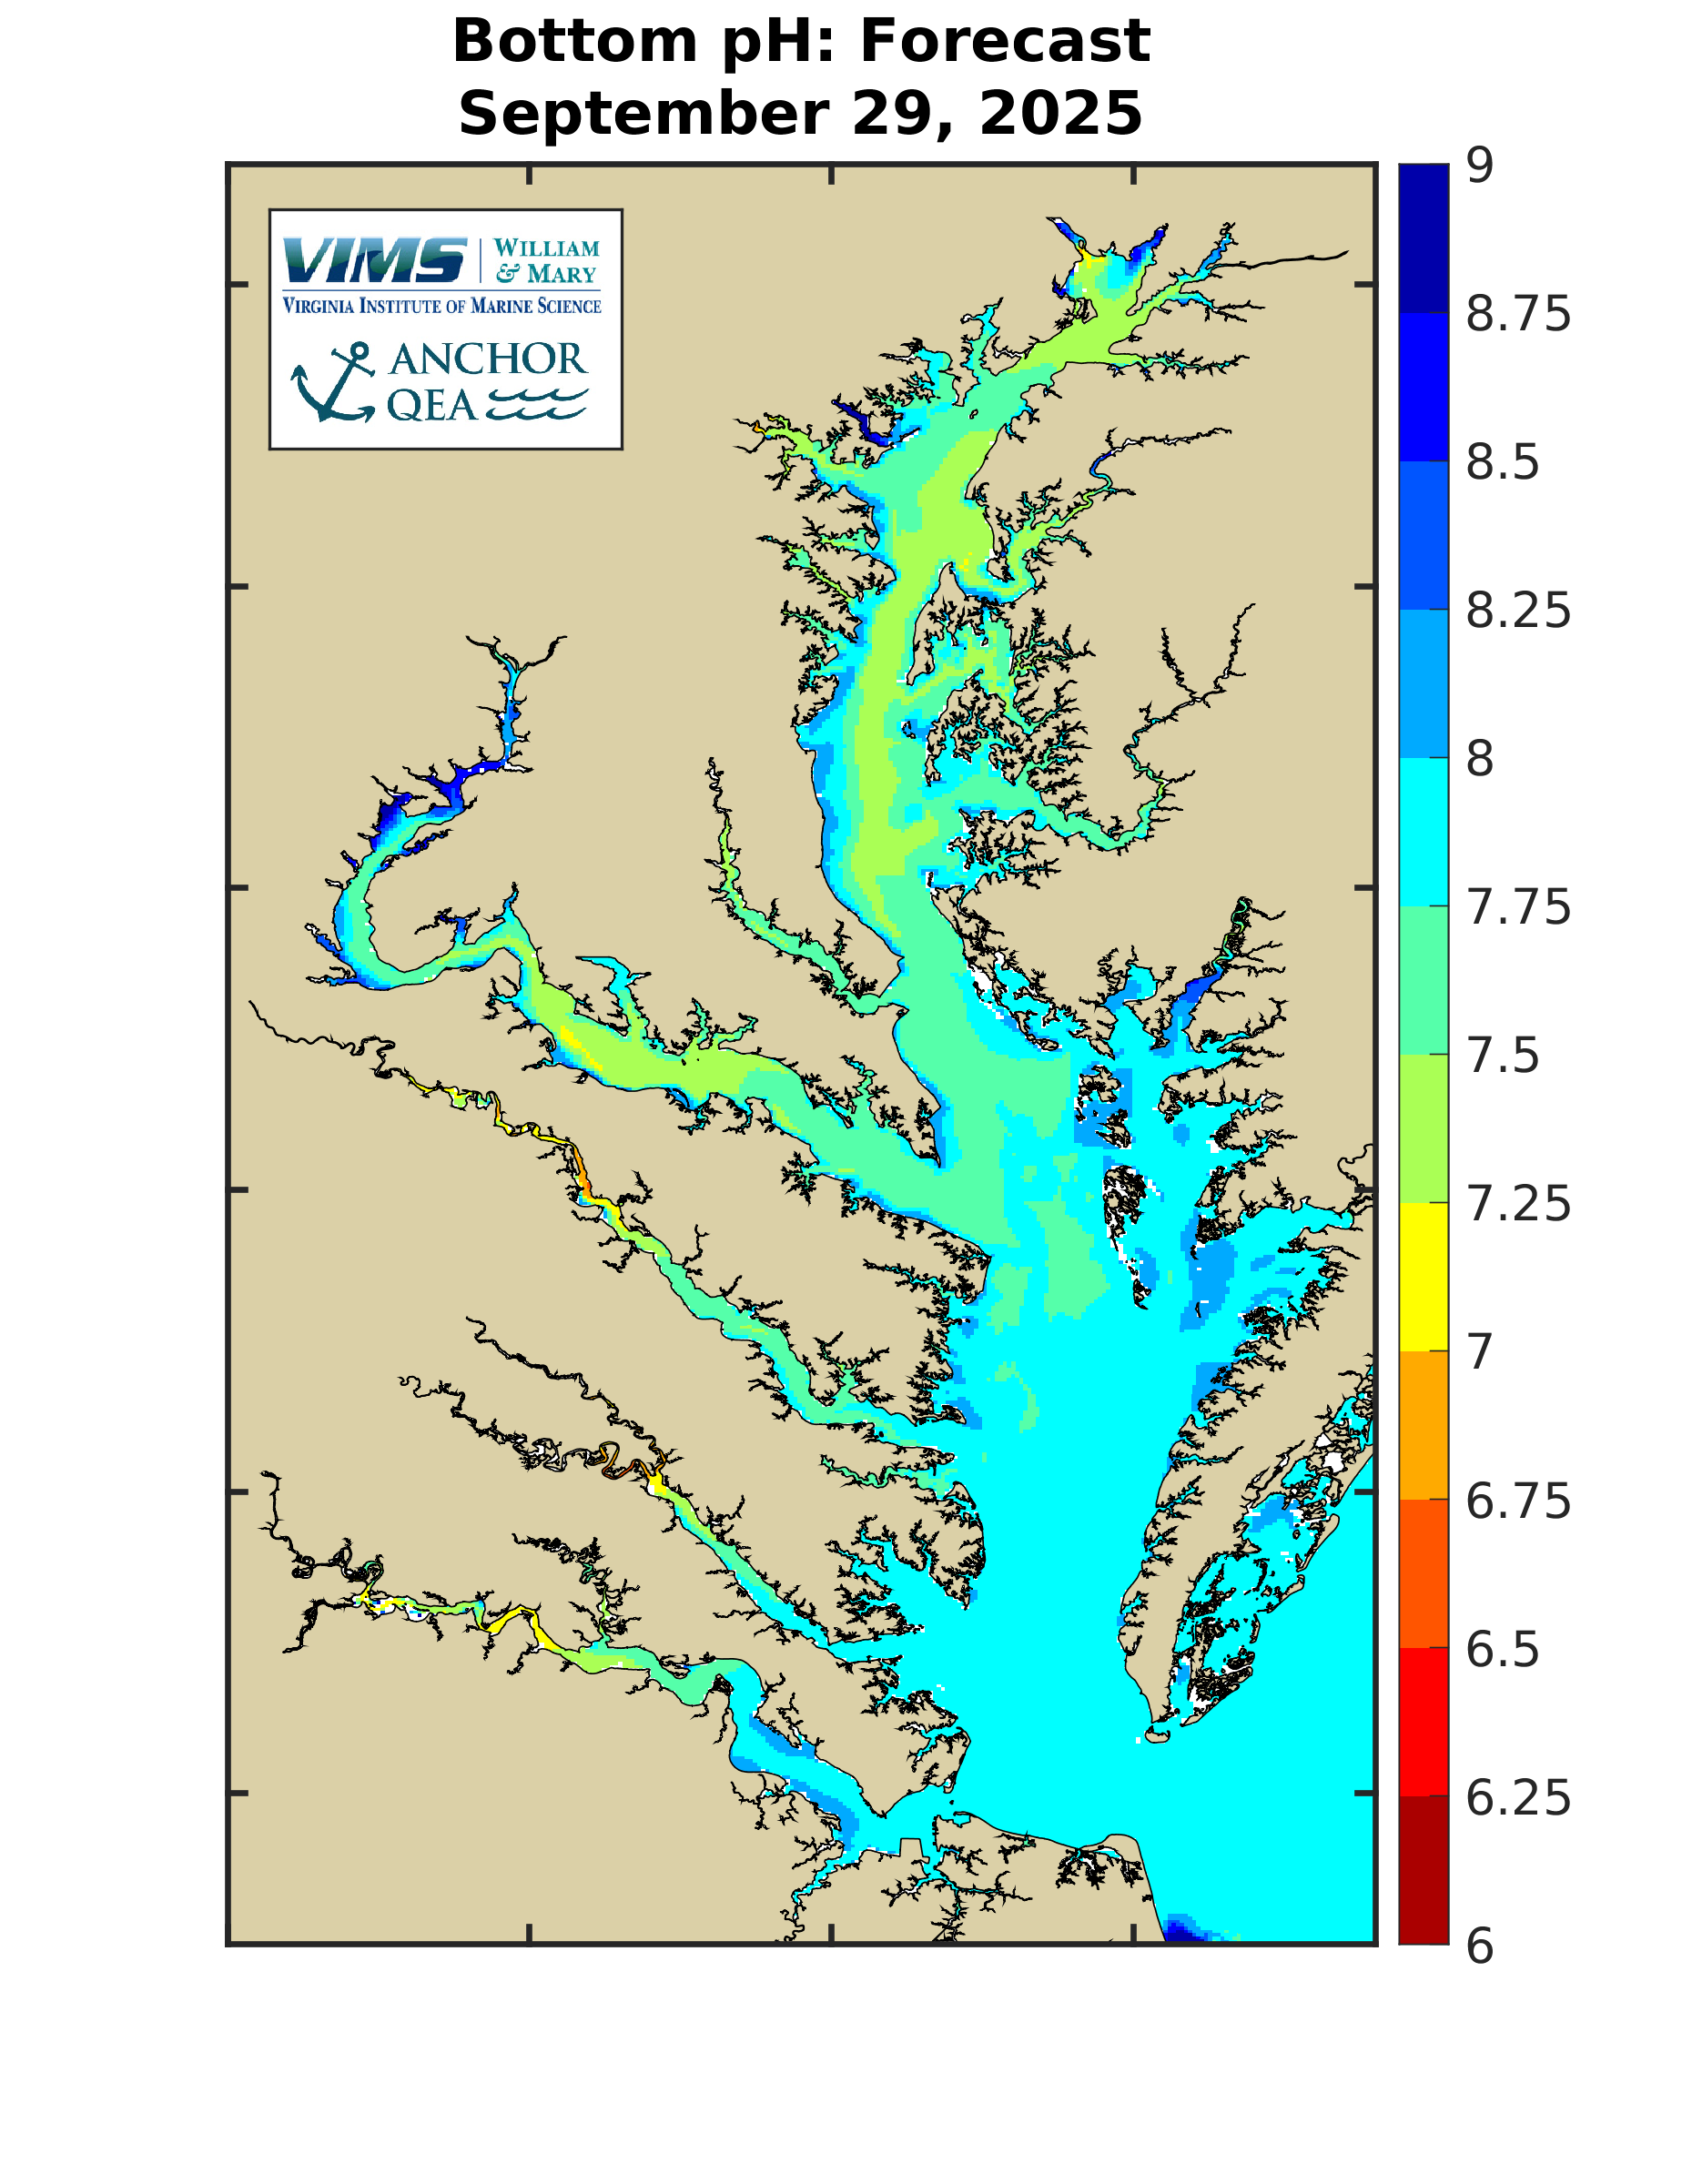
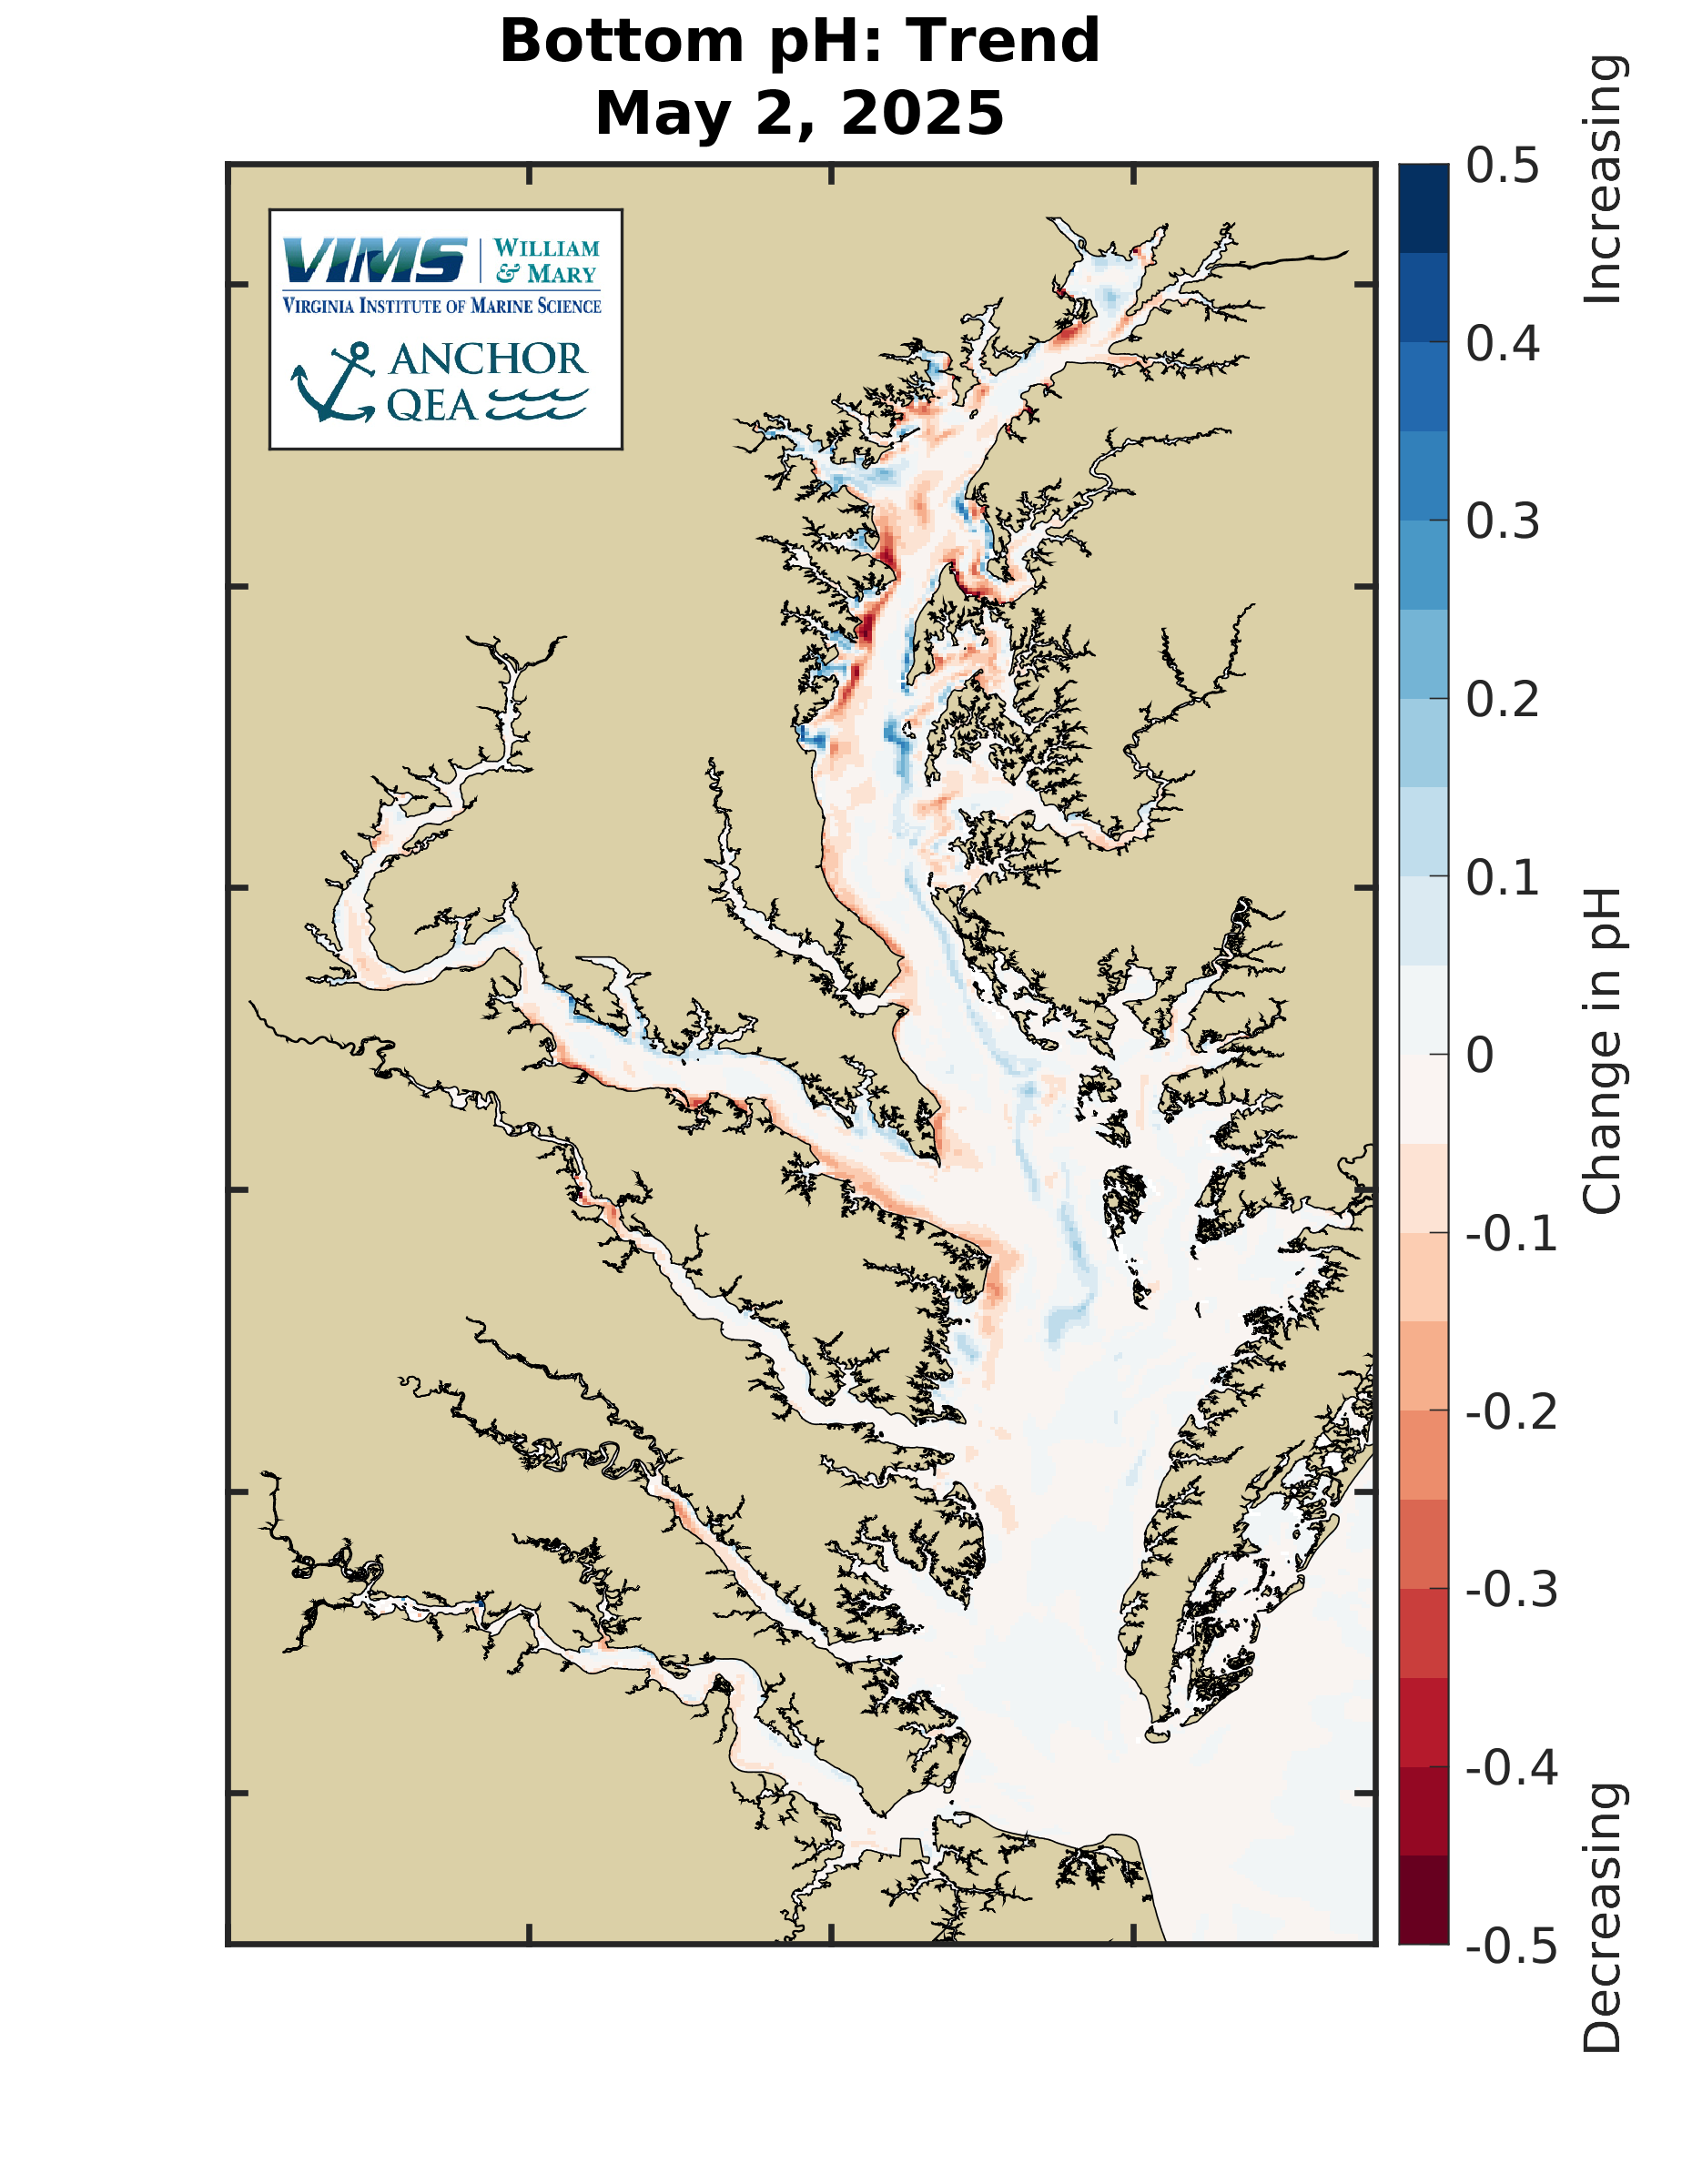
Click on the headings below to see Nowcast, Forecast, Trend, and difference from the long-term average line plots and maps. One set of maps shows the entire Chesapeake Bay and a second set focuses on the James, York, and Rappahannock Rivers.
Another dropdown tab highlights effects of climate change and related stressors, including acidification, on oysters in Chesapeake Bay.
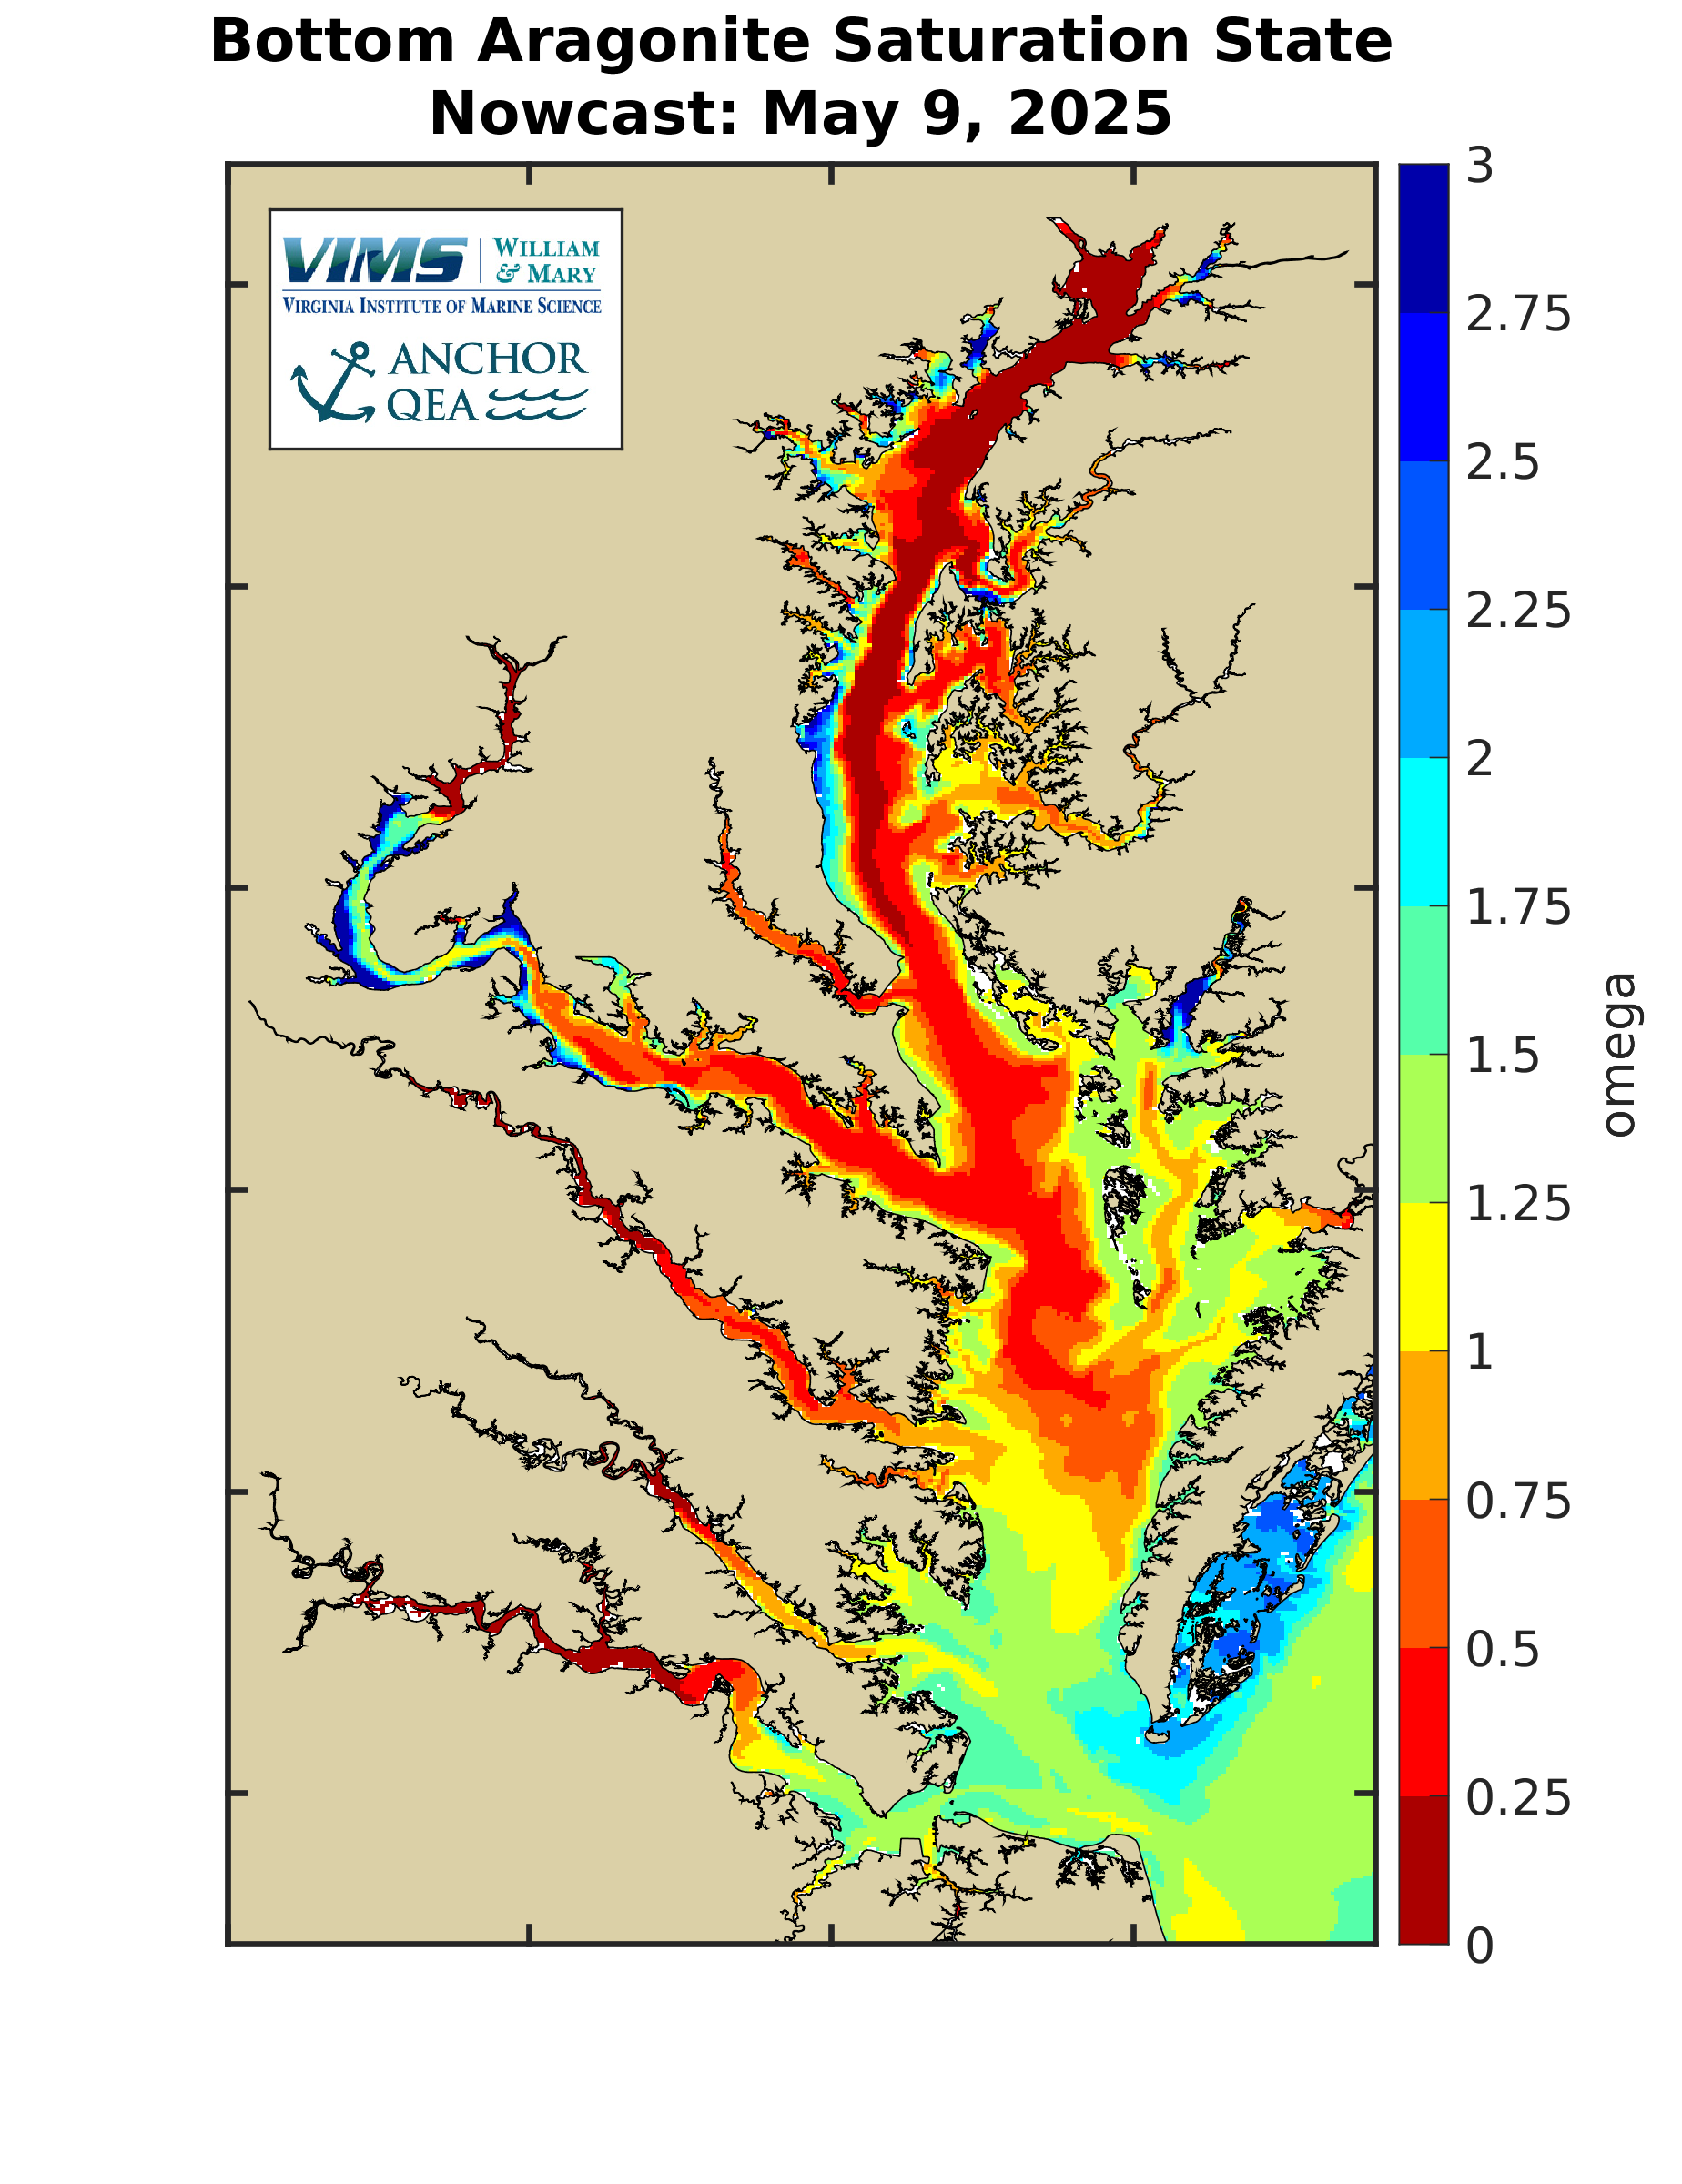
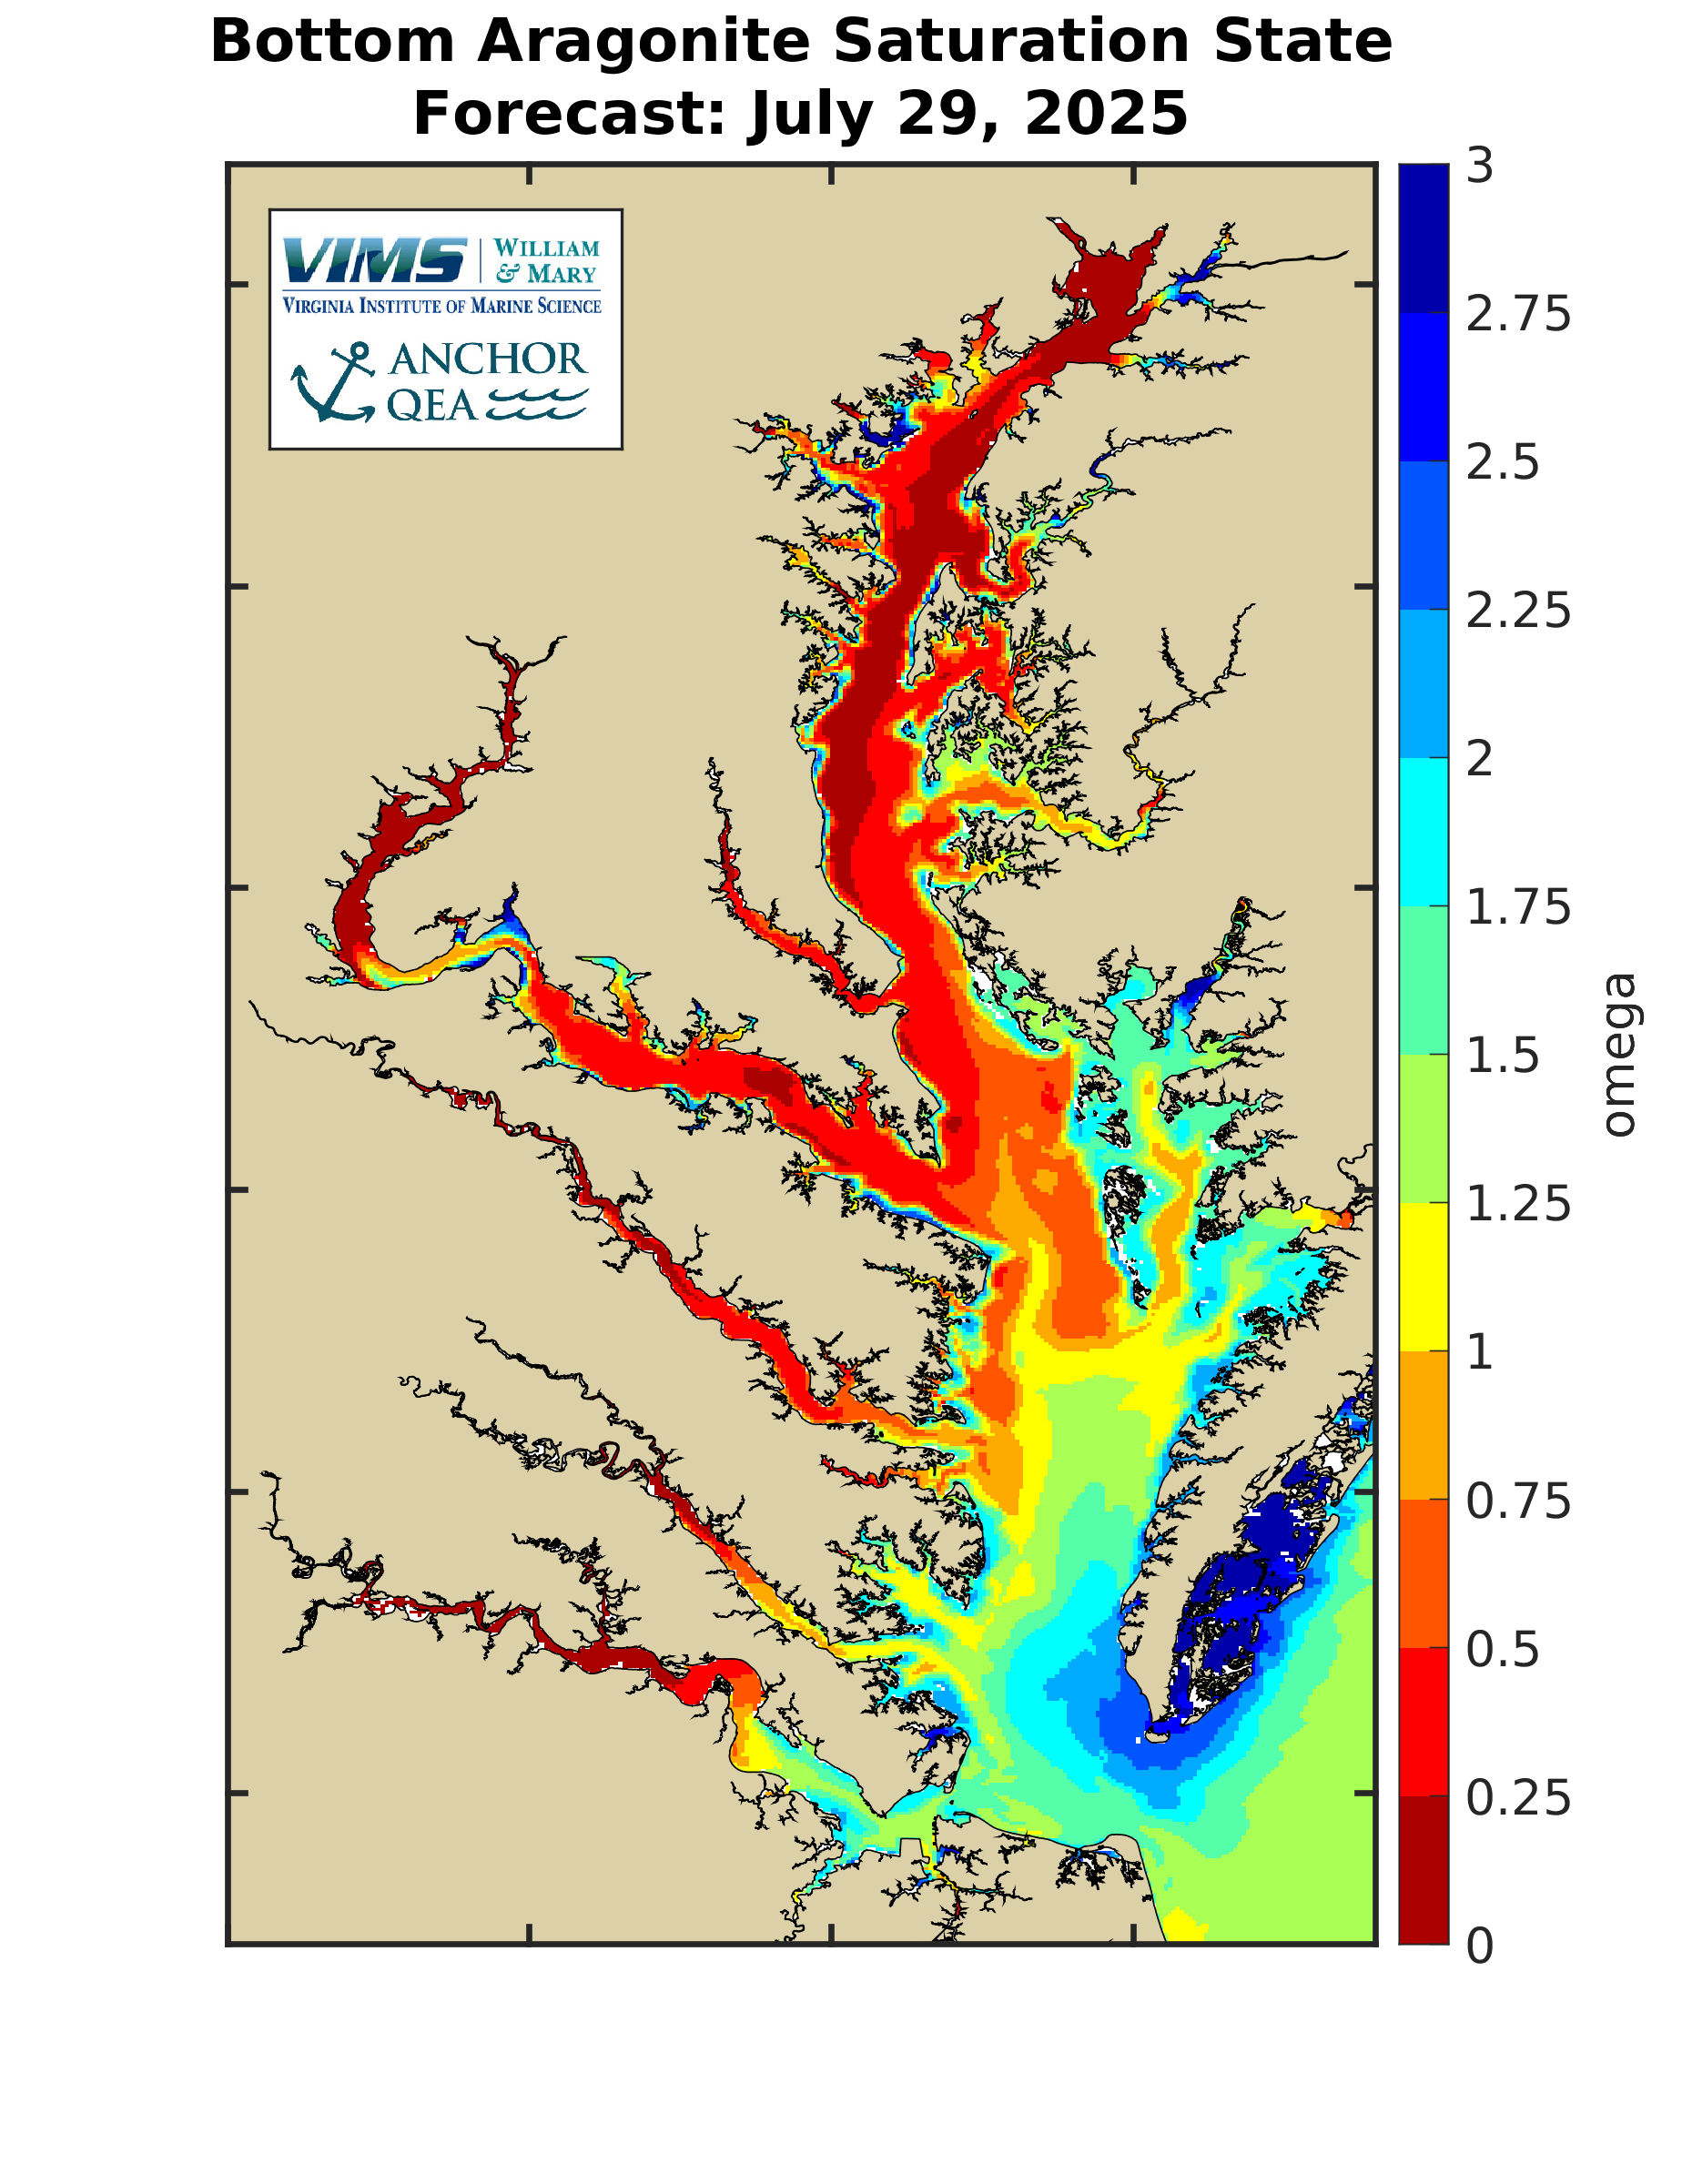
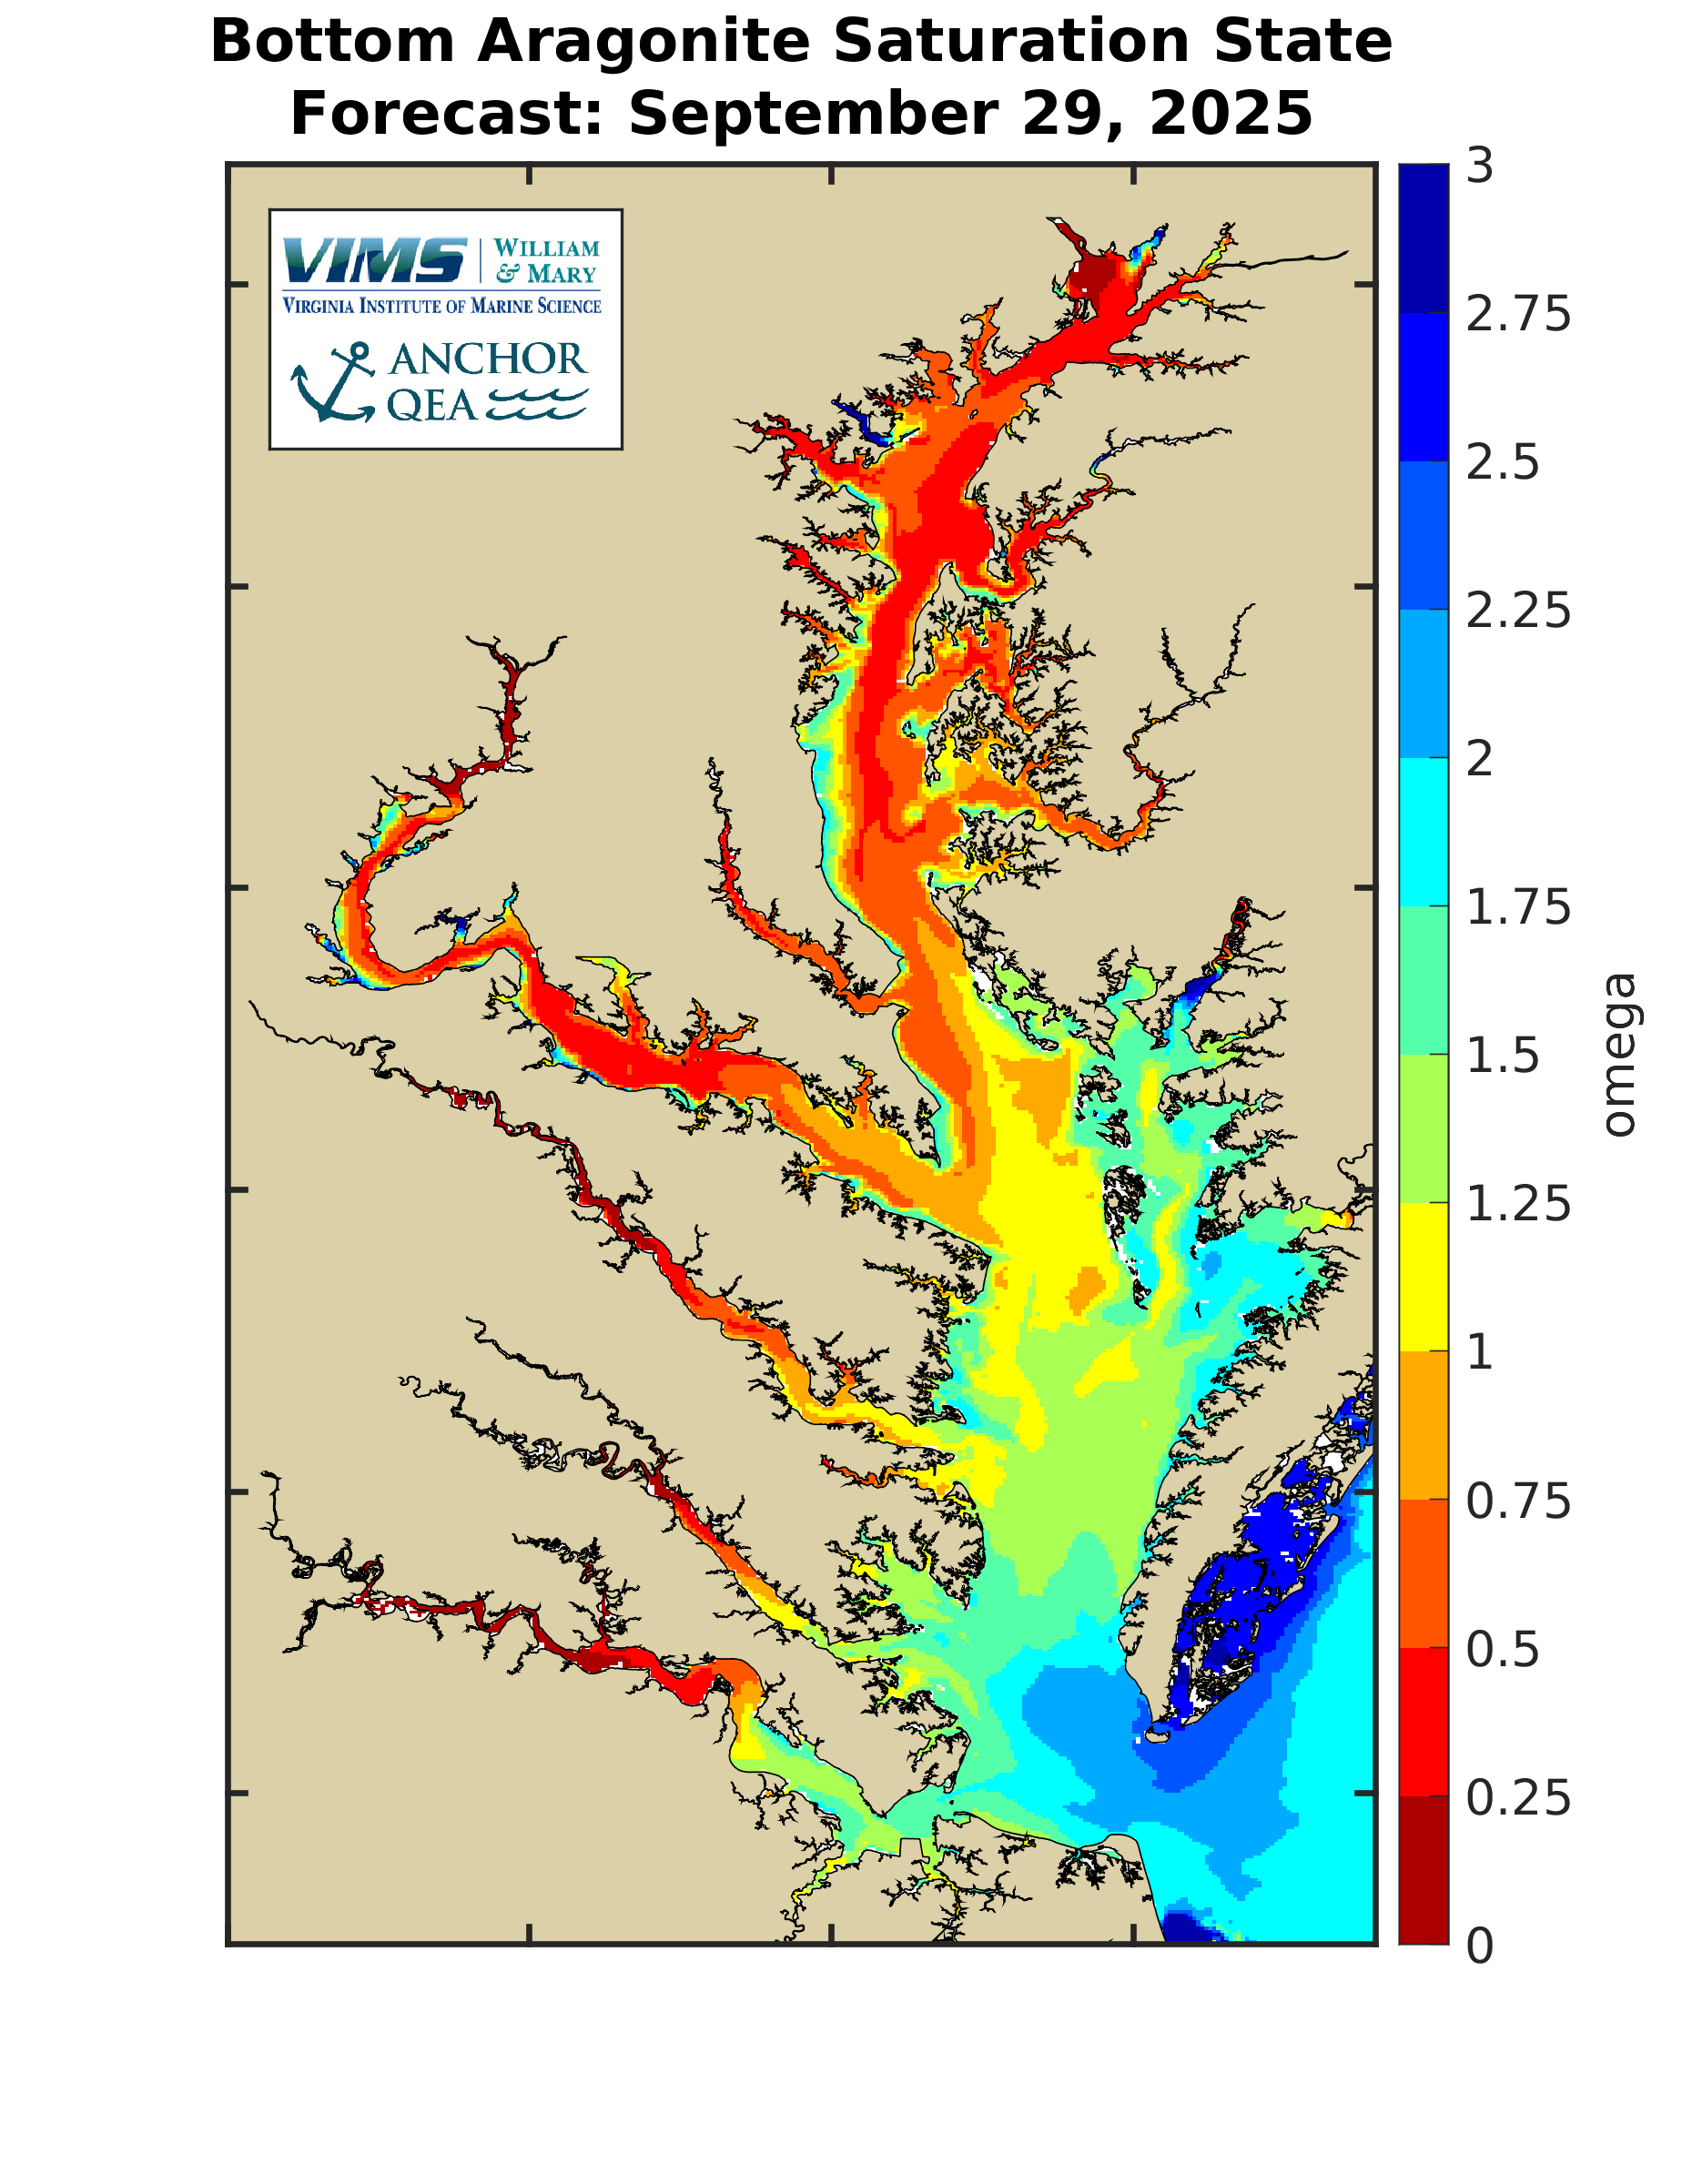
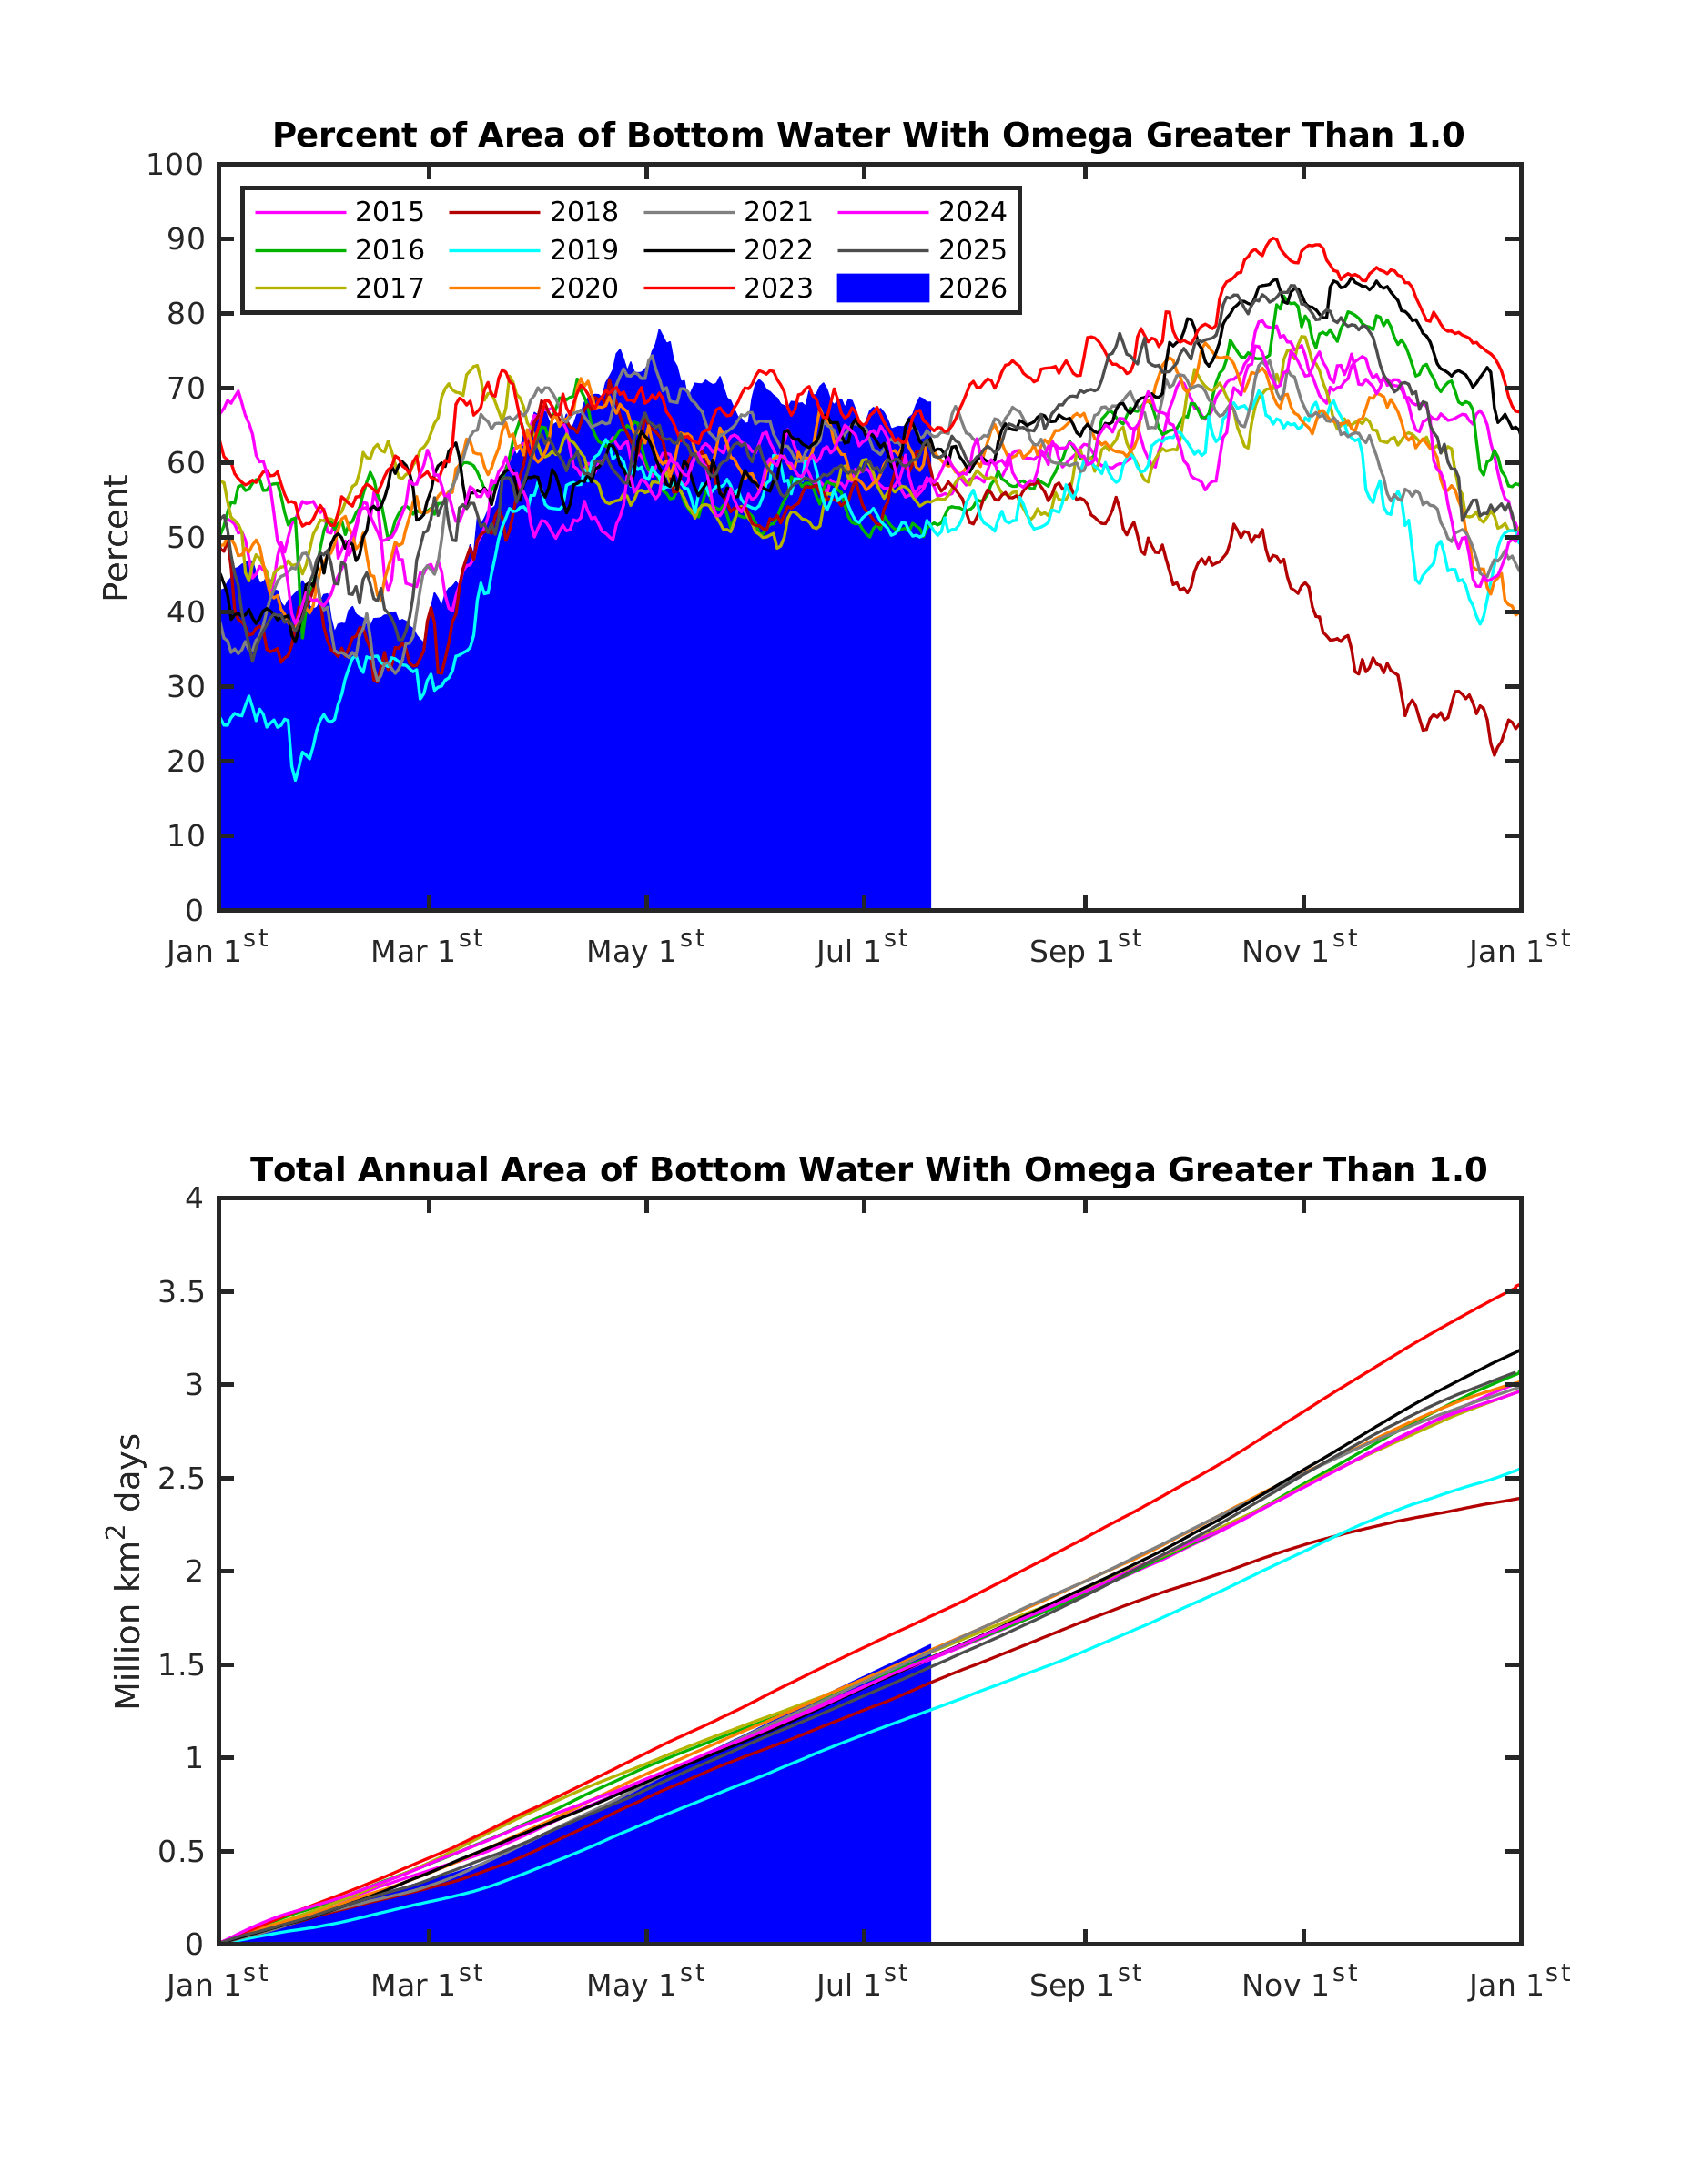
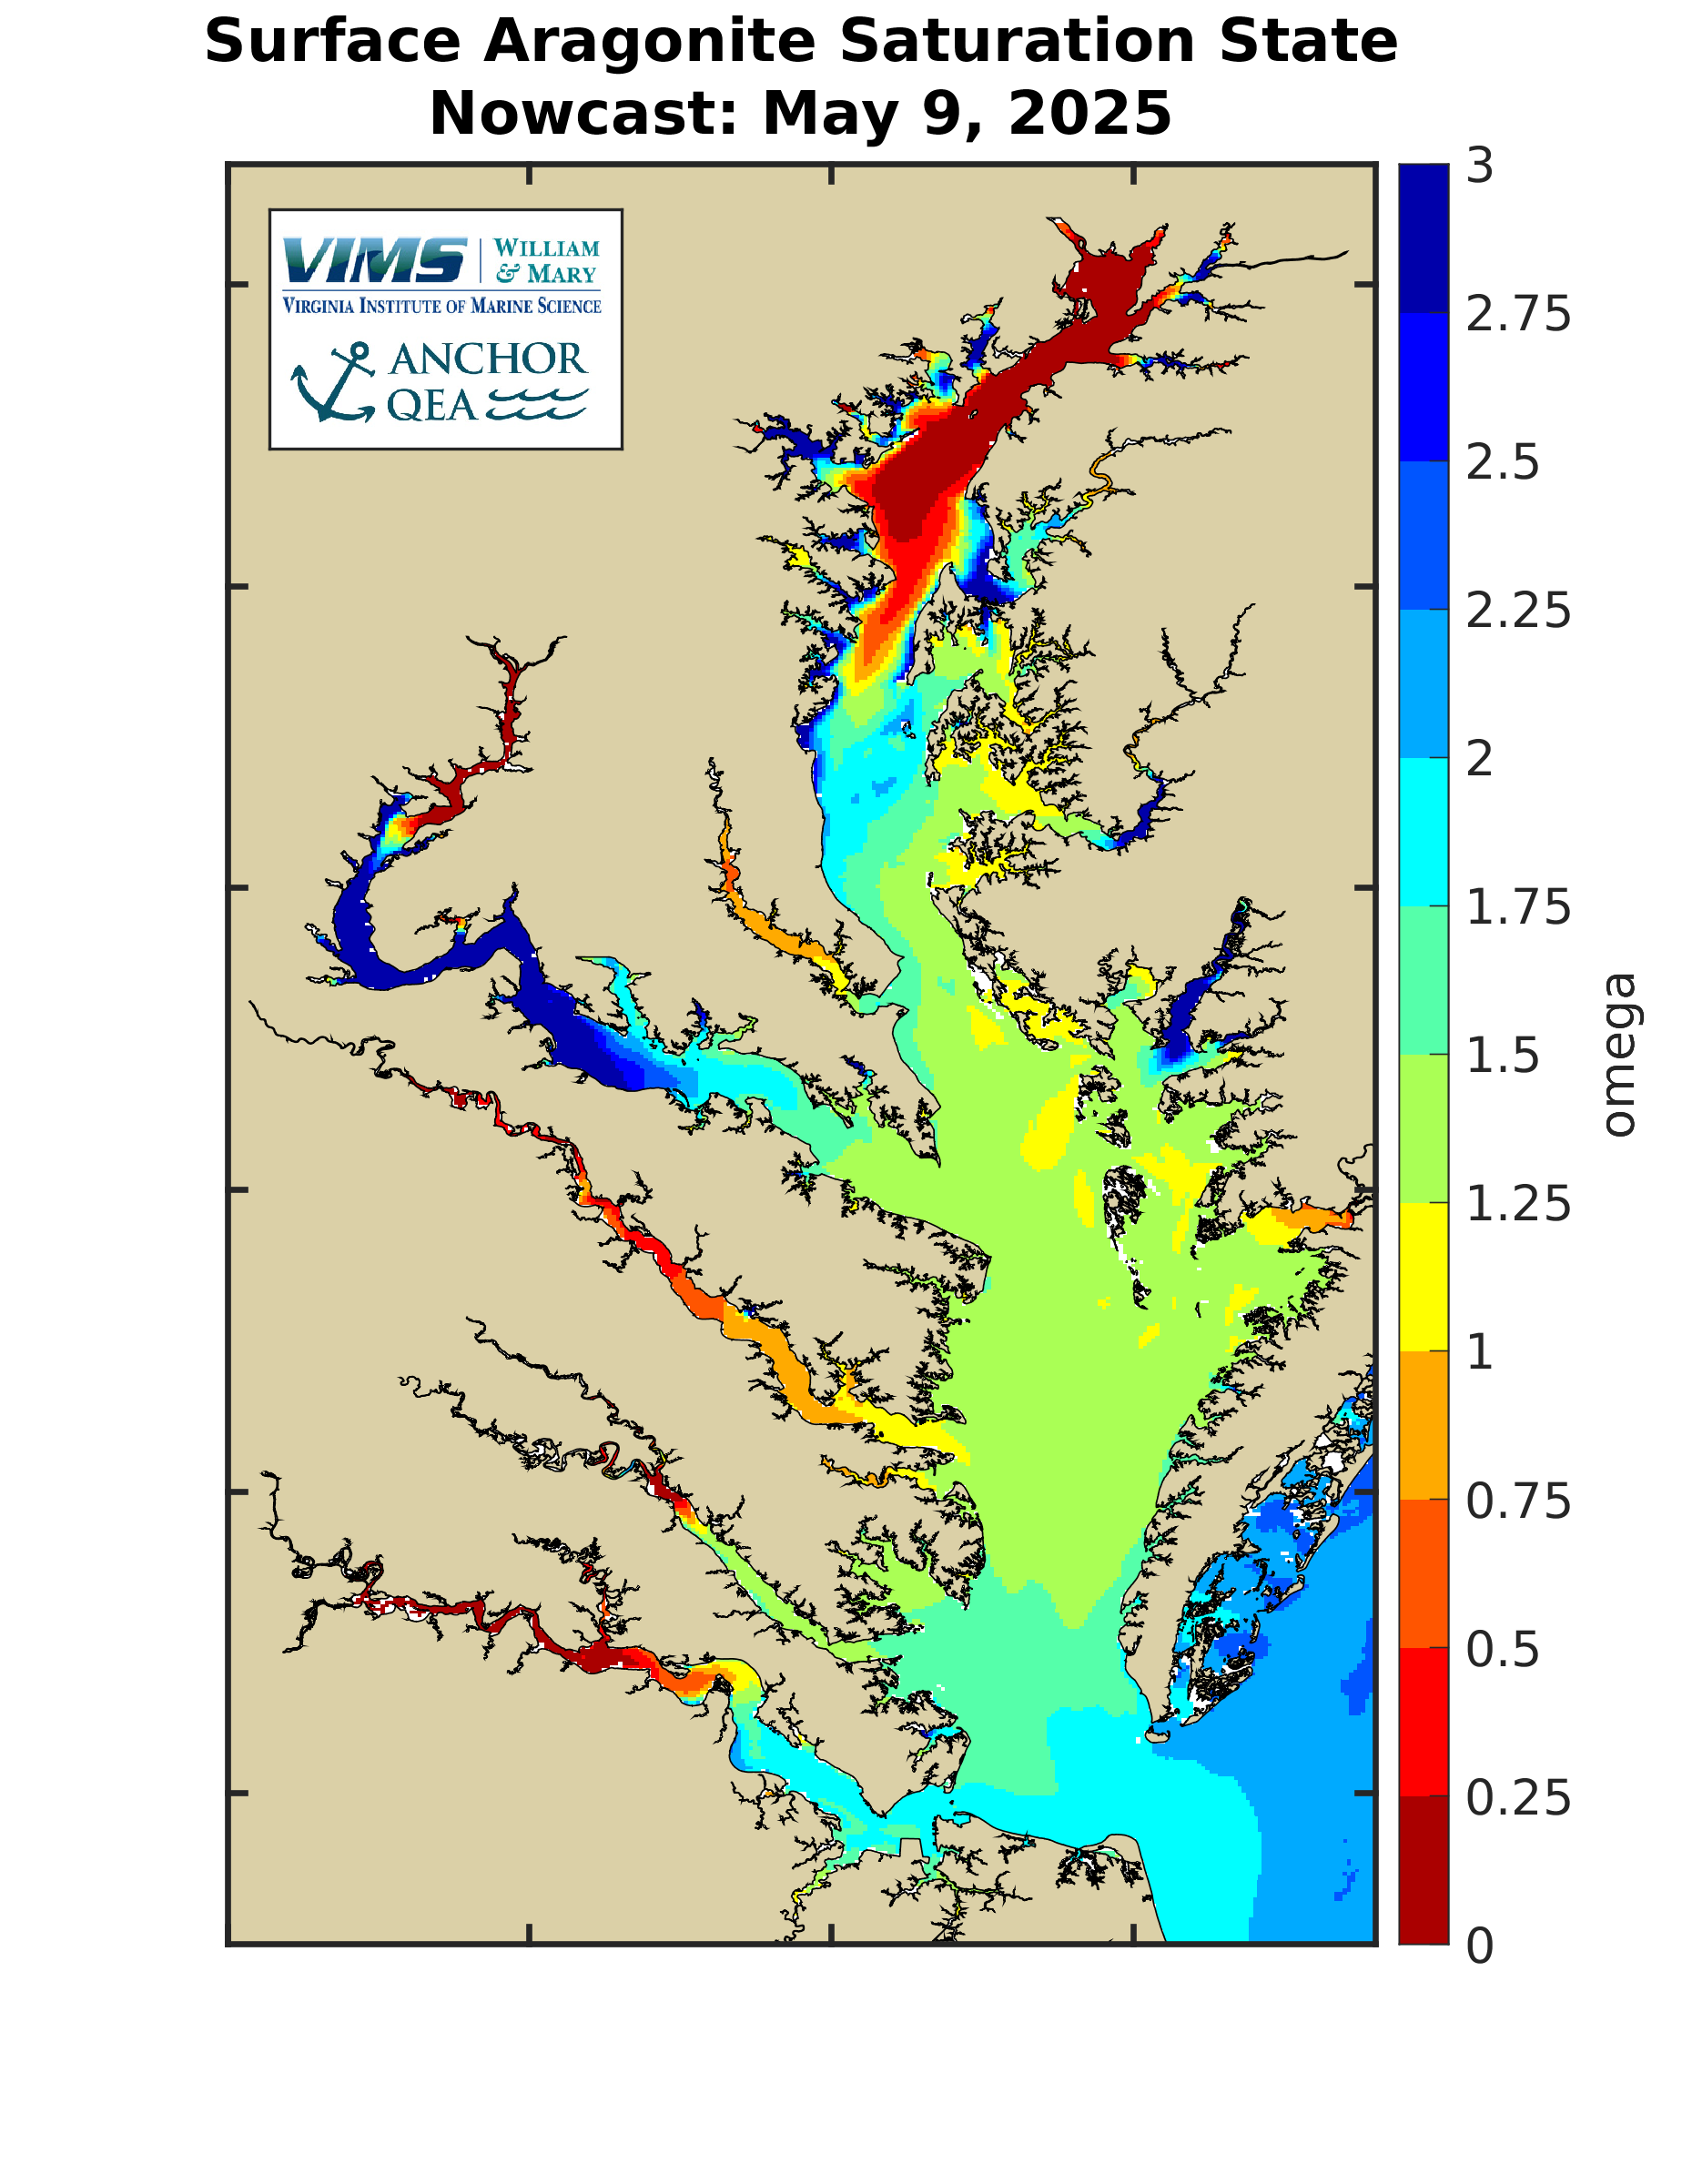
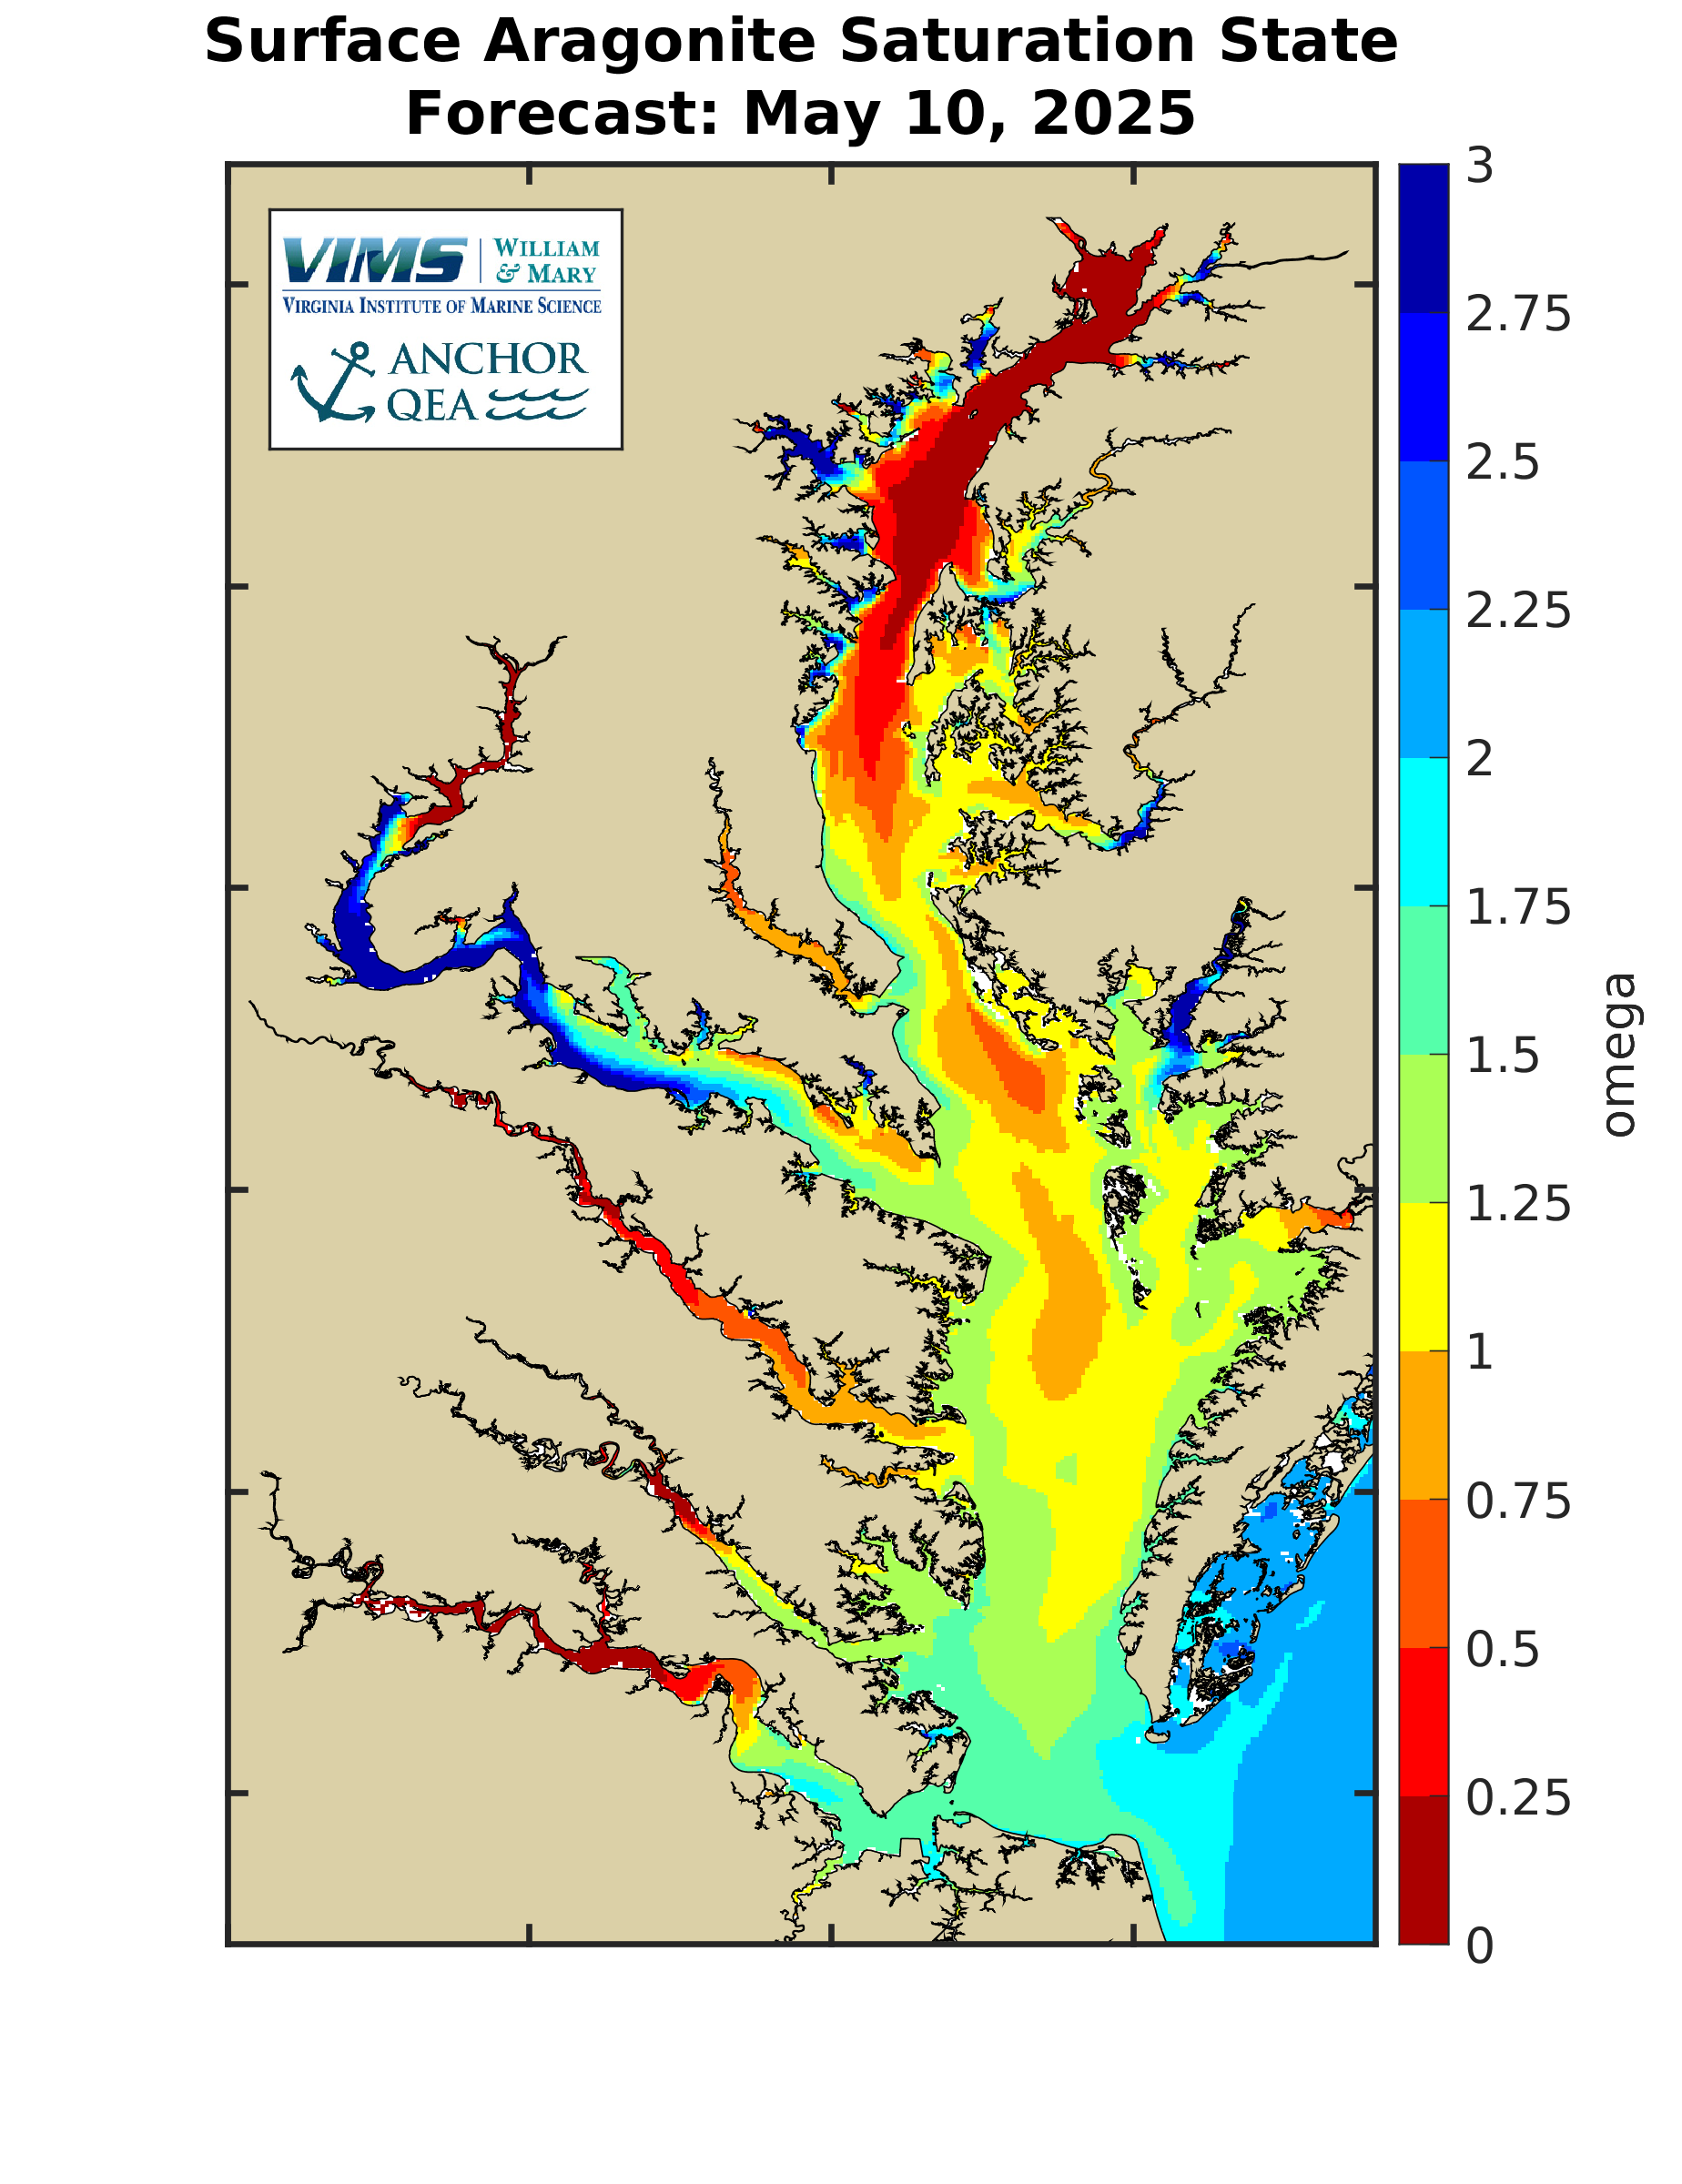
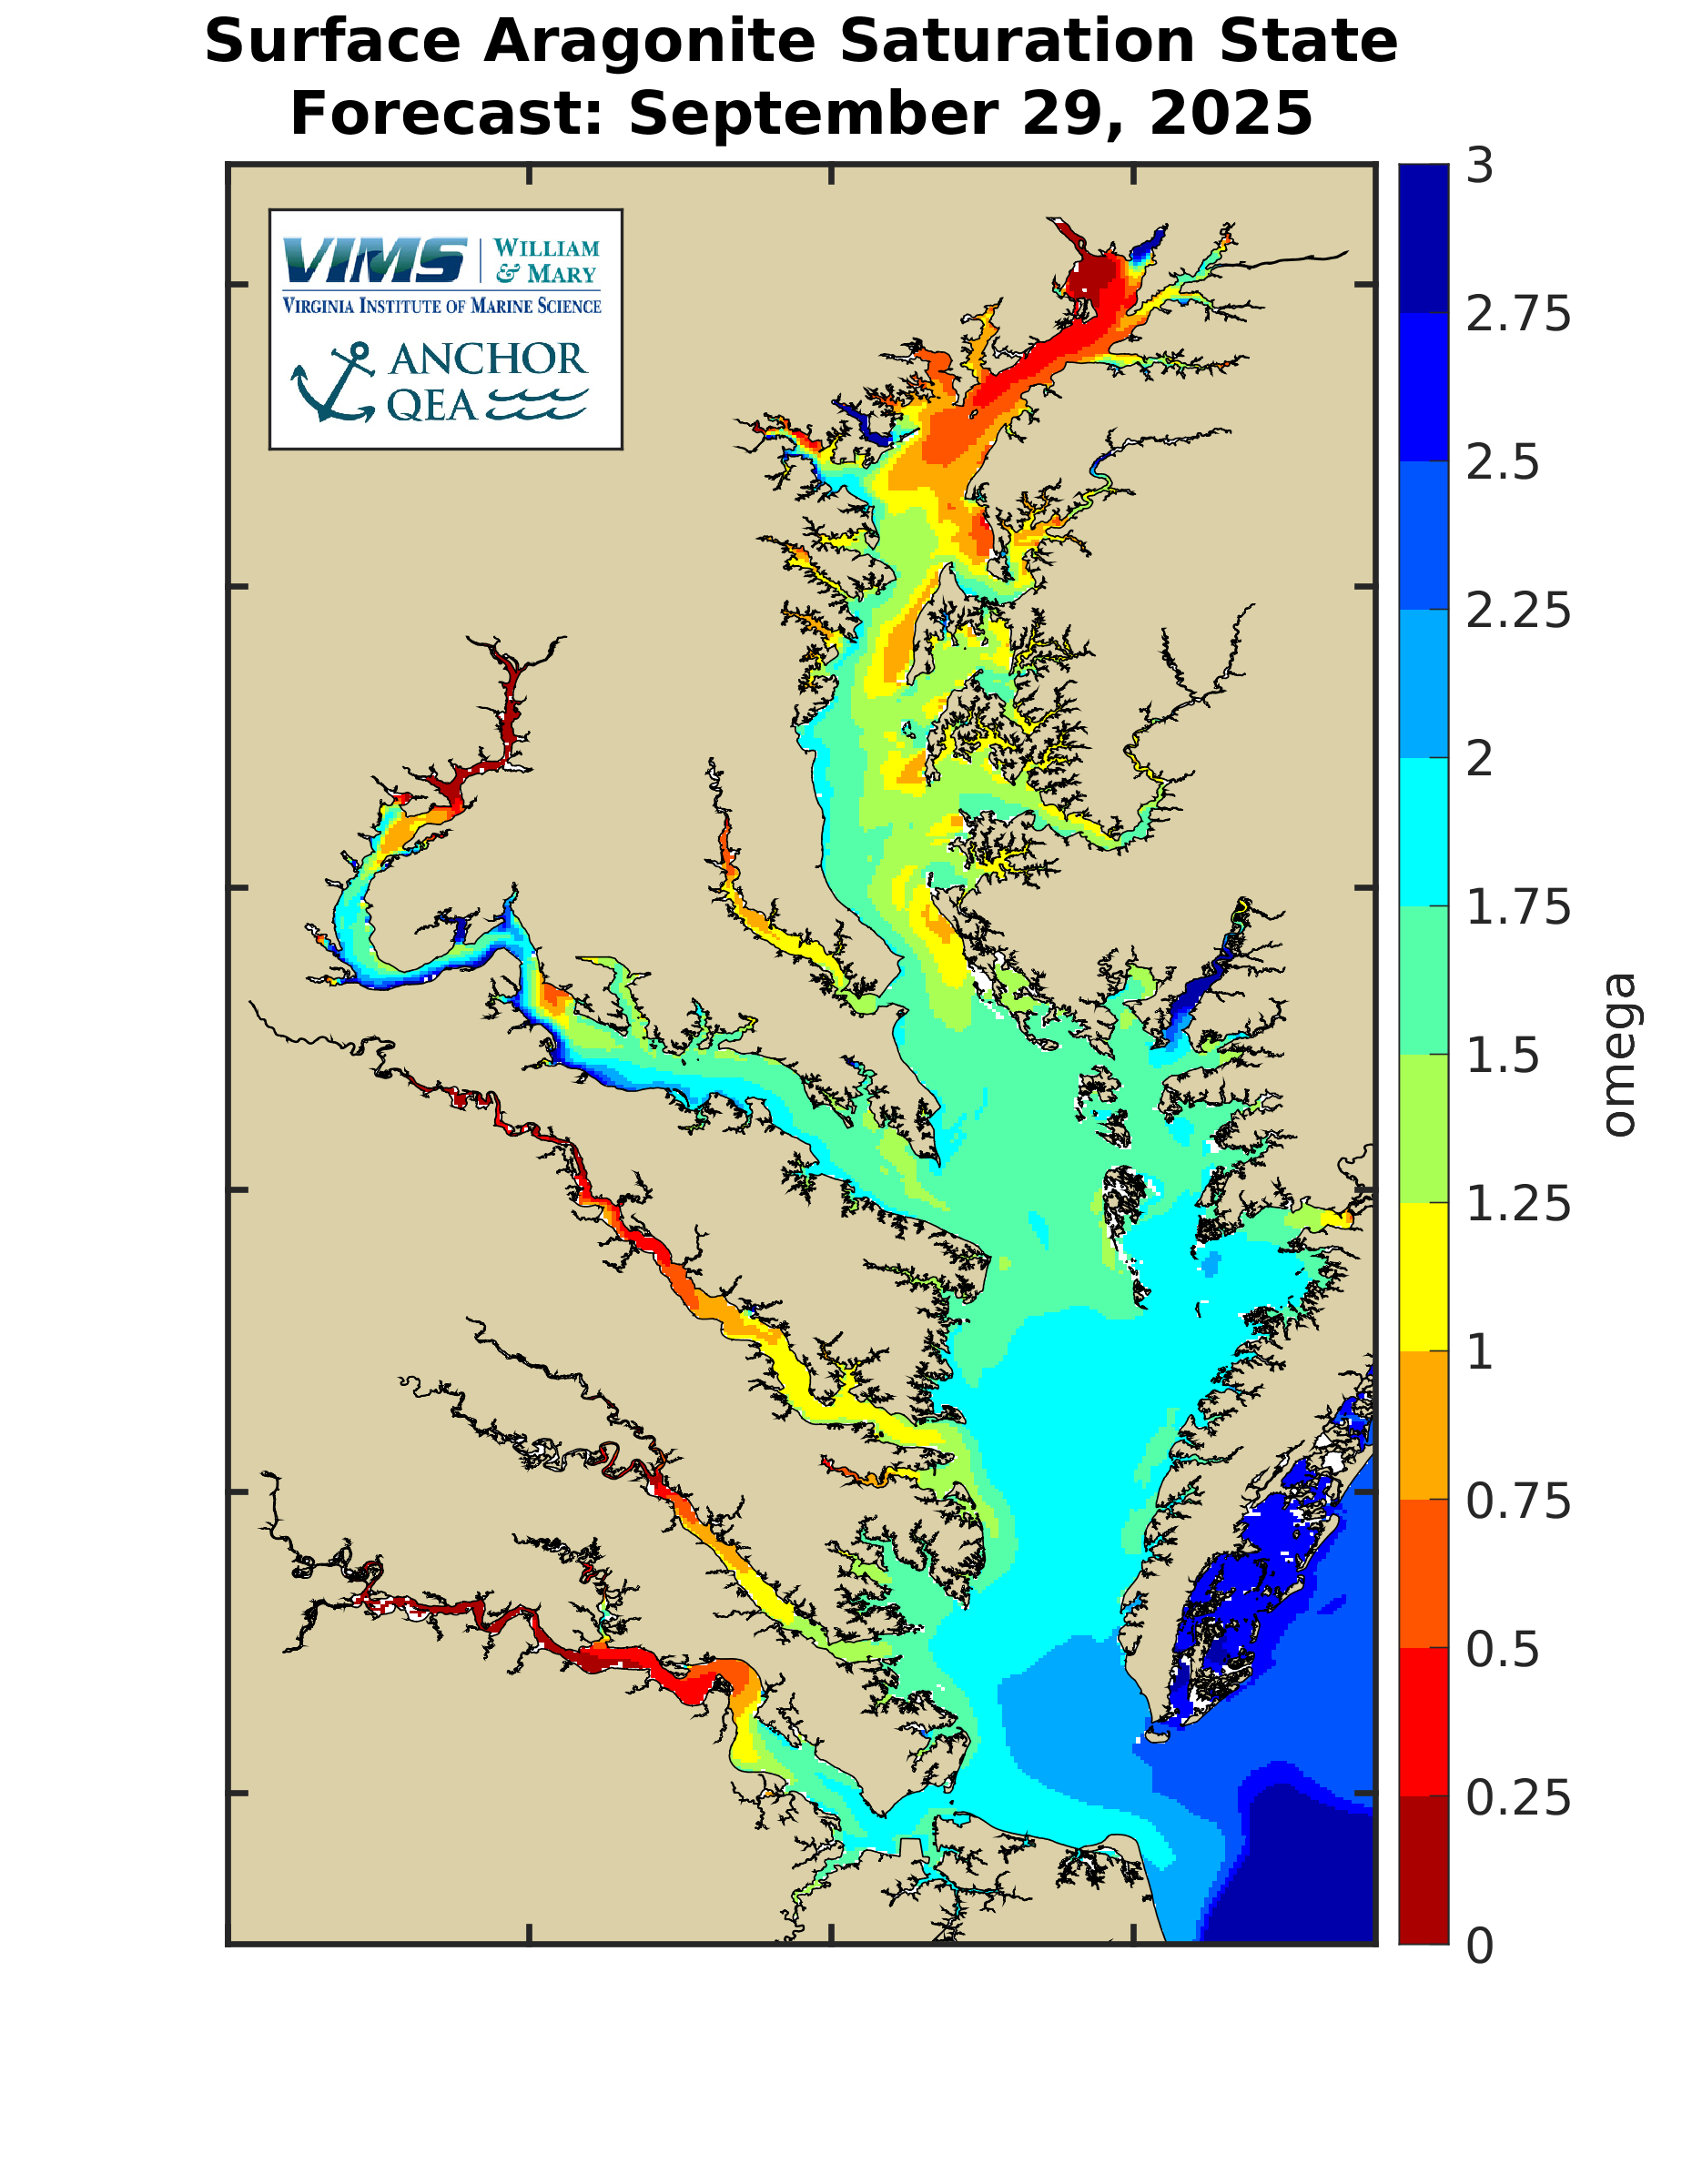
2026 Seasonal SummaryCBEFS forecasts the daily percent of the Bay bottom water with Omega (aragonite saturation state) greater than 1 and tracks the amount of bottom water throughout the year. The goal of this seasonal summary is to understand how acidification, as one metric of the suitability of the water for shellfish, during 2026 compares to past years. This summary focuses on the aragonite saturation state, also termed Omega, which is the saturation state of calcium carbonate in water. Omega influences how easily shellfish can create calcium carbonate shell from the necessary ingredients in the water. Omega greater than 2 is usually considered sufficient for shellfish to efficiently create shell, while Omega less 1 than indicates shell may start to dissolve back into the water. Thus, higher Omega indicates better conditions for shellfish and Omega greater than 1 represents a minimum value that can be considered suitable water for calcifying organisms (e.g., oysters). Omega in the Bay varies by year, seasonally, and spatially across the Bay. In 2026 the amount of Bay bottom water with Omega greater than 1 was relatively low in January and February compared to 2015 through 2024. However, the amount of suitable Bay bottom water increased in March to a relatively large amount of the Bay. This relatively large amount of suitable bottom water has remained through July. Through July, the total annual amount of suitable bottom water, in terms of Omega, is tracking toward being the second best year since 2015 (second to 2023). Check back throughout the year to see how conditions change. Maps below under the Aragonite Saturation State (Omega) - Bottom Maps dropdown show the current forecasts for bottom water Omega in the Bay.
|
Climate Change, Acidification, and Multiple Stressor Effects on Chesapeake Bay OystersA recent research project was conducted by a team of scientists from the Virginia Institute of Marine Science, Oregon State University, and Anchor QEA to evaluate how the compounding effects of multiple stressors affect oyster growth and oyster aquaculture production in the Chesapeake Bay. This research utilized extensive outreach to shellfish aquaculturists, including oyster farmers and resource managers, and cutting-edge science to evaluate how sensitive Chesapeake Bay oyster aquaculture is to past and projected future habitat conditions in the Bay. Results from the project indicate that under future acidification, warming, and nutrient management, there will be substantial reductions in shell and tissue weights of Eastern oysters in the Chesapeake Bay. Lower oyster growth rates will be largely driven by lowered calcium carbonate saturation states and lowered food availability. Oyster aquaculture practices in the region could also be affected. Natural selection in wild oysters and selective breeding in hatchery-based aquaculture in response to changing conditions may help mitigate some of these impacts. Choices about where to locate oyster farm operations may become increasingly important as impacts will be highly variable across the Bay. The results of the study are presented on an interactive web map that visualizes the modeled influence of numerous oyster stressors on aquaculture harvest landings. The project-specific webpage and interactive map viewer can be found at the Interactive Map Webpage. |
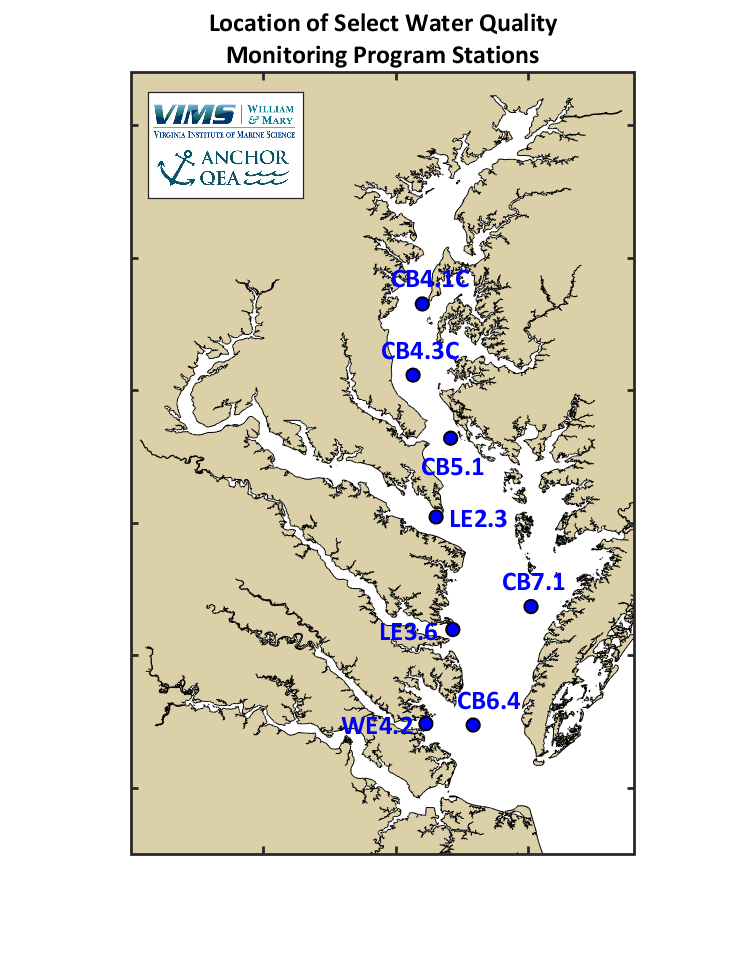
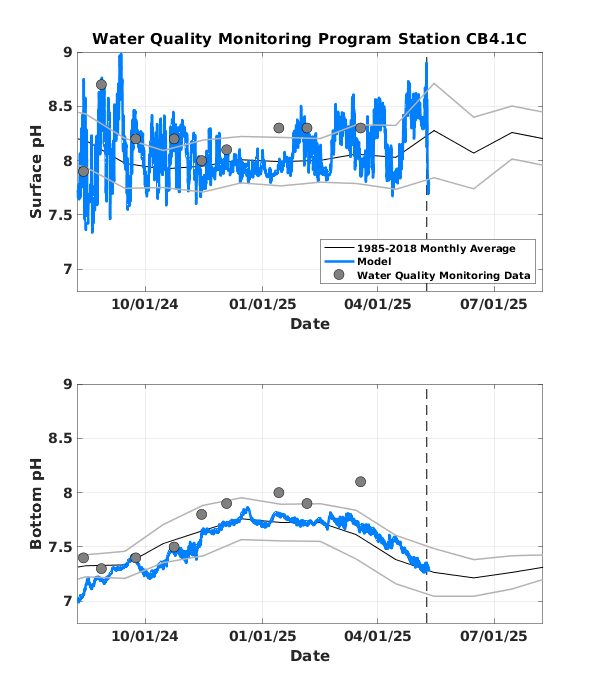
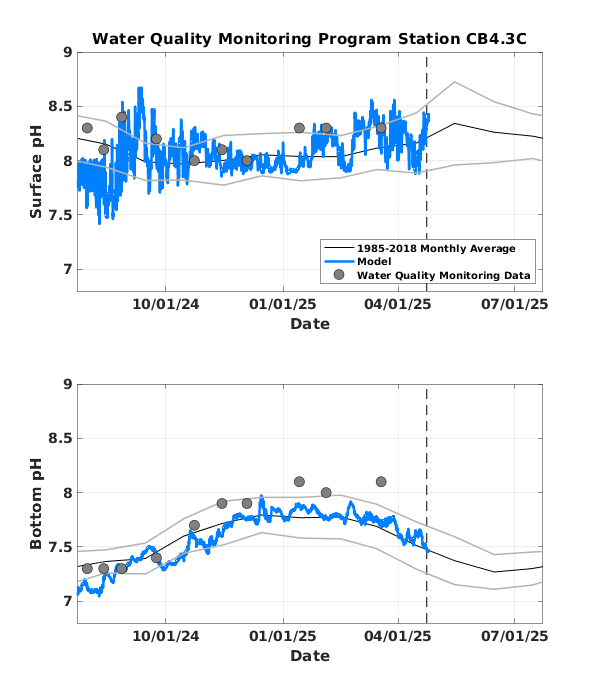
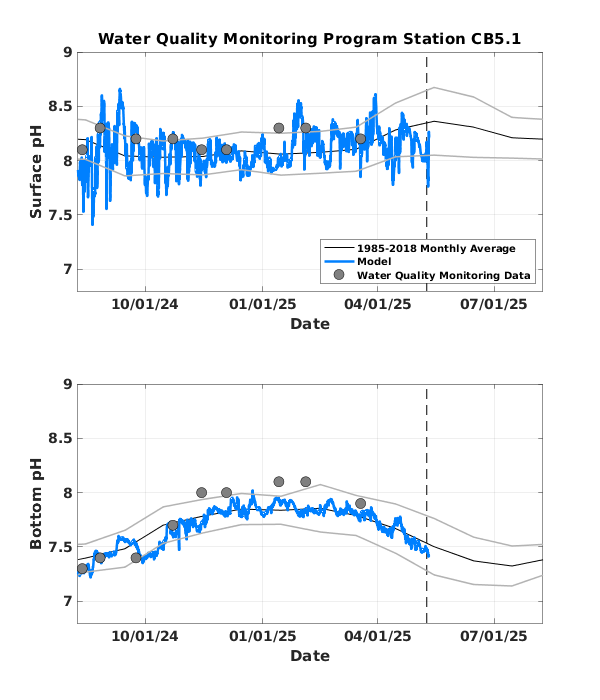
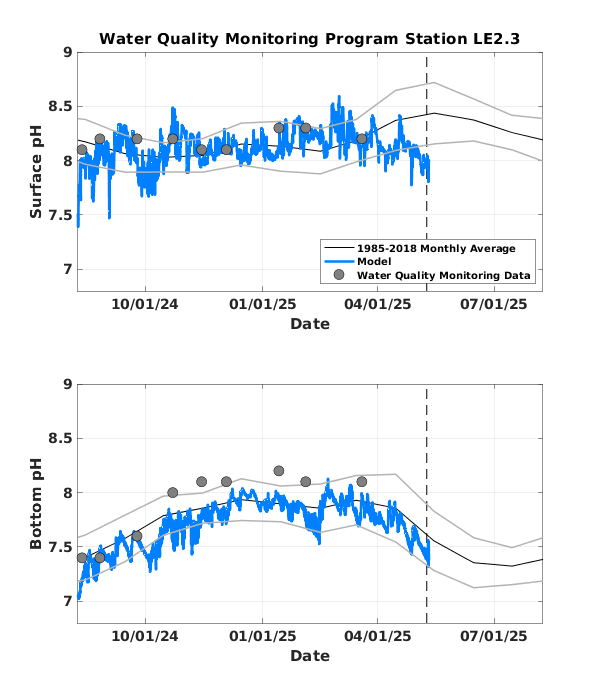
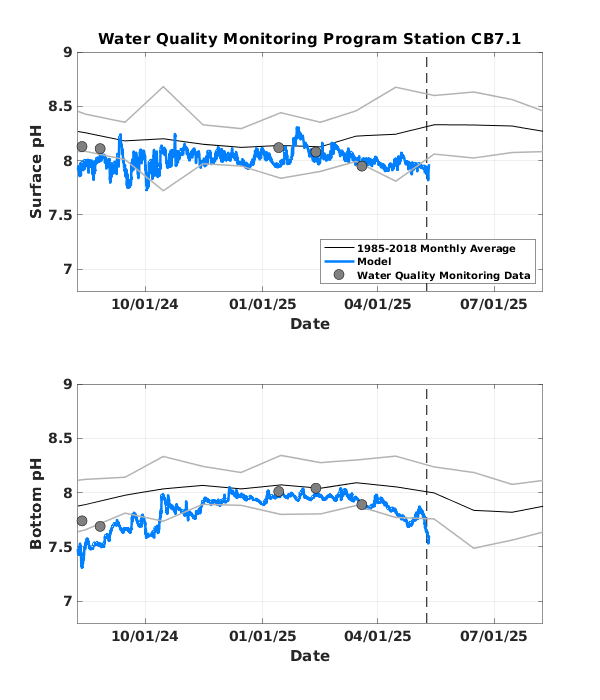
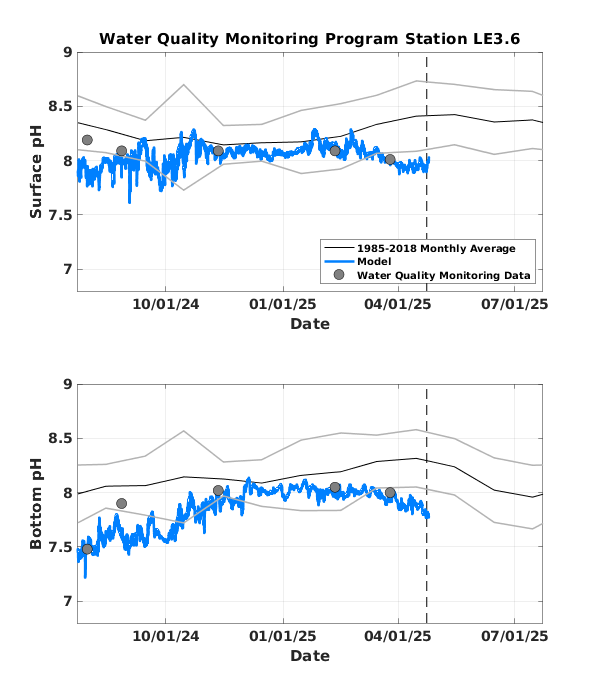
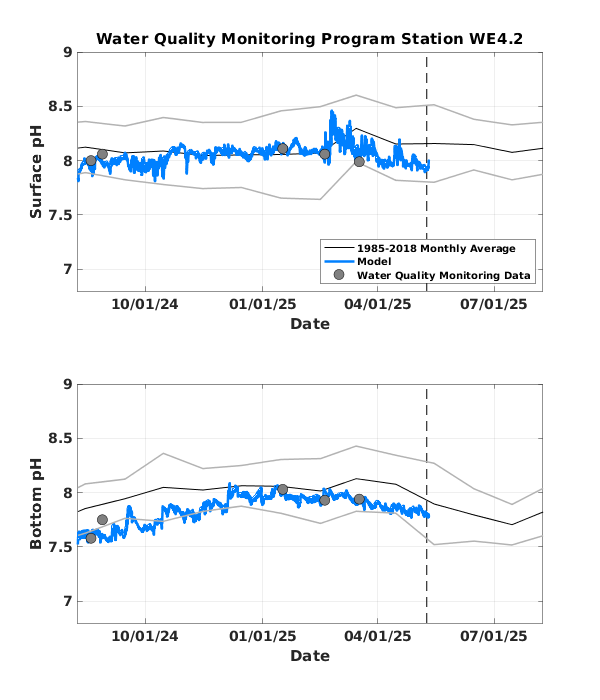
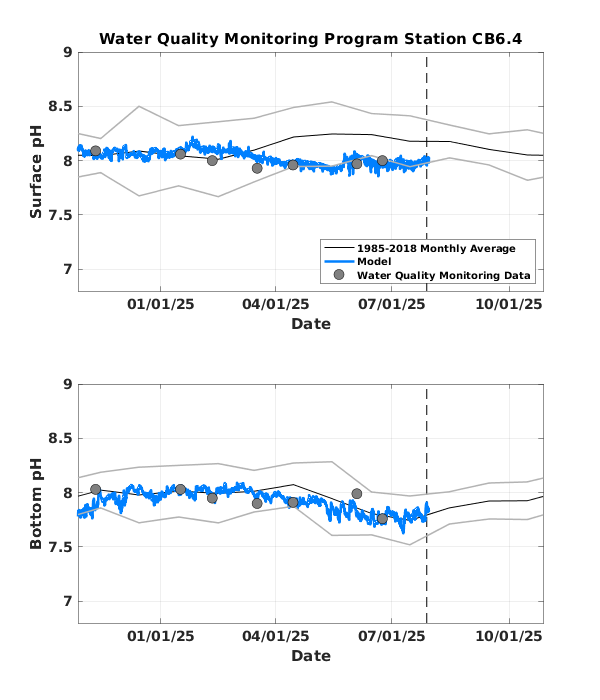
pH Line PlotspH can be viewed through time at select locations to understand the seasonal and weekly changes in pH in the Chesapeake Bay. Overlaying the modeled pH on top of long-term averages from observed data shows how the forecasted pH compares to the historical average. Grey lines show one standard deviation above and below the average.
|
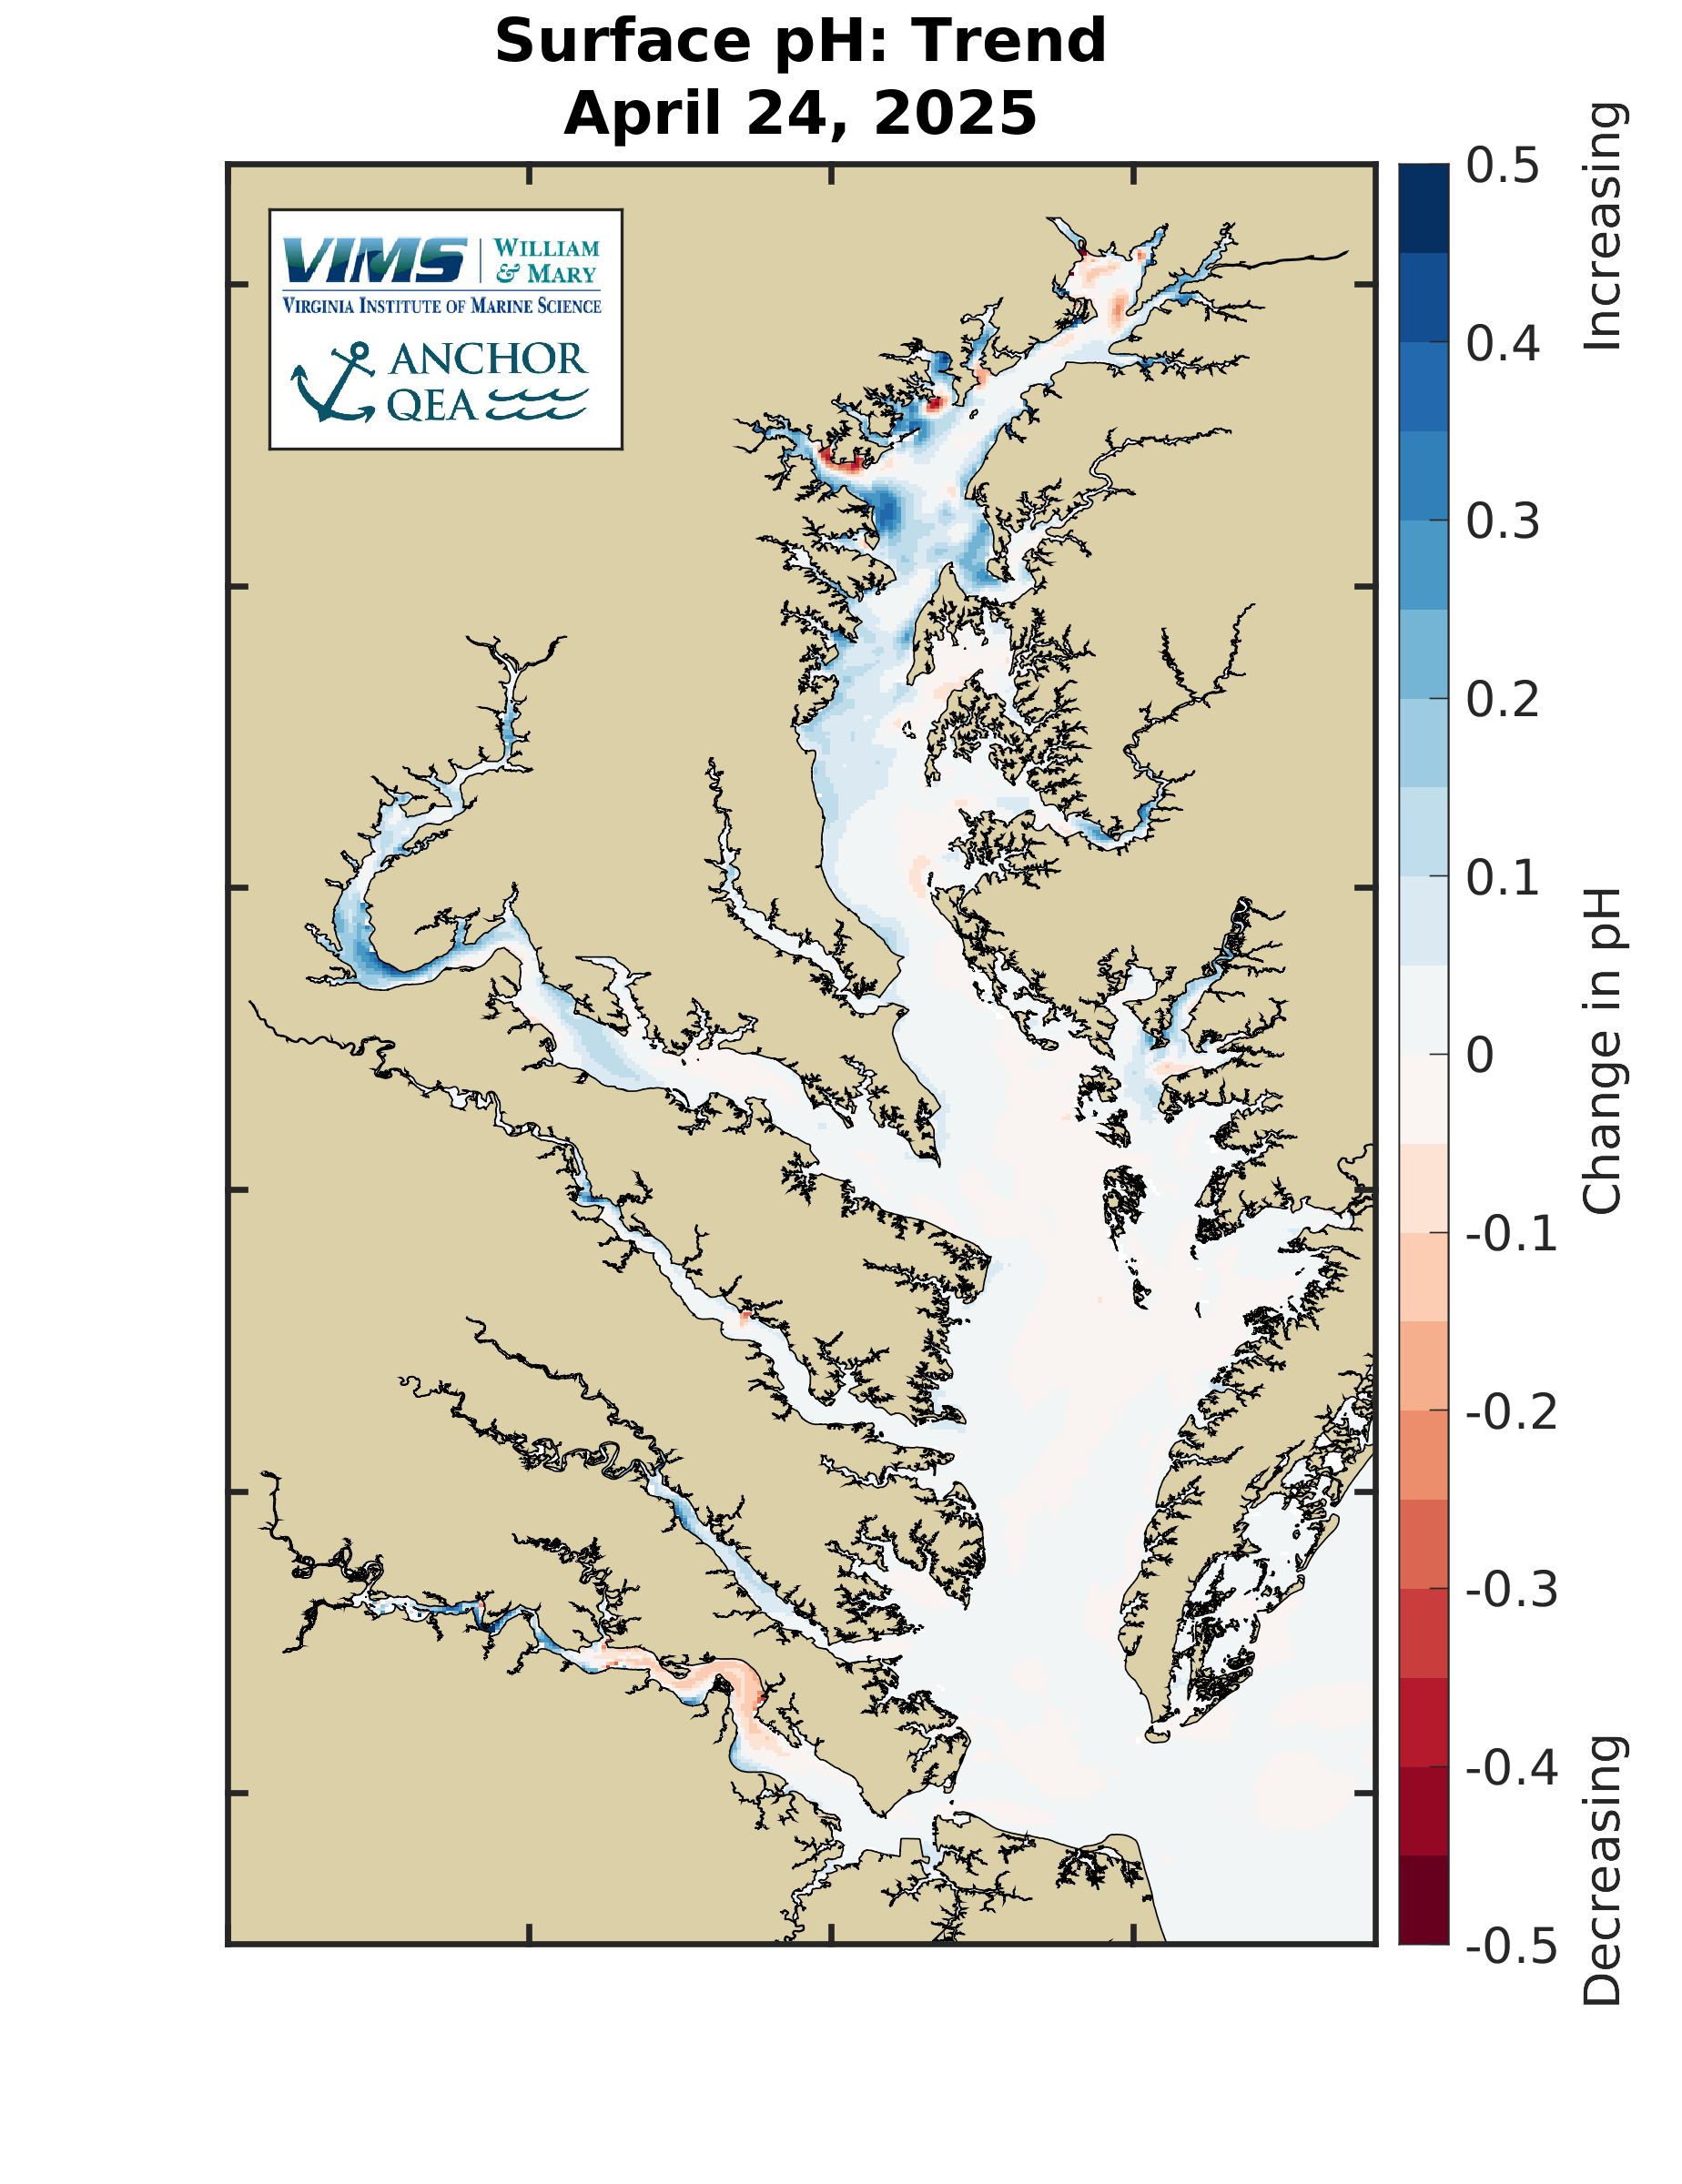
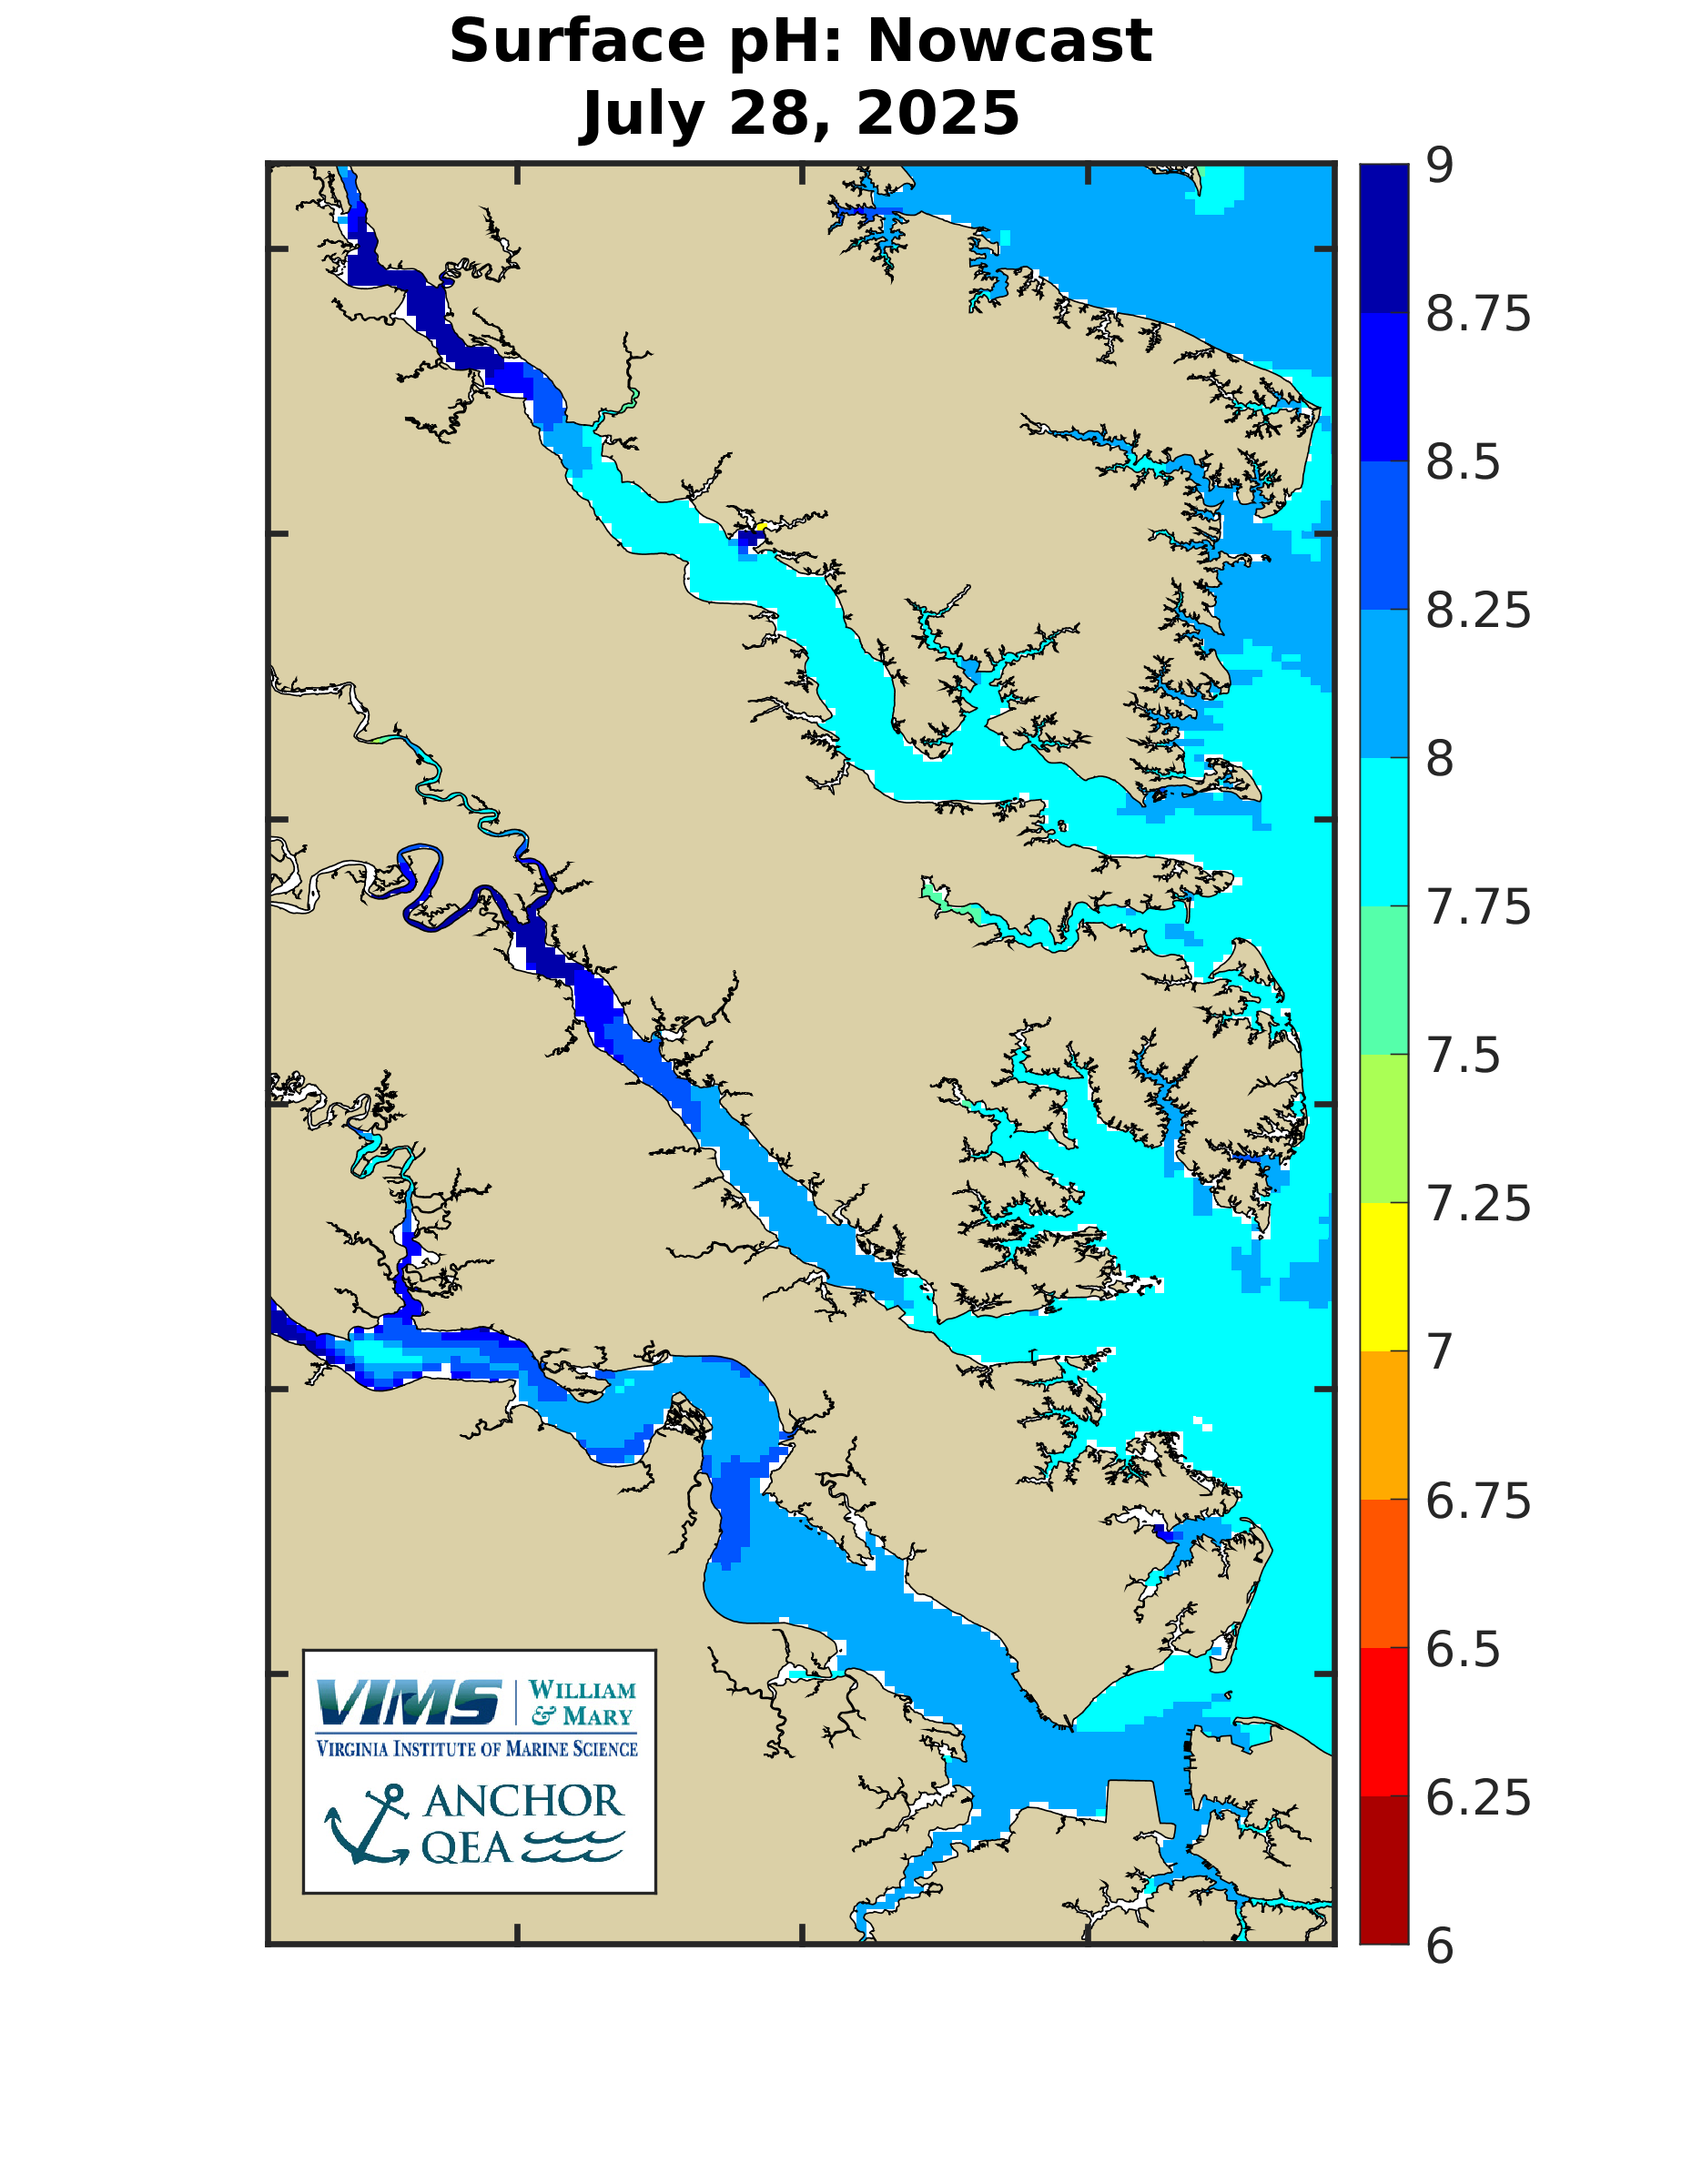
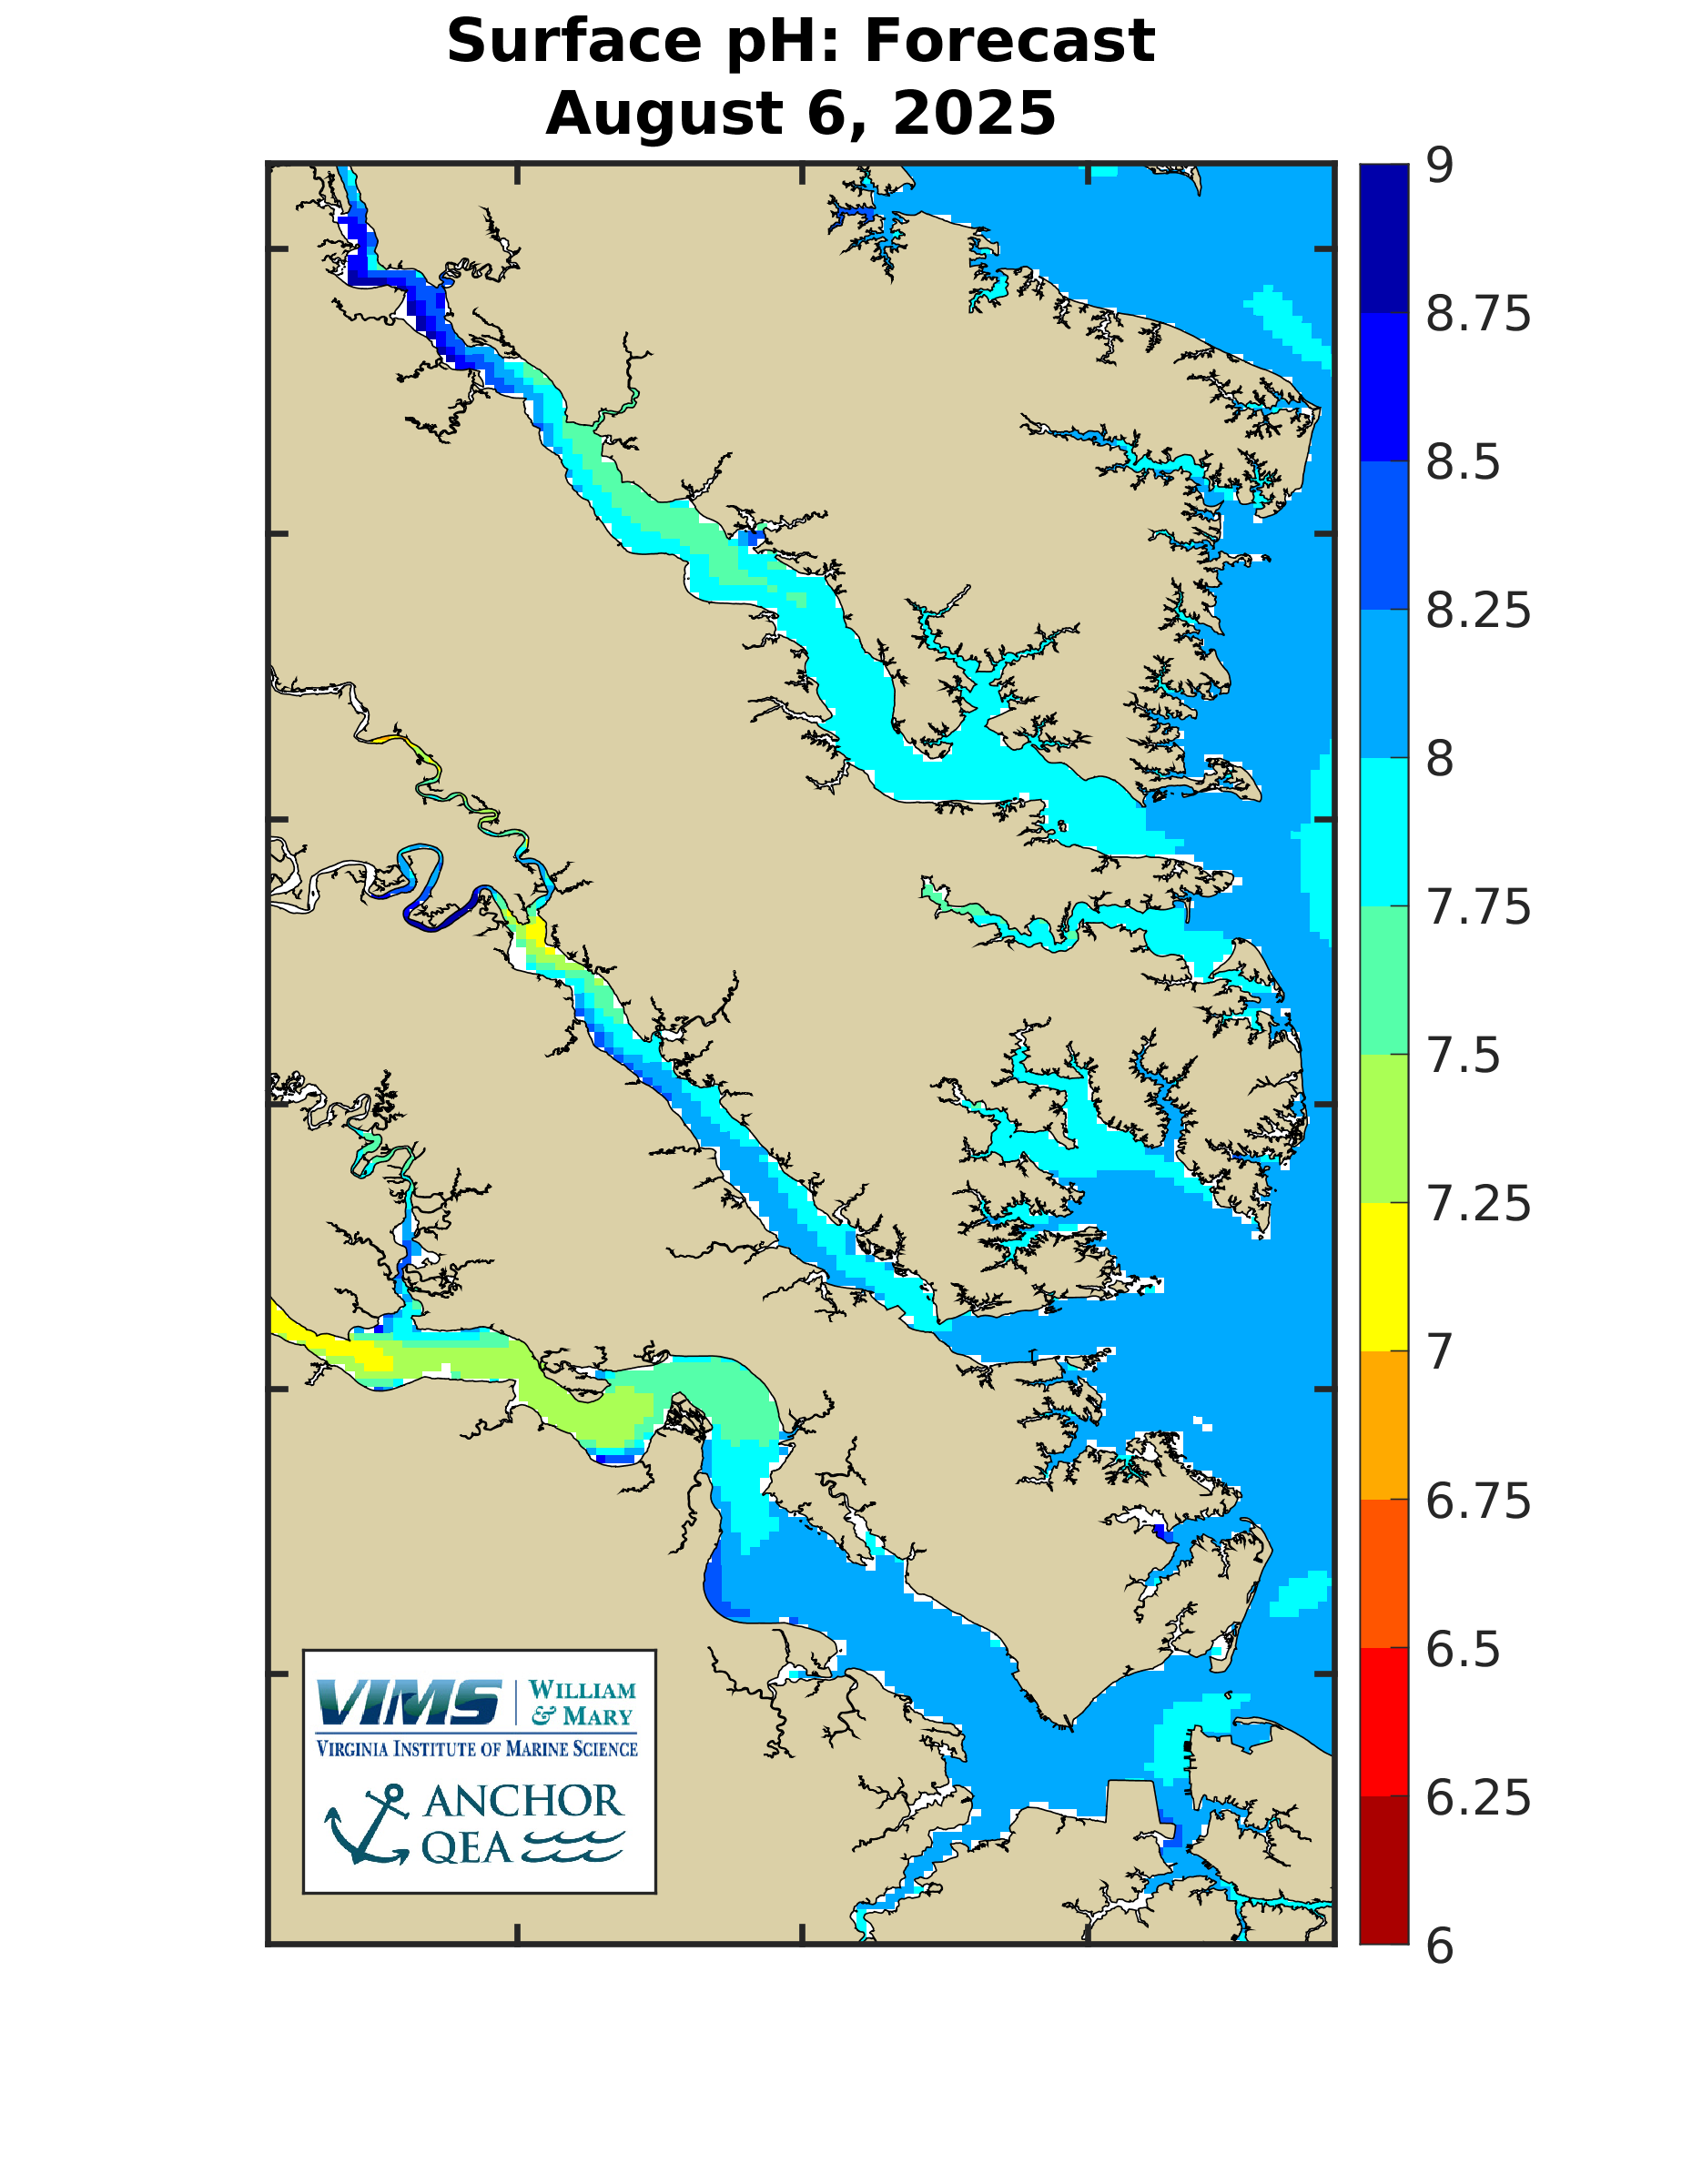
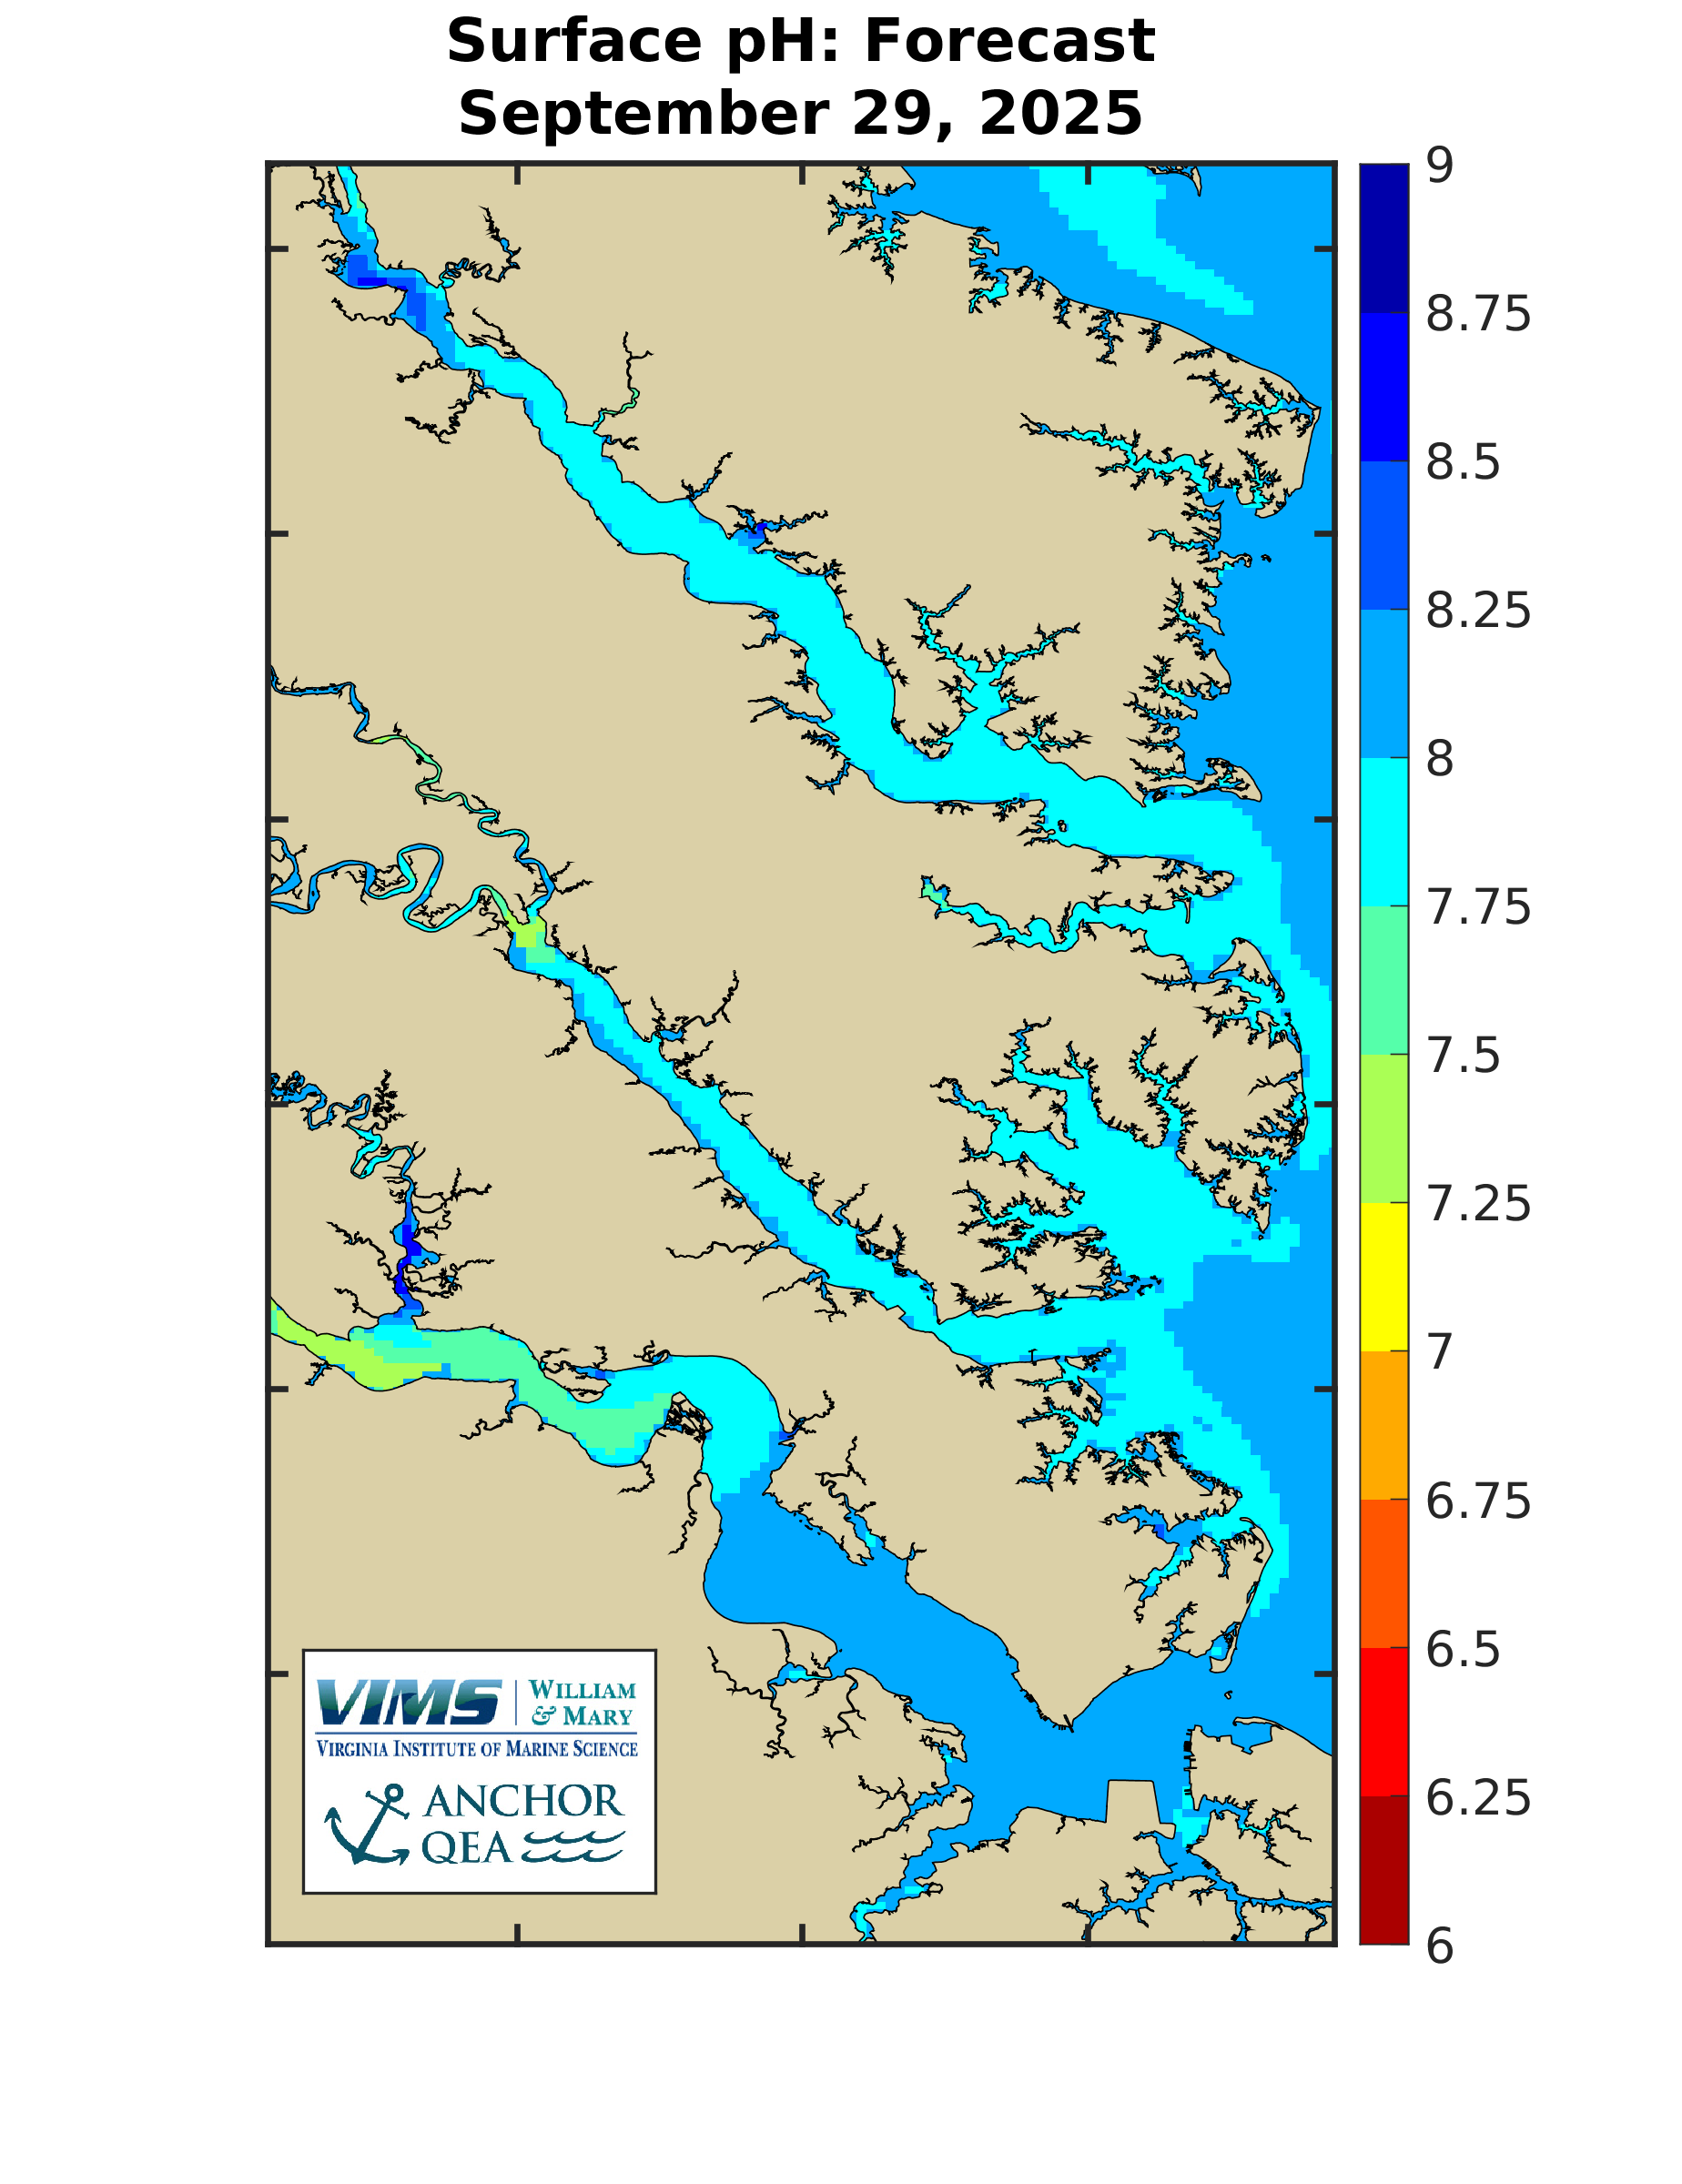
pH - Surface Maps
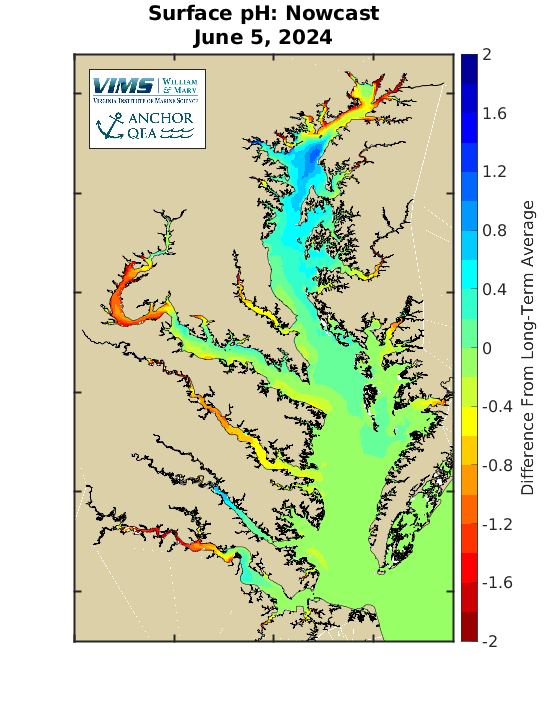
Difference From Long-Term AverageCurrent conditions are compared to the long-term average conditions to put current conditions in perspective relative to average conditions. Long-term average conditions were calculated using a computer model simulation spanning 1985 through 2023. The below map shows the difference between current conditions and the long-term average conditions on the day noted. For more information on the long-term averages please see the Chesapeake Atlas.
|
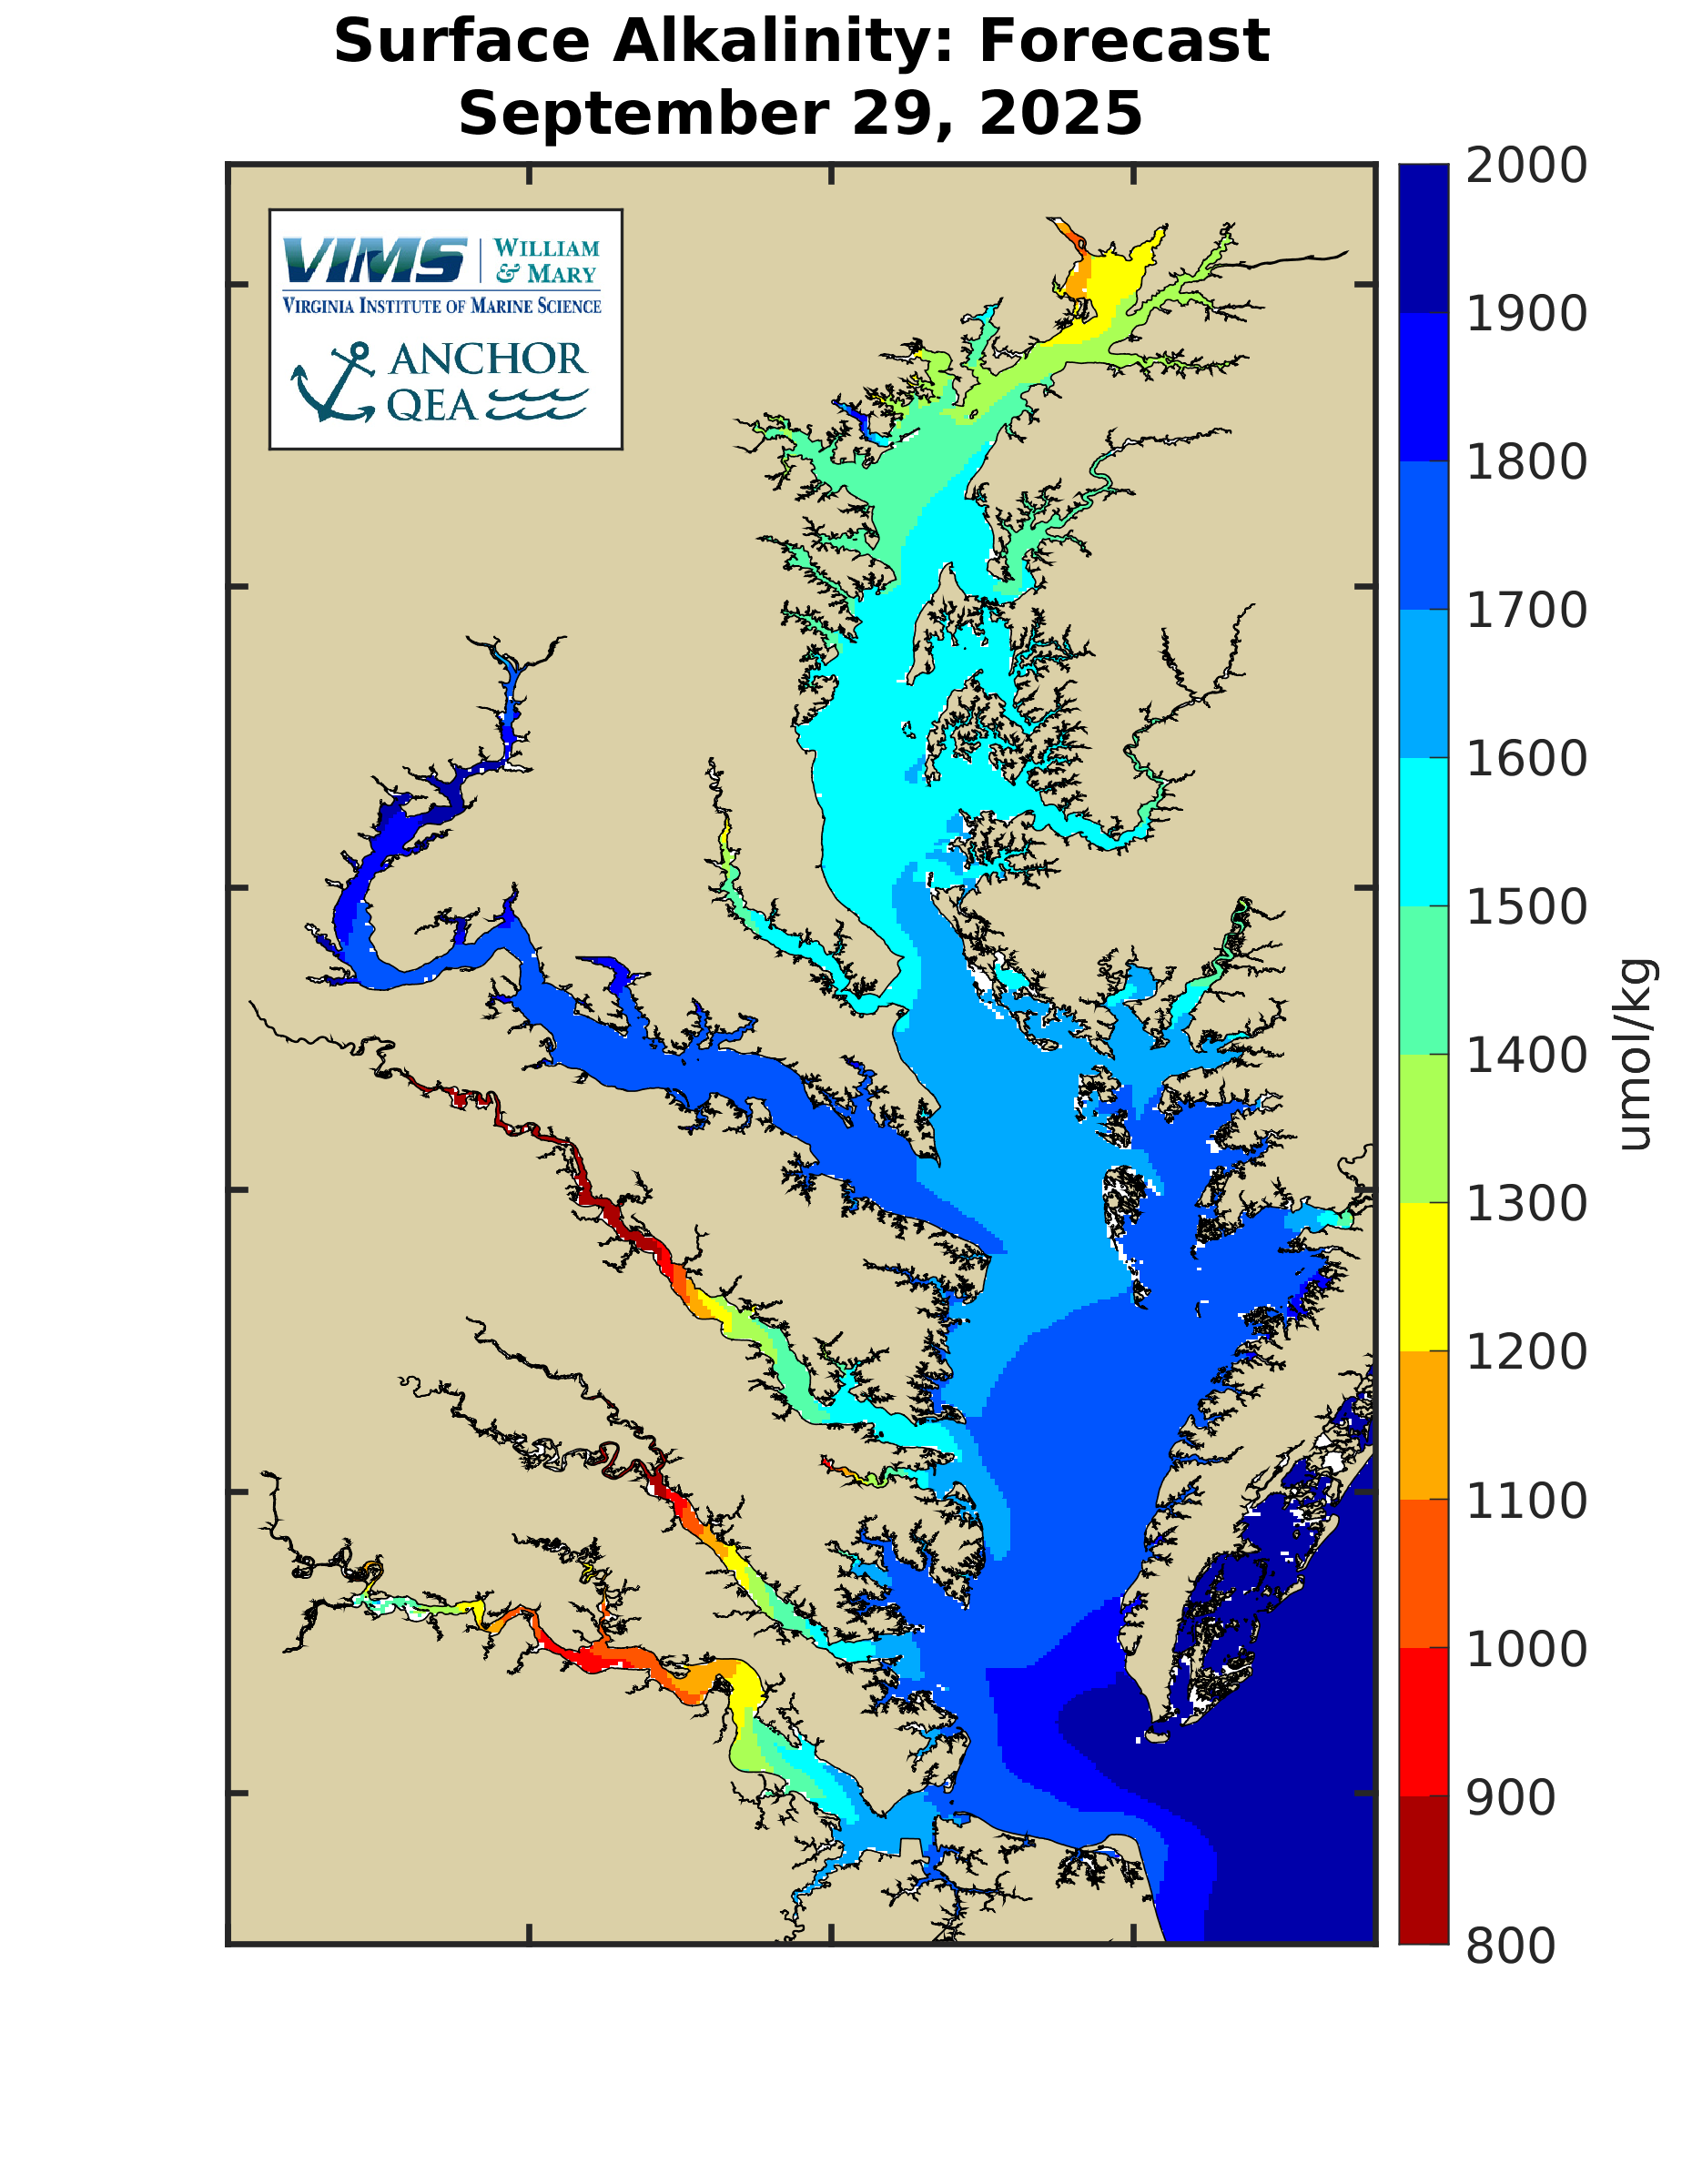
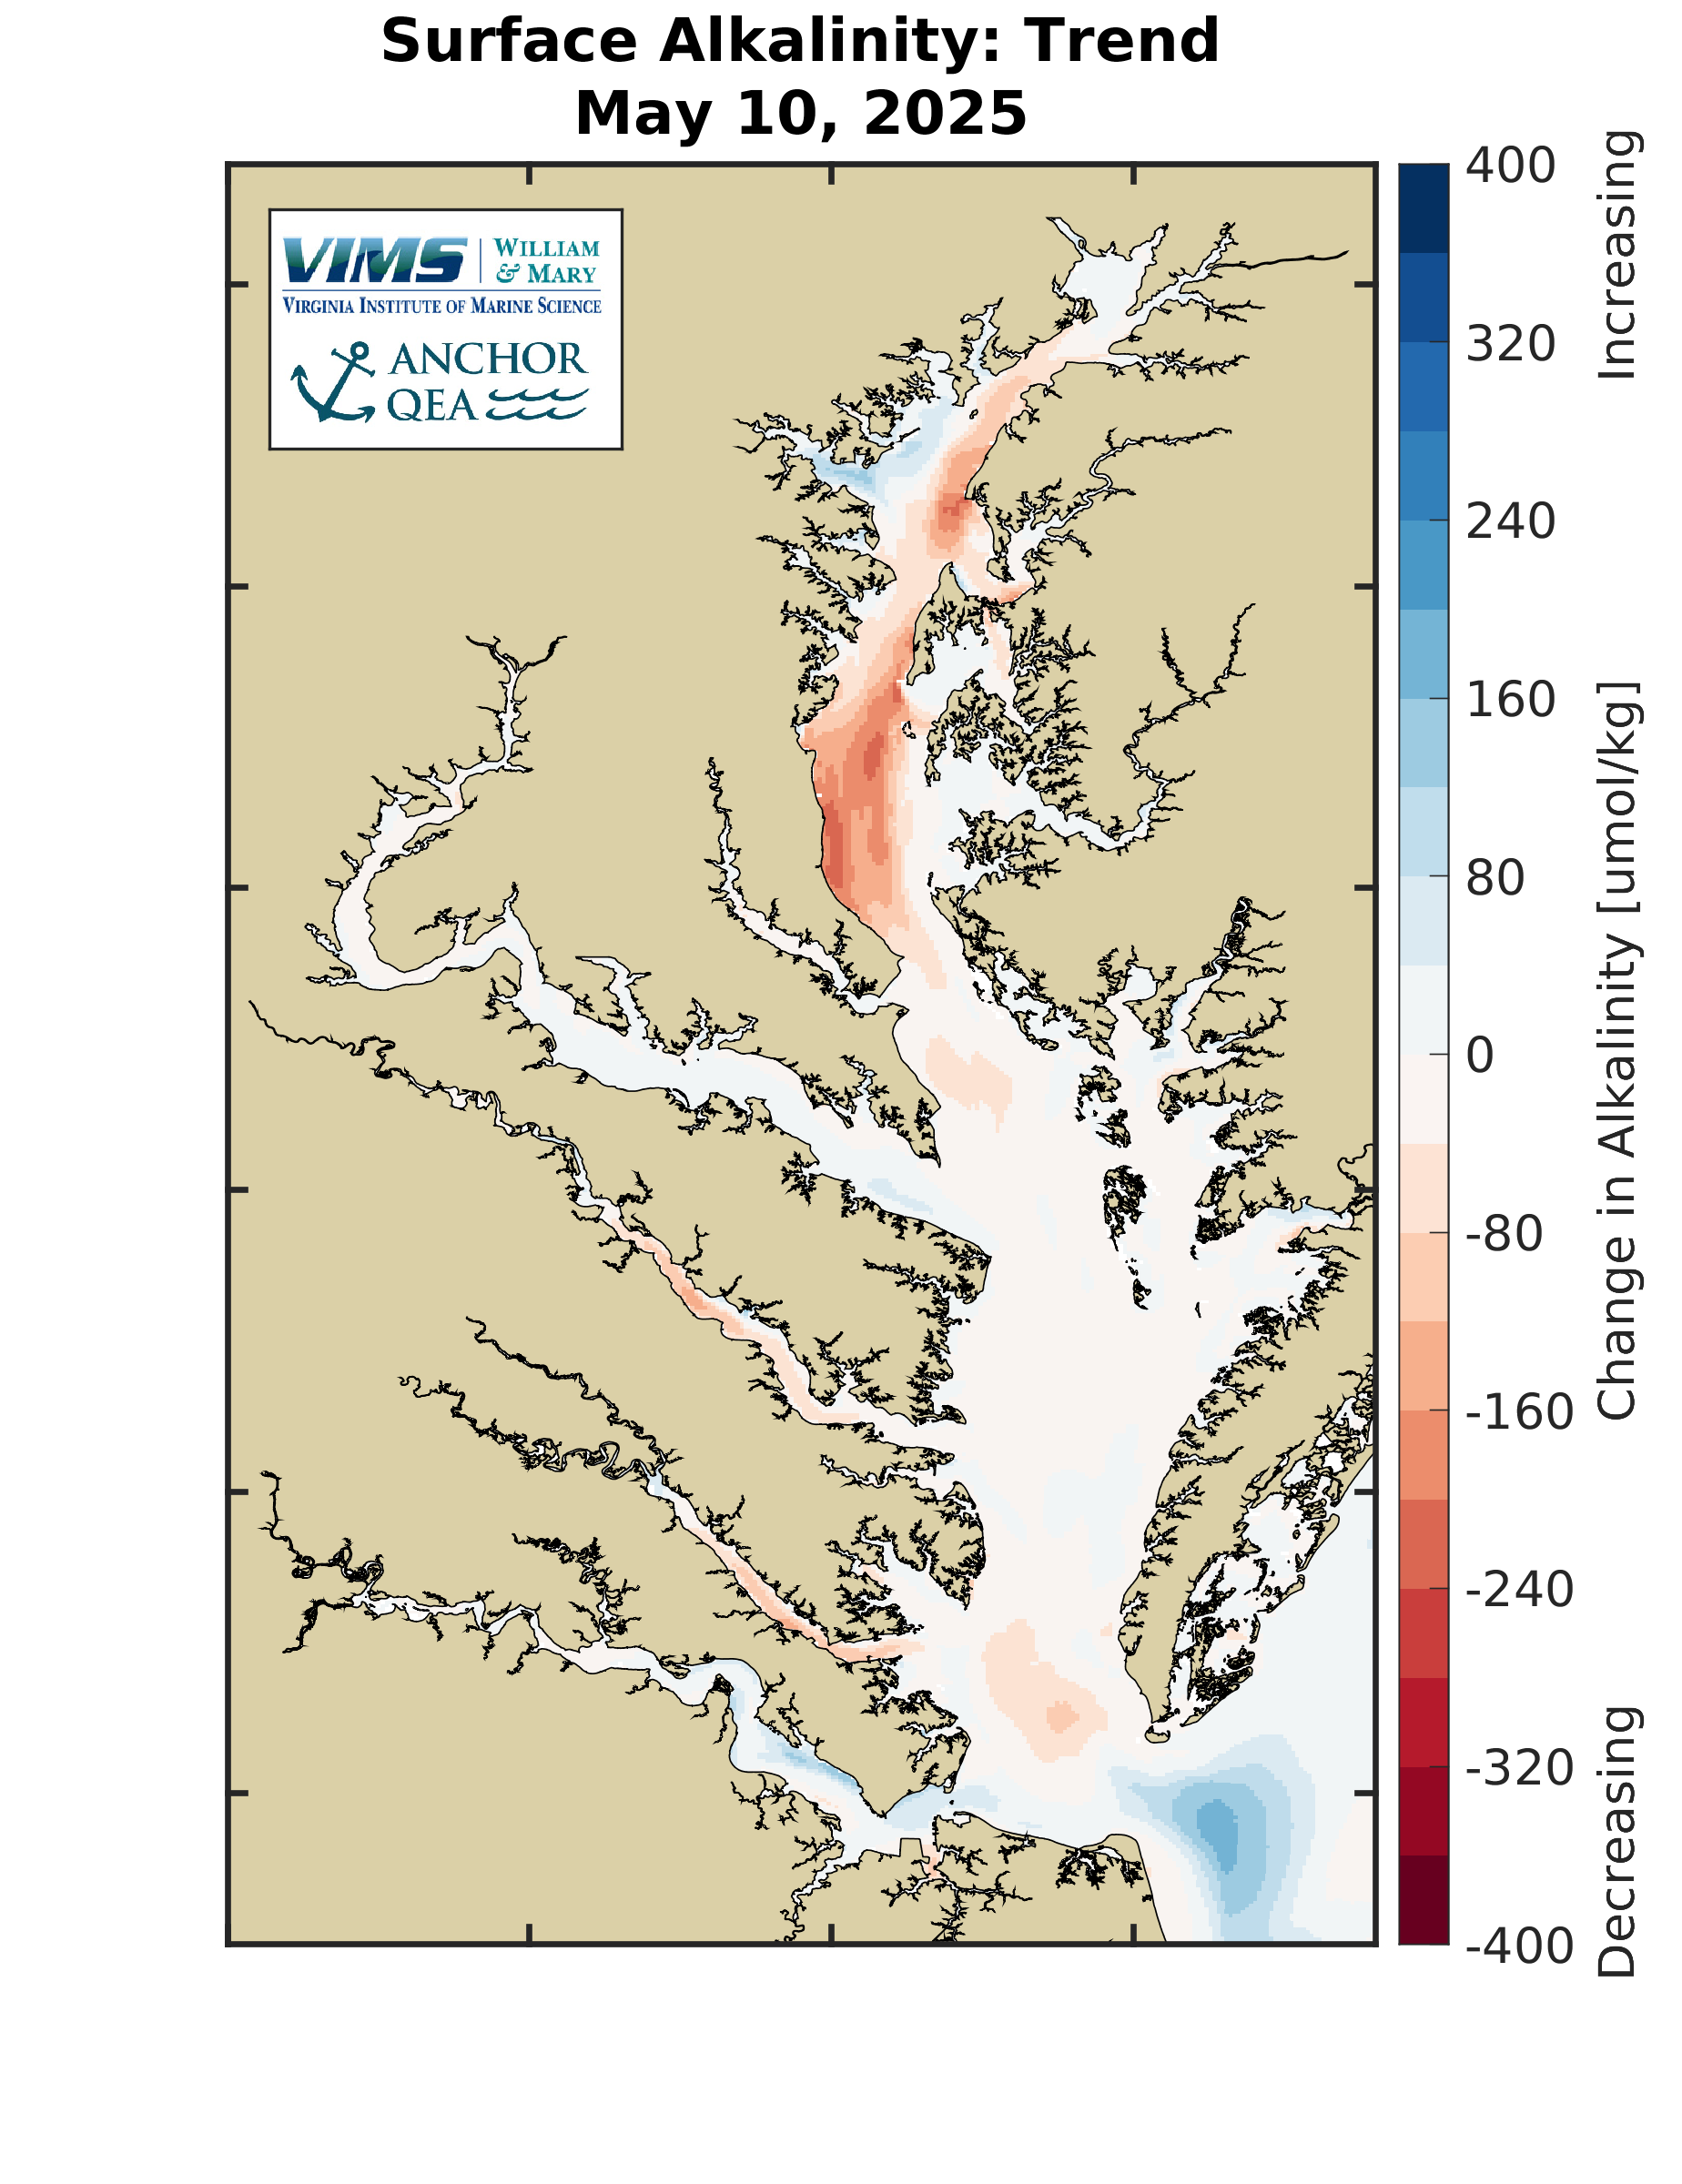
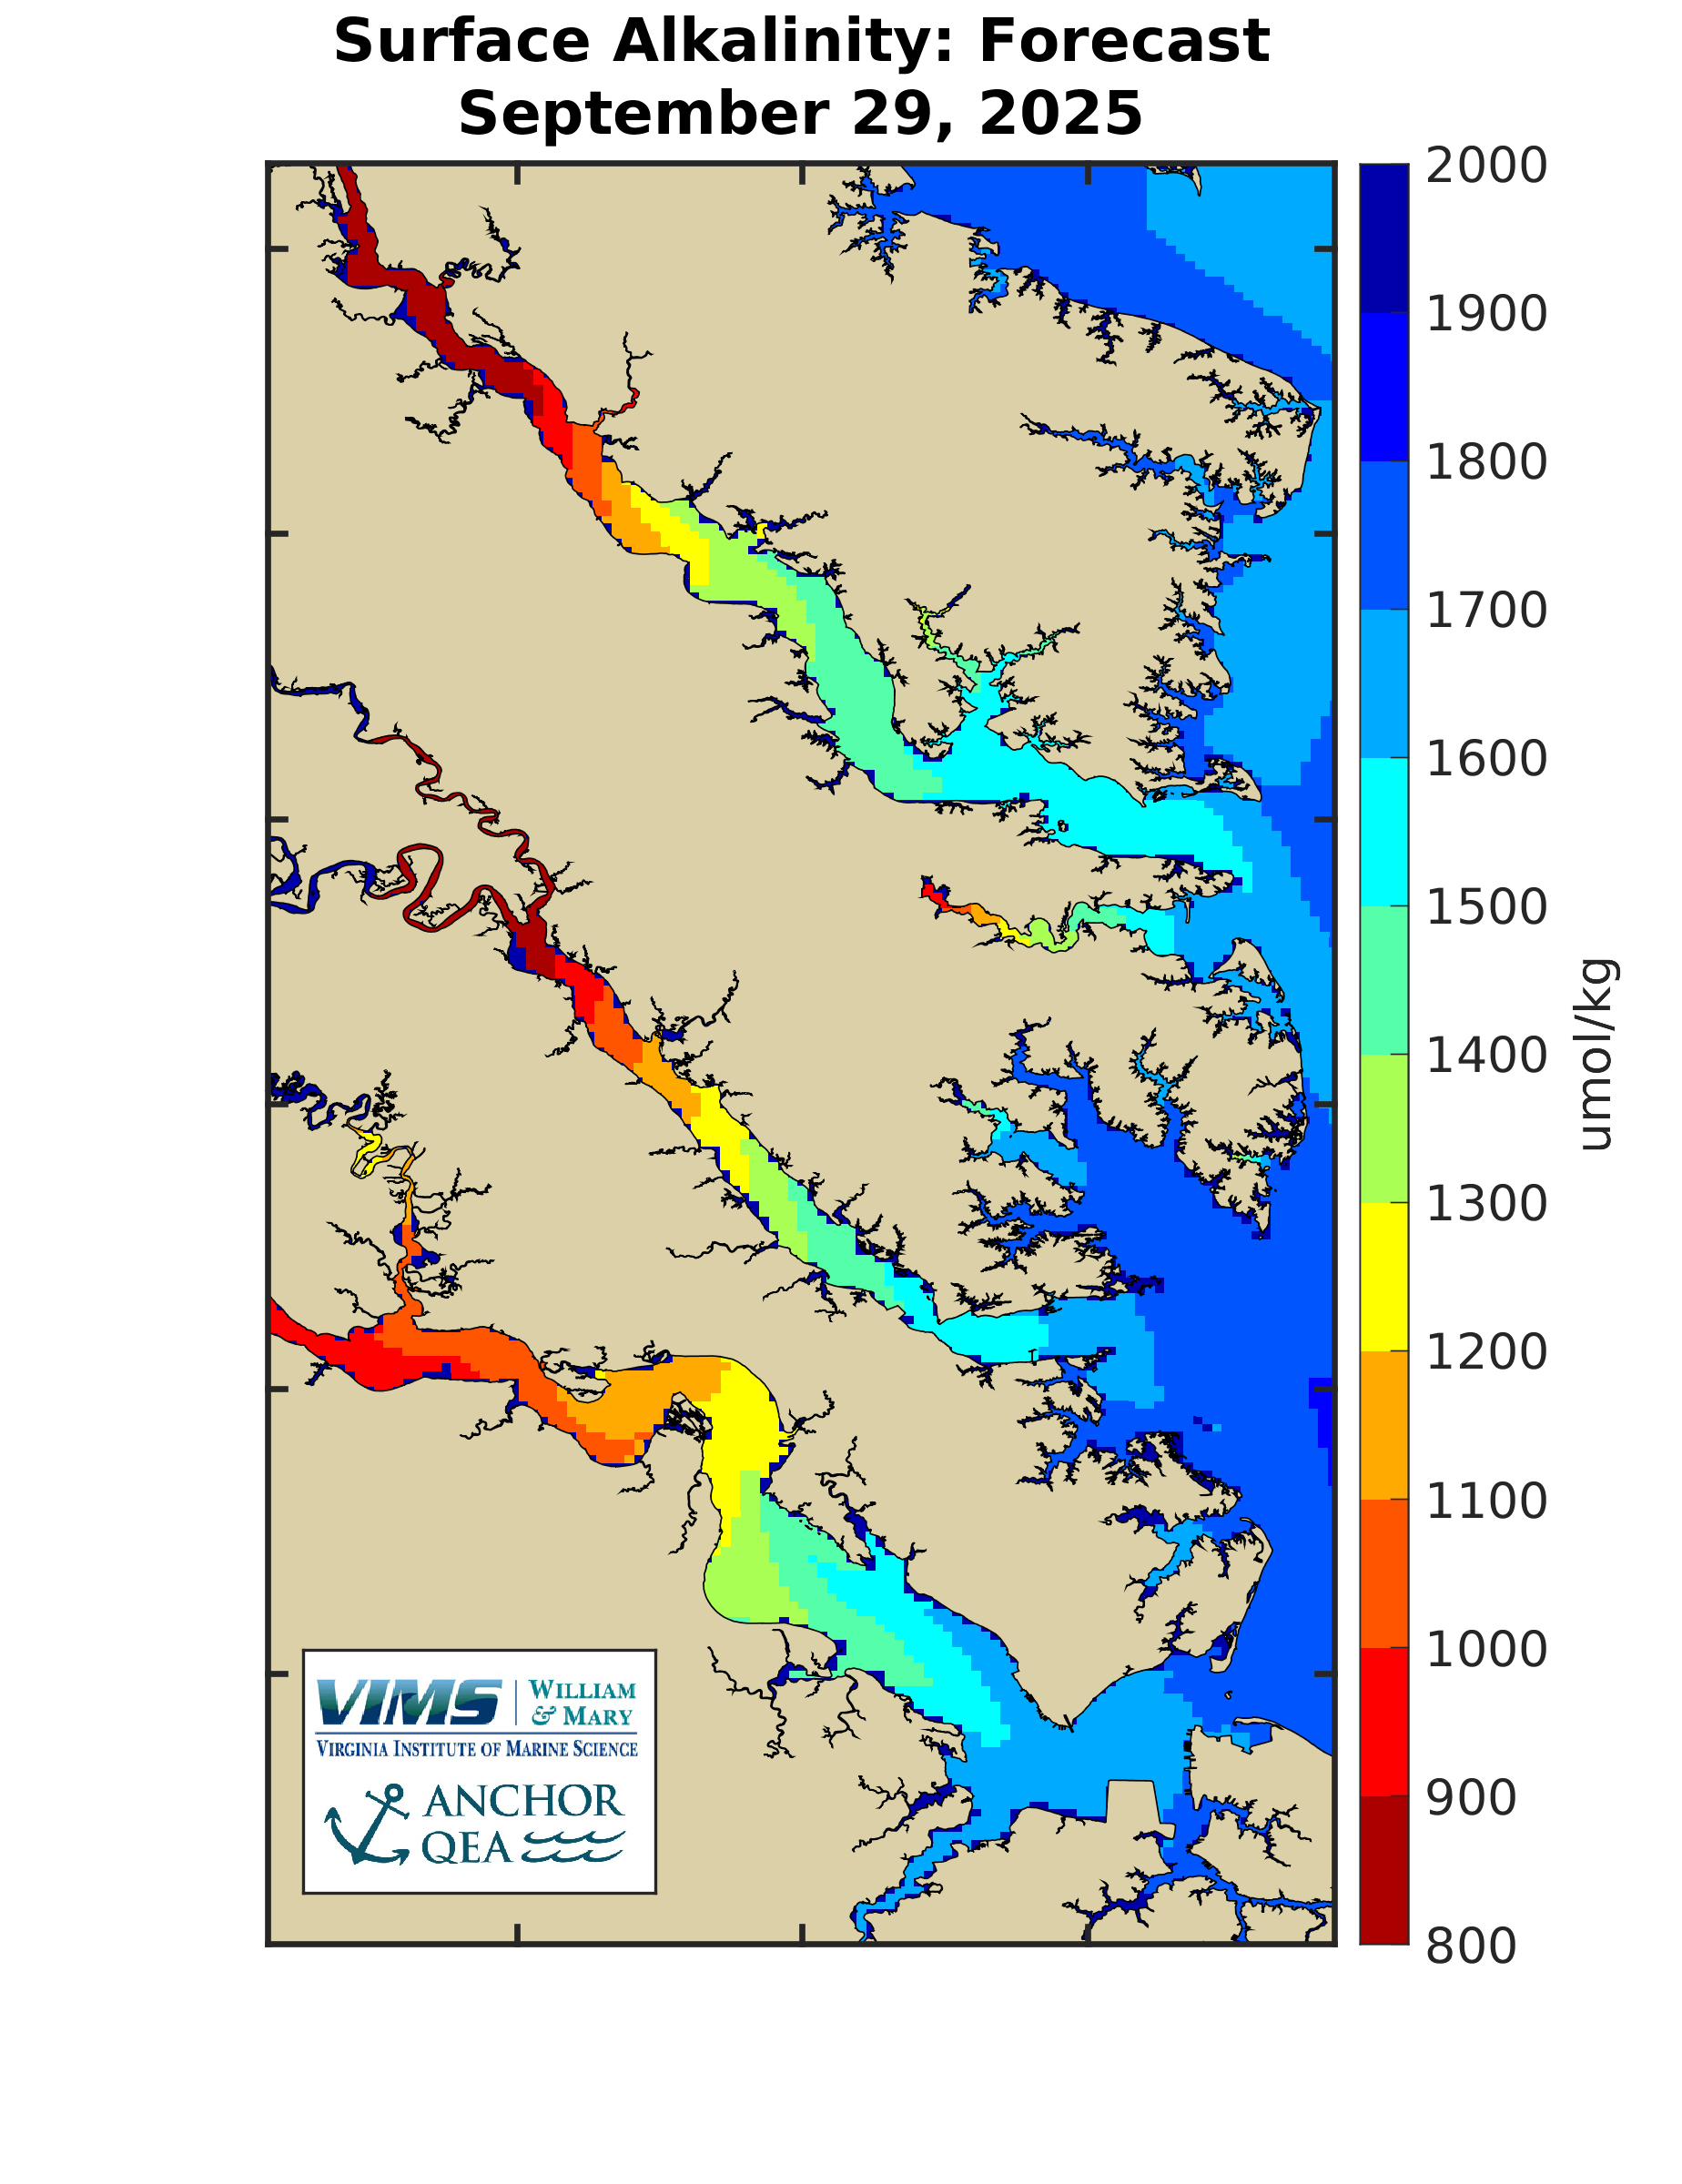
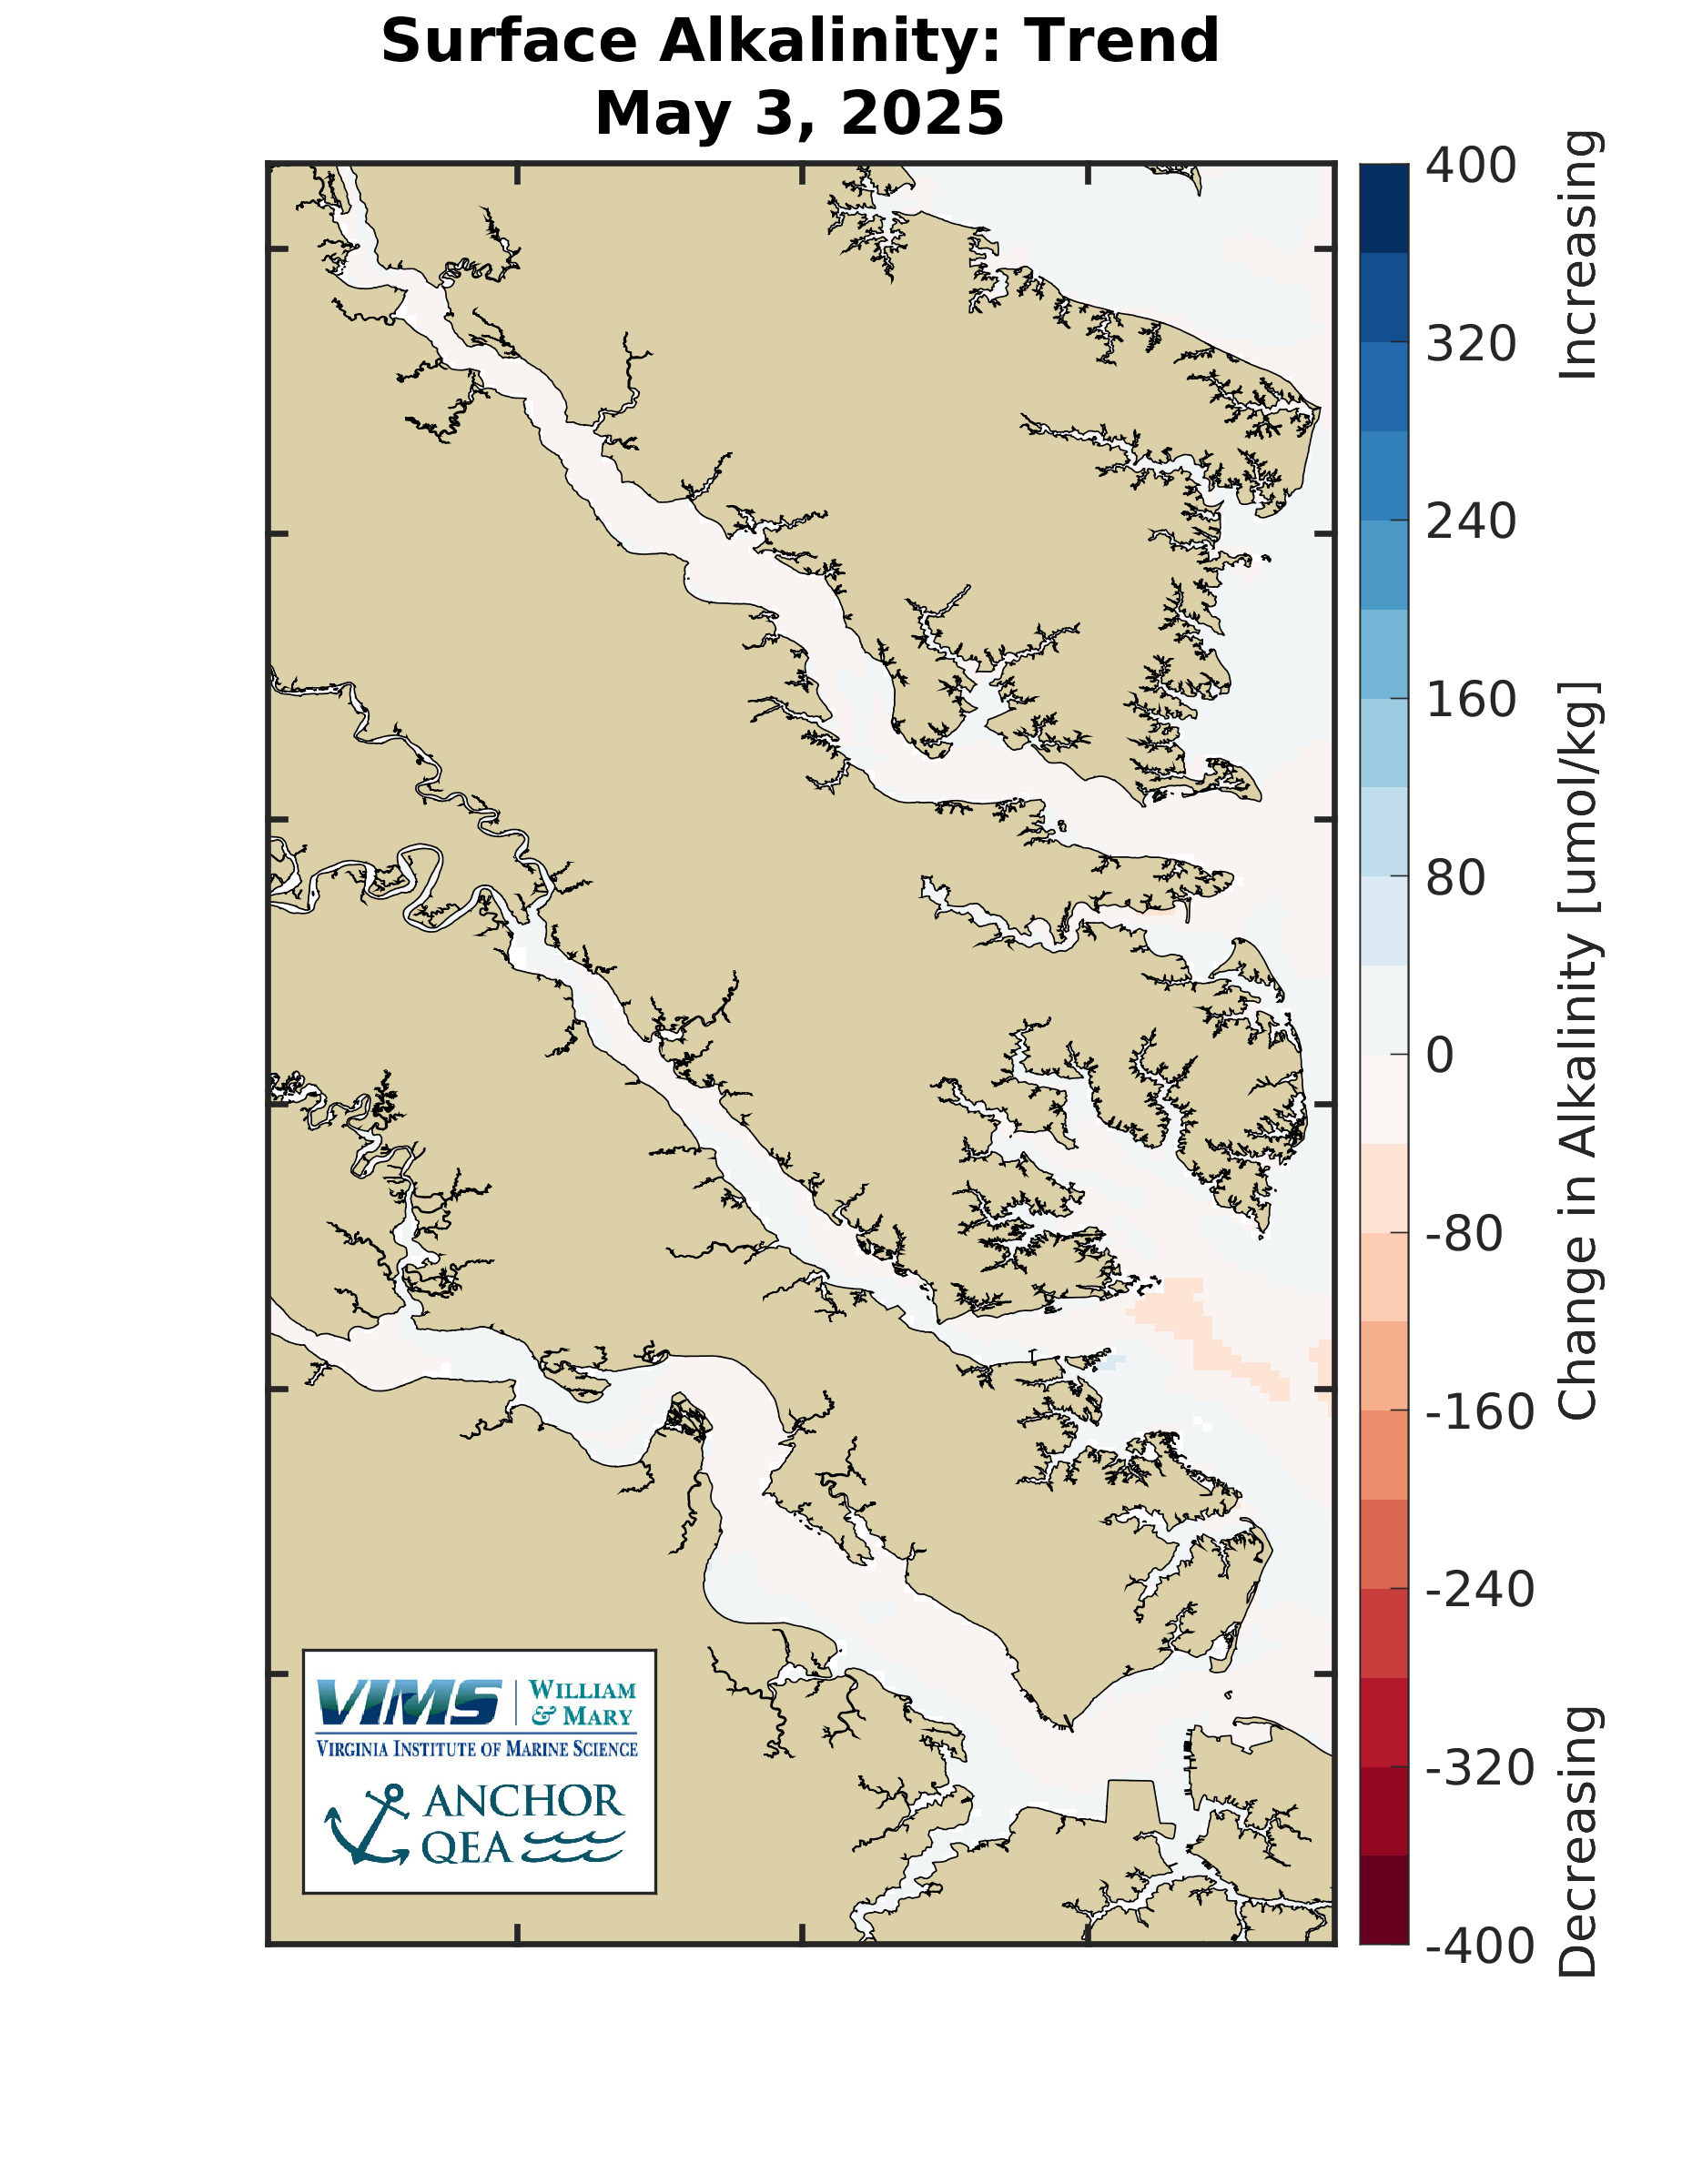
Alkalinity - Surface Maps
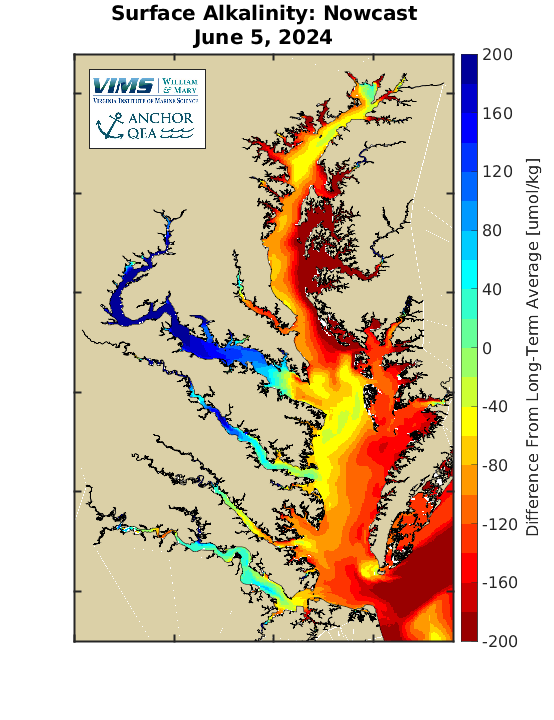
Difference From Long-Term AverageCurrent conditions are compared to the long-term average conditions to put current conditions in perspective relative to average conditions. Long-term average conditions were calculated using a computer model simulation spanning 1985 through 2023. The below map shows the difference between current conditions and the long-term average conditions on the day noted.For more information on the long-term averages please see the Chesapeake Atlas.
|
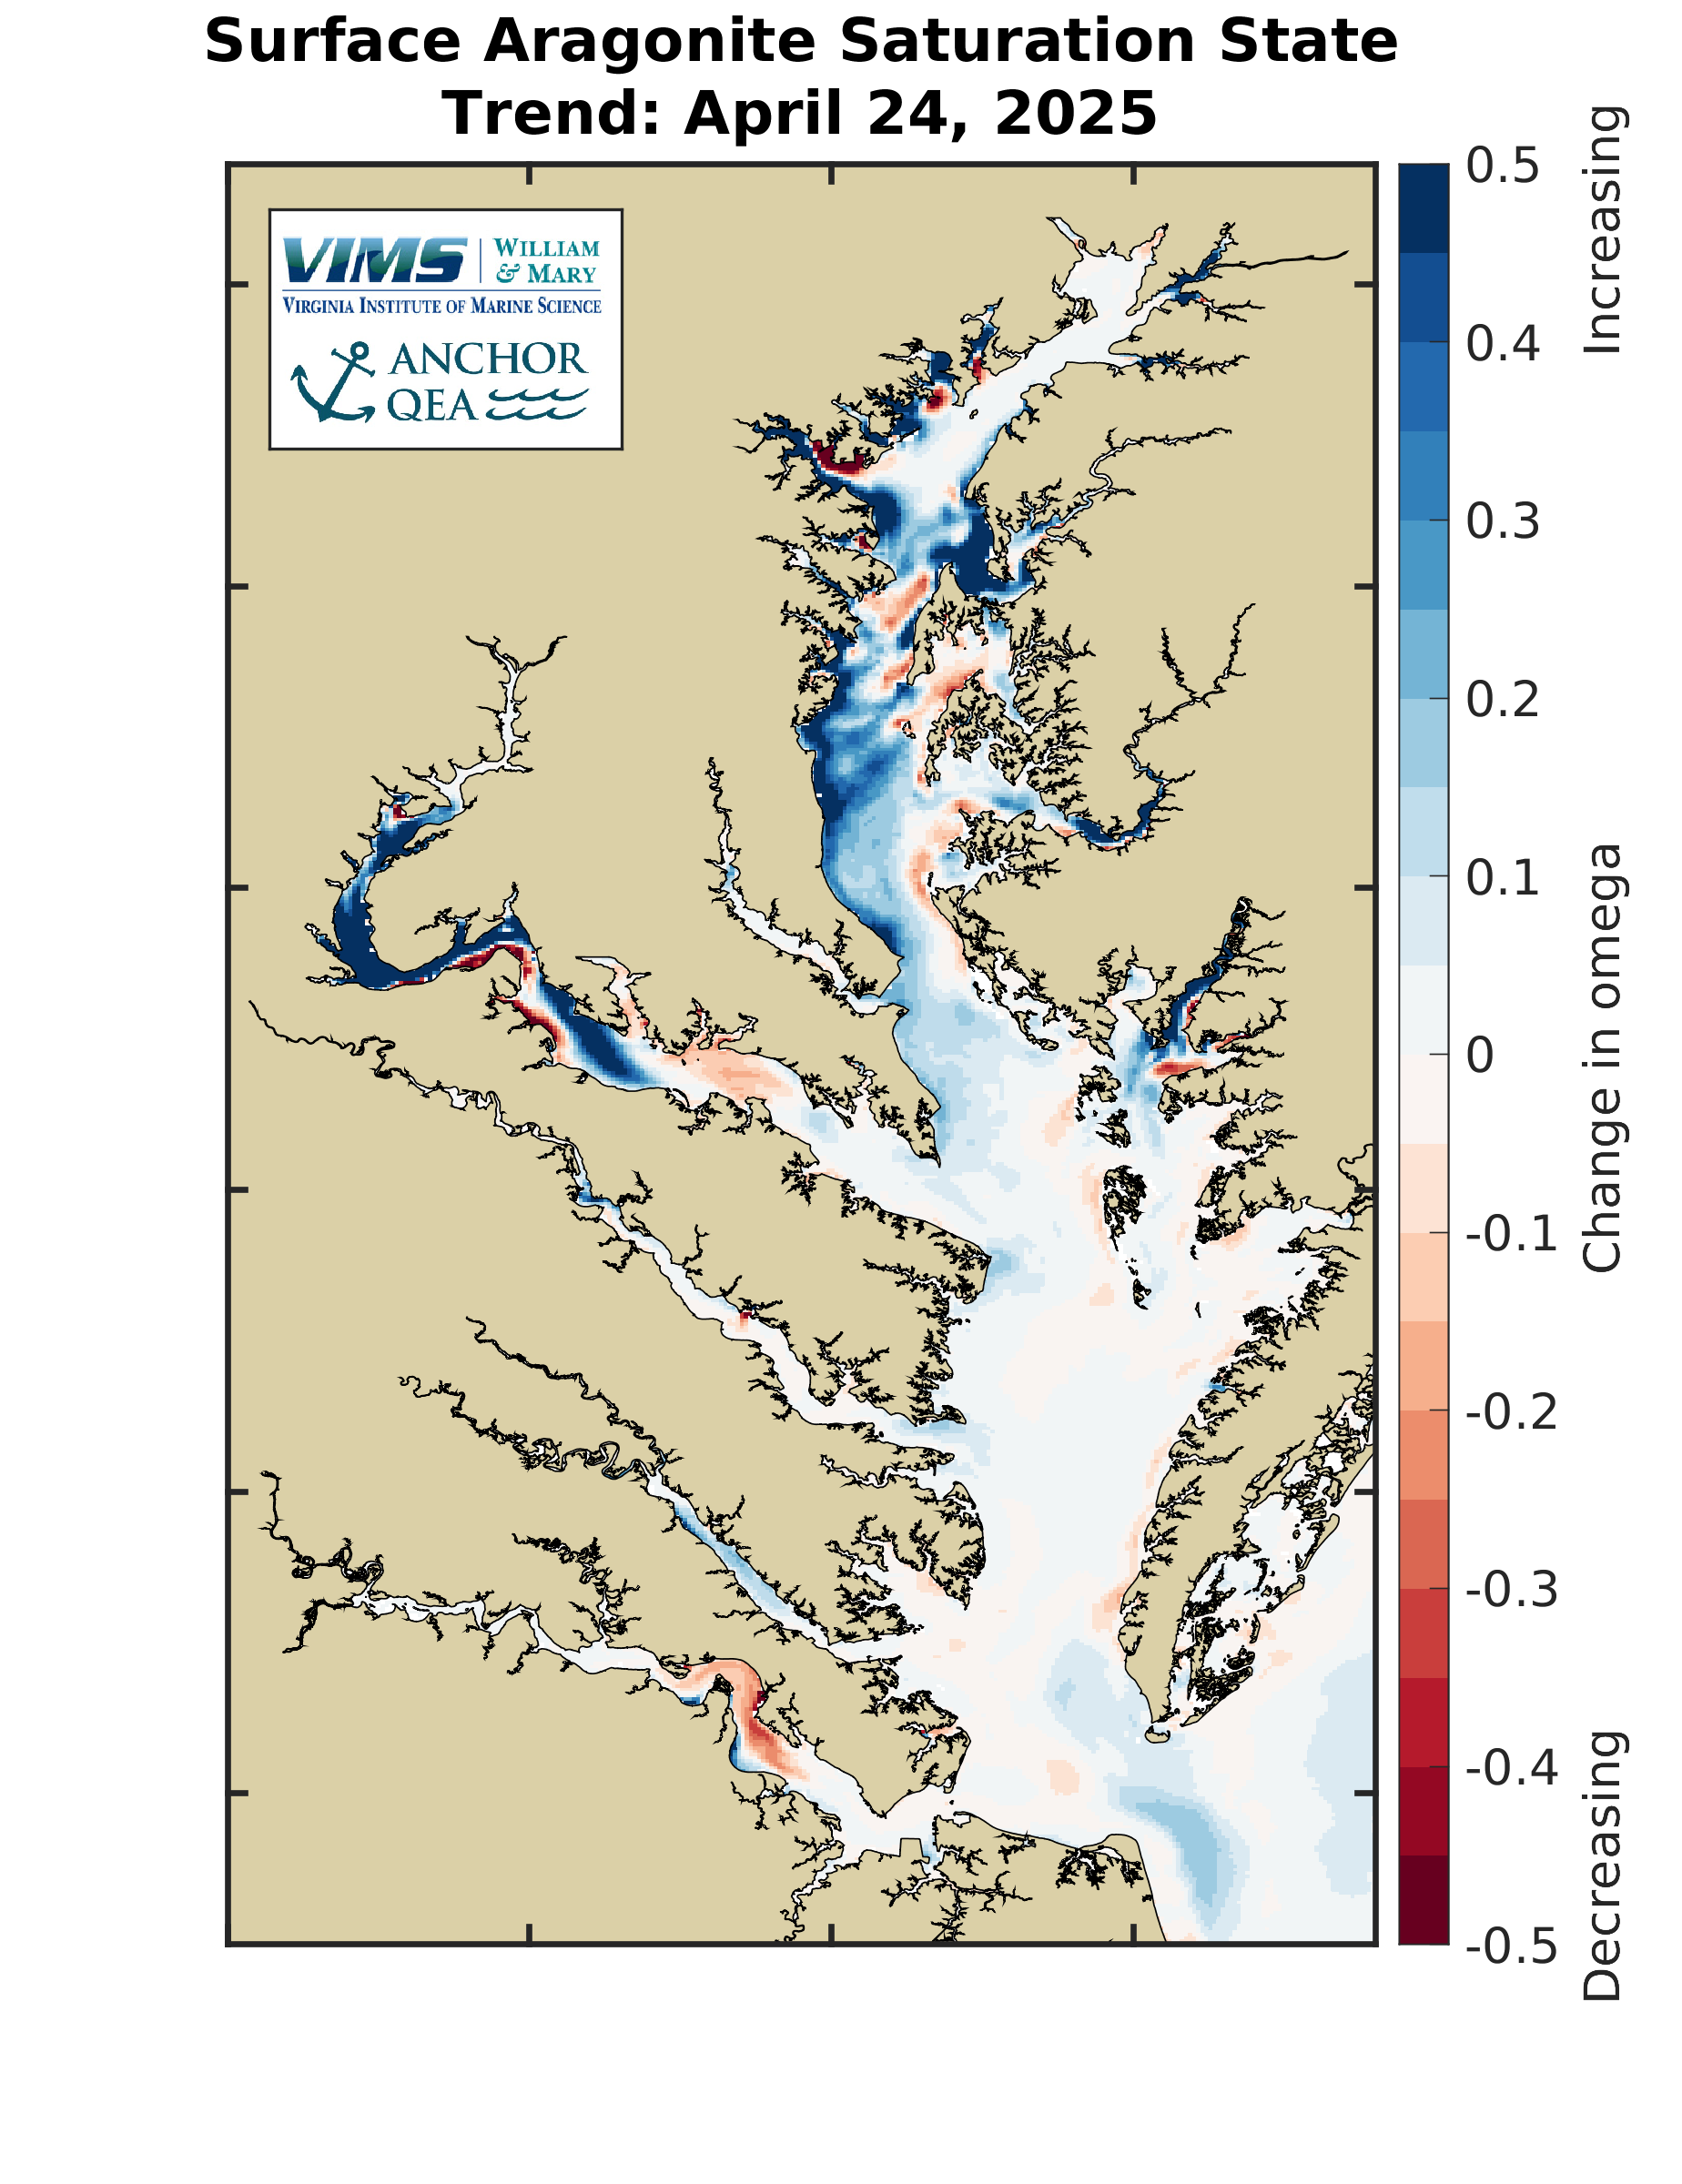
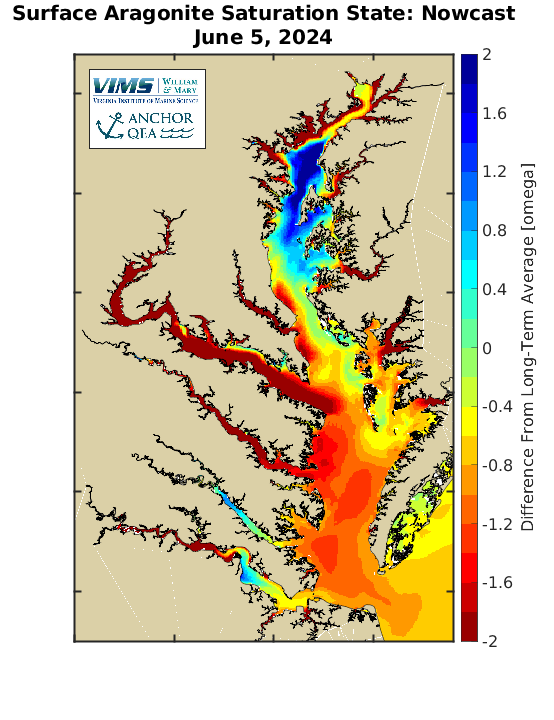
Aragonite Saturation State (Omega) - Surface MapsNote: As part of an active research project, the aragonite saturation state (omega) from the forecast model is currently being improved. Please interpret with caution.
Difference From Long-Term AverageCurrent conditions are compared to the long-term average conditions to put current conditions in perspective relative to average conditions. Long-term average conditions were calculated using a computer model simulation spanning 1985 through 2023. The below map shows the difference between current conditions and the long-term average conditions on the day noted.For more information on the long-term averages please see the Chesapeake Atlas.
|
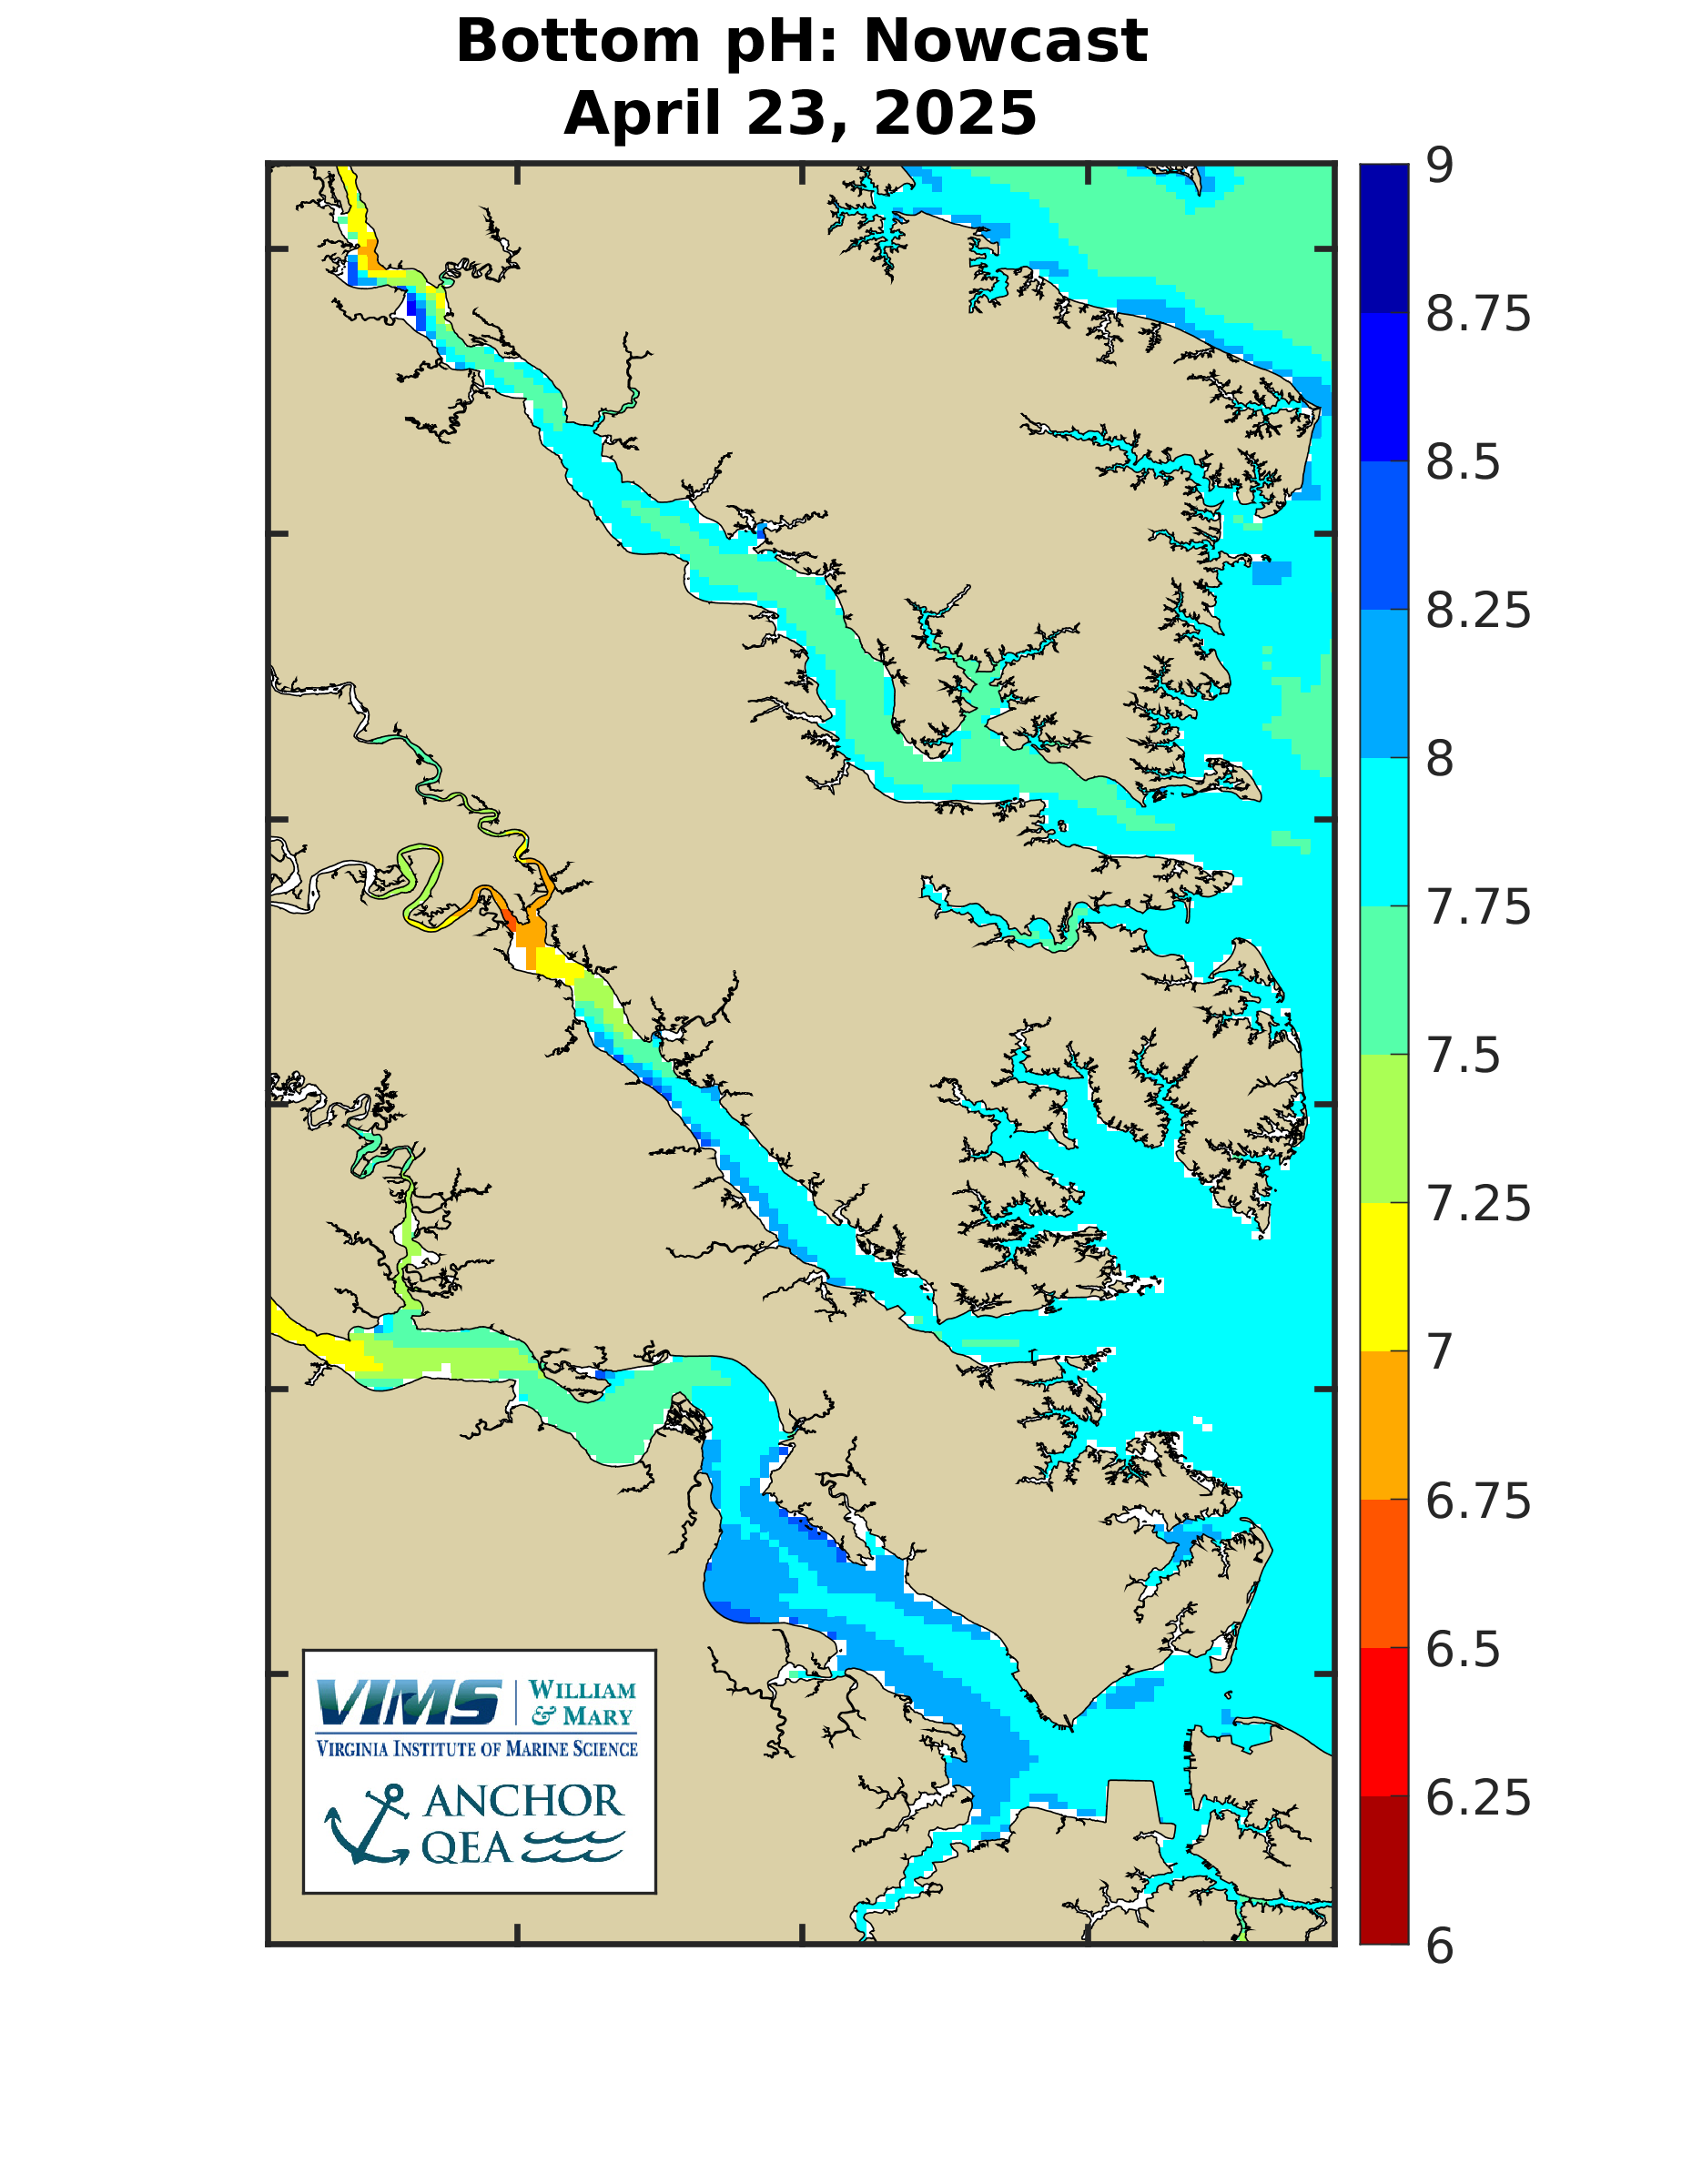
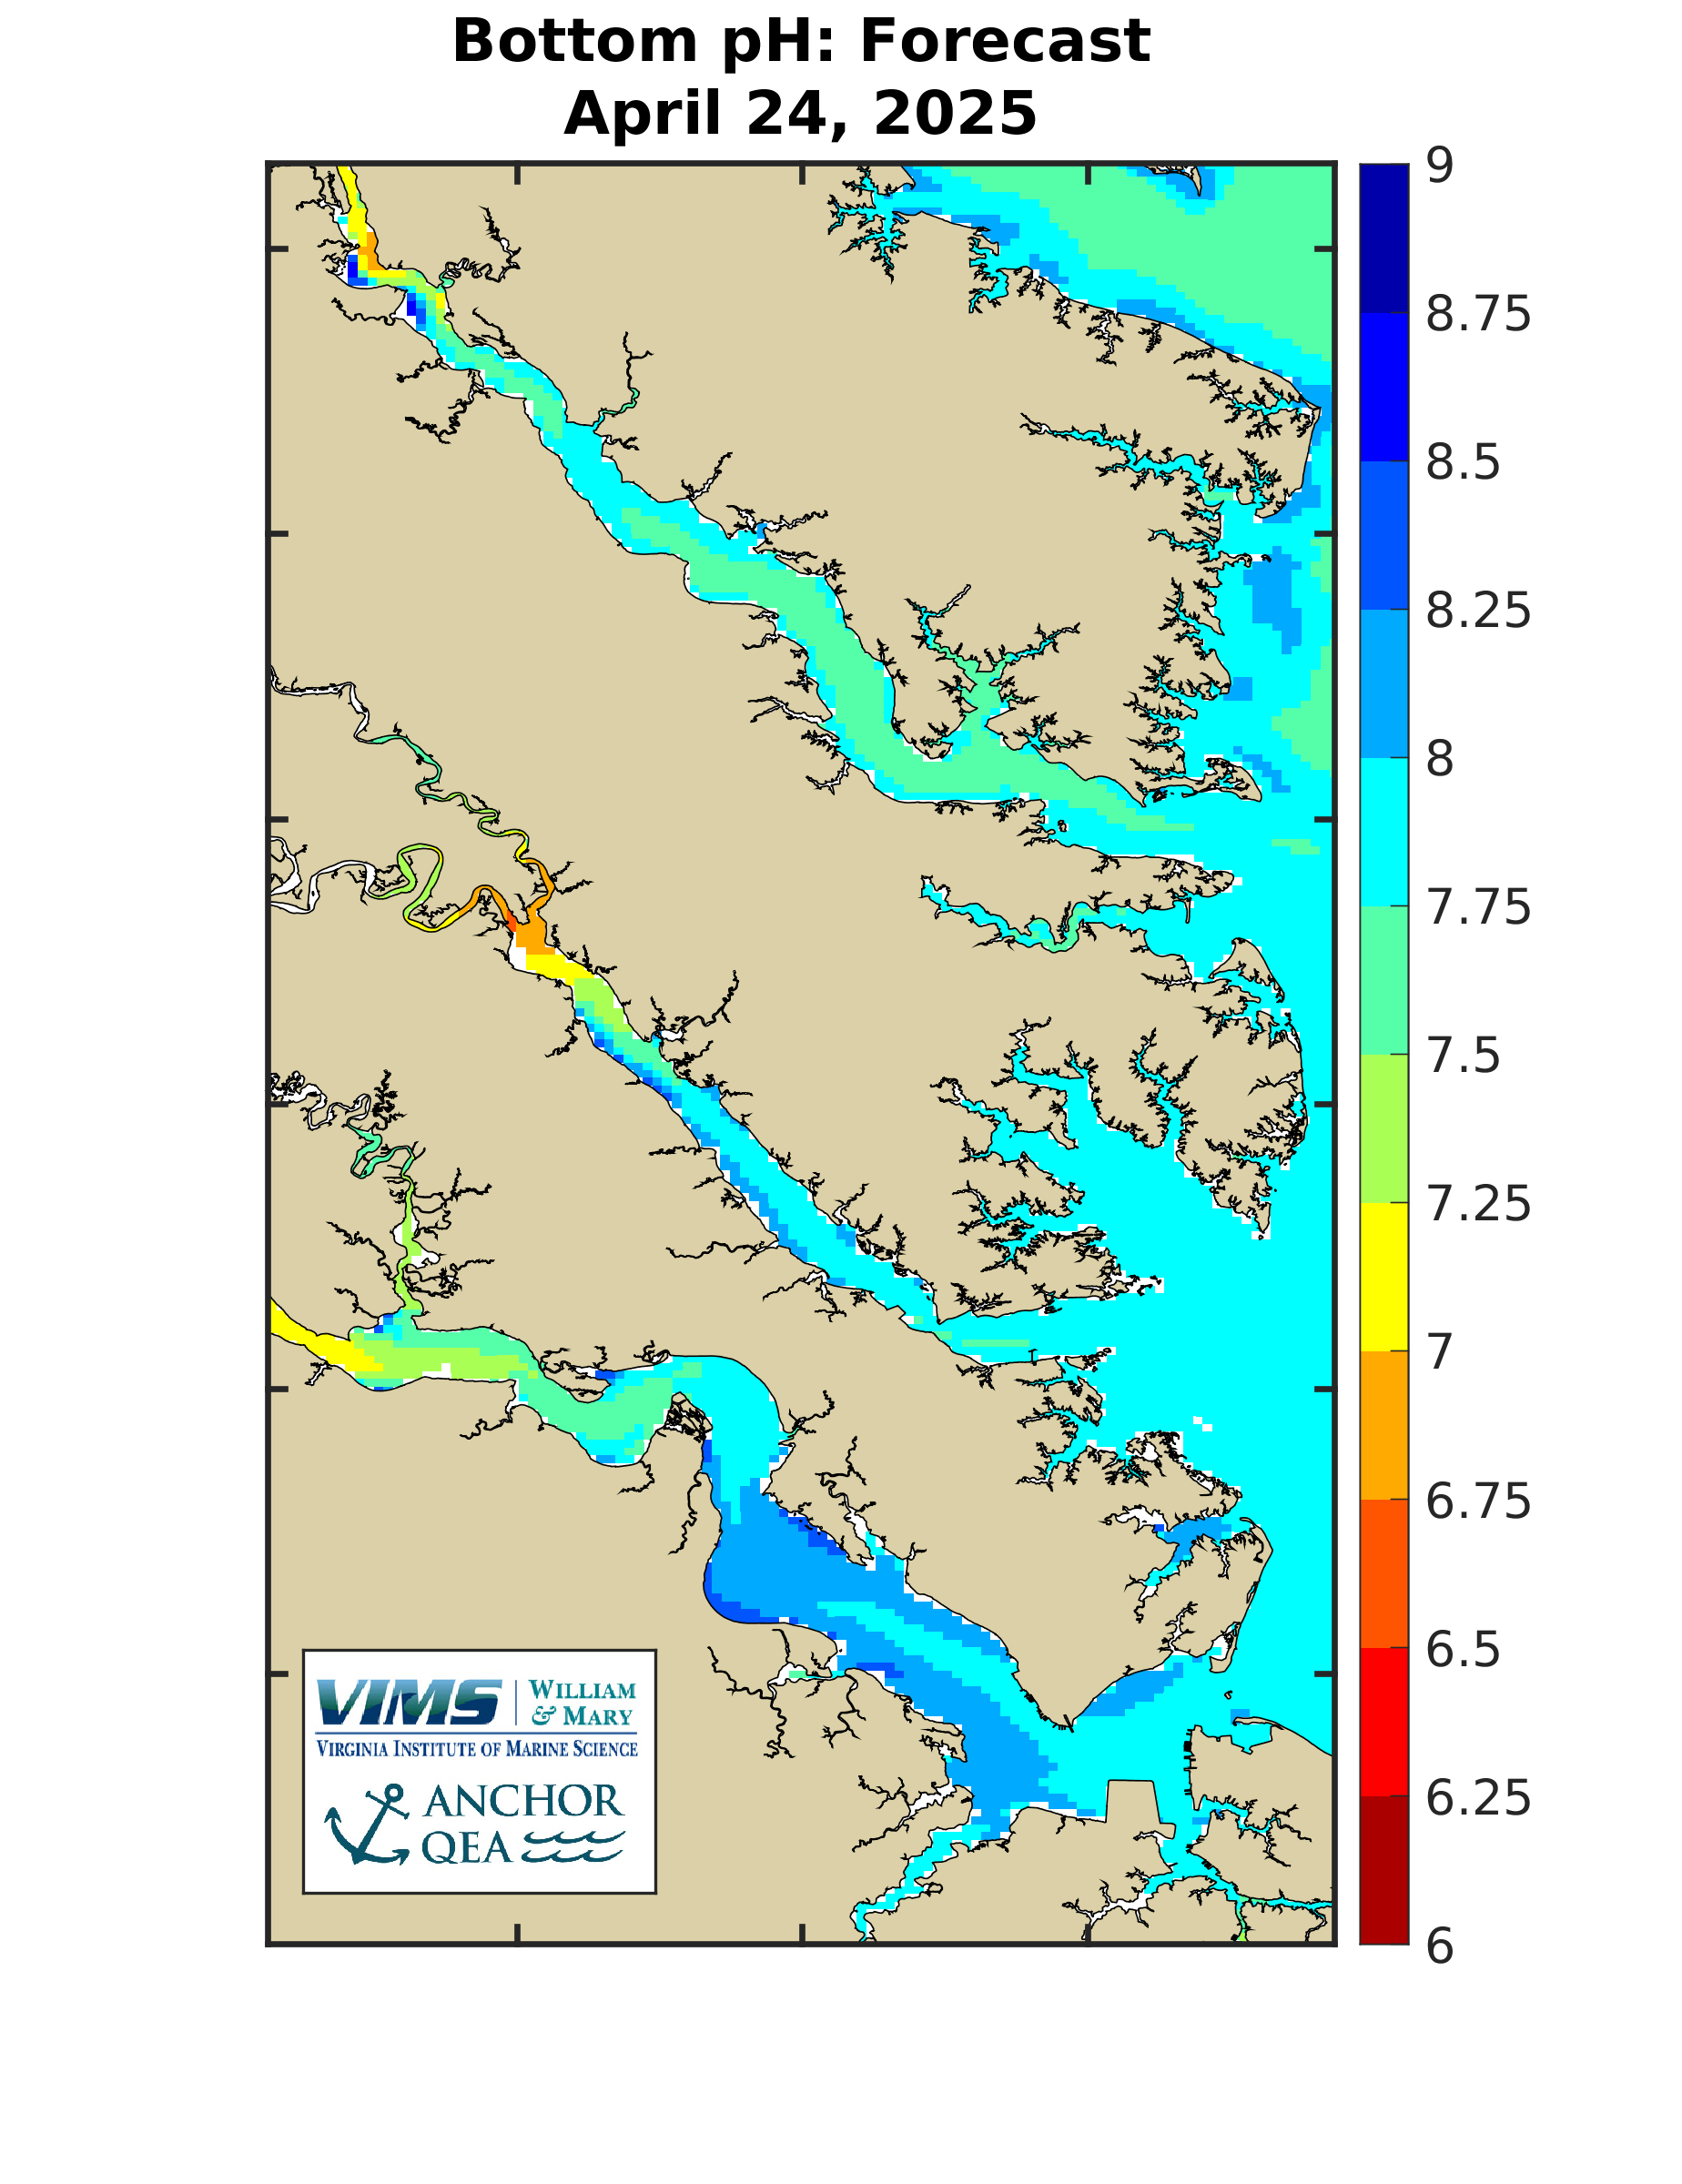
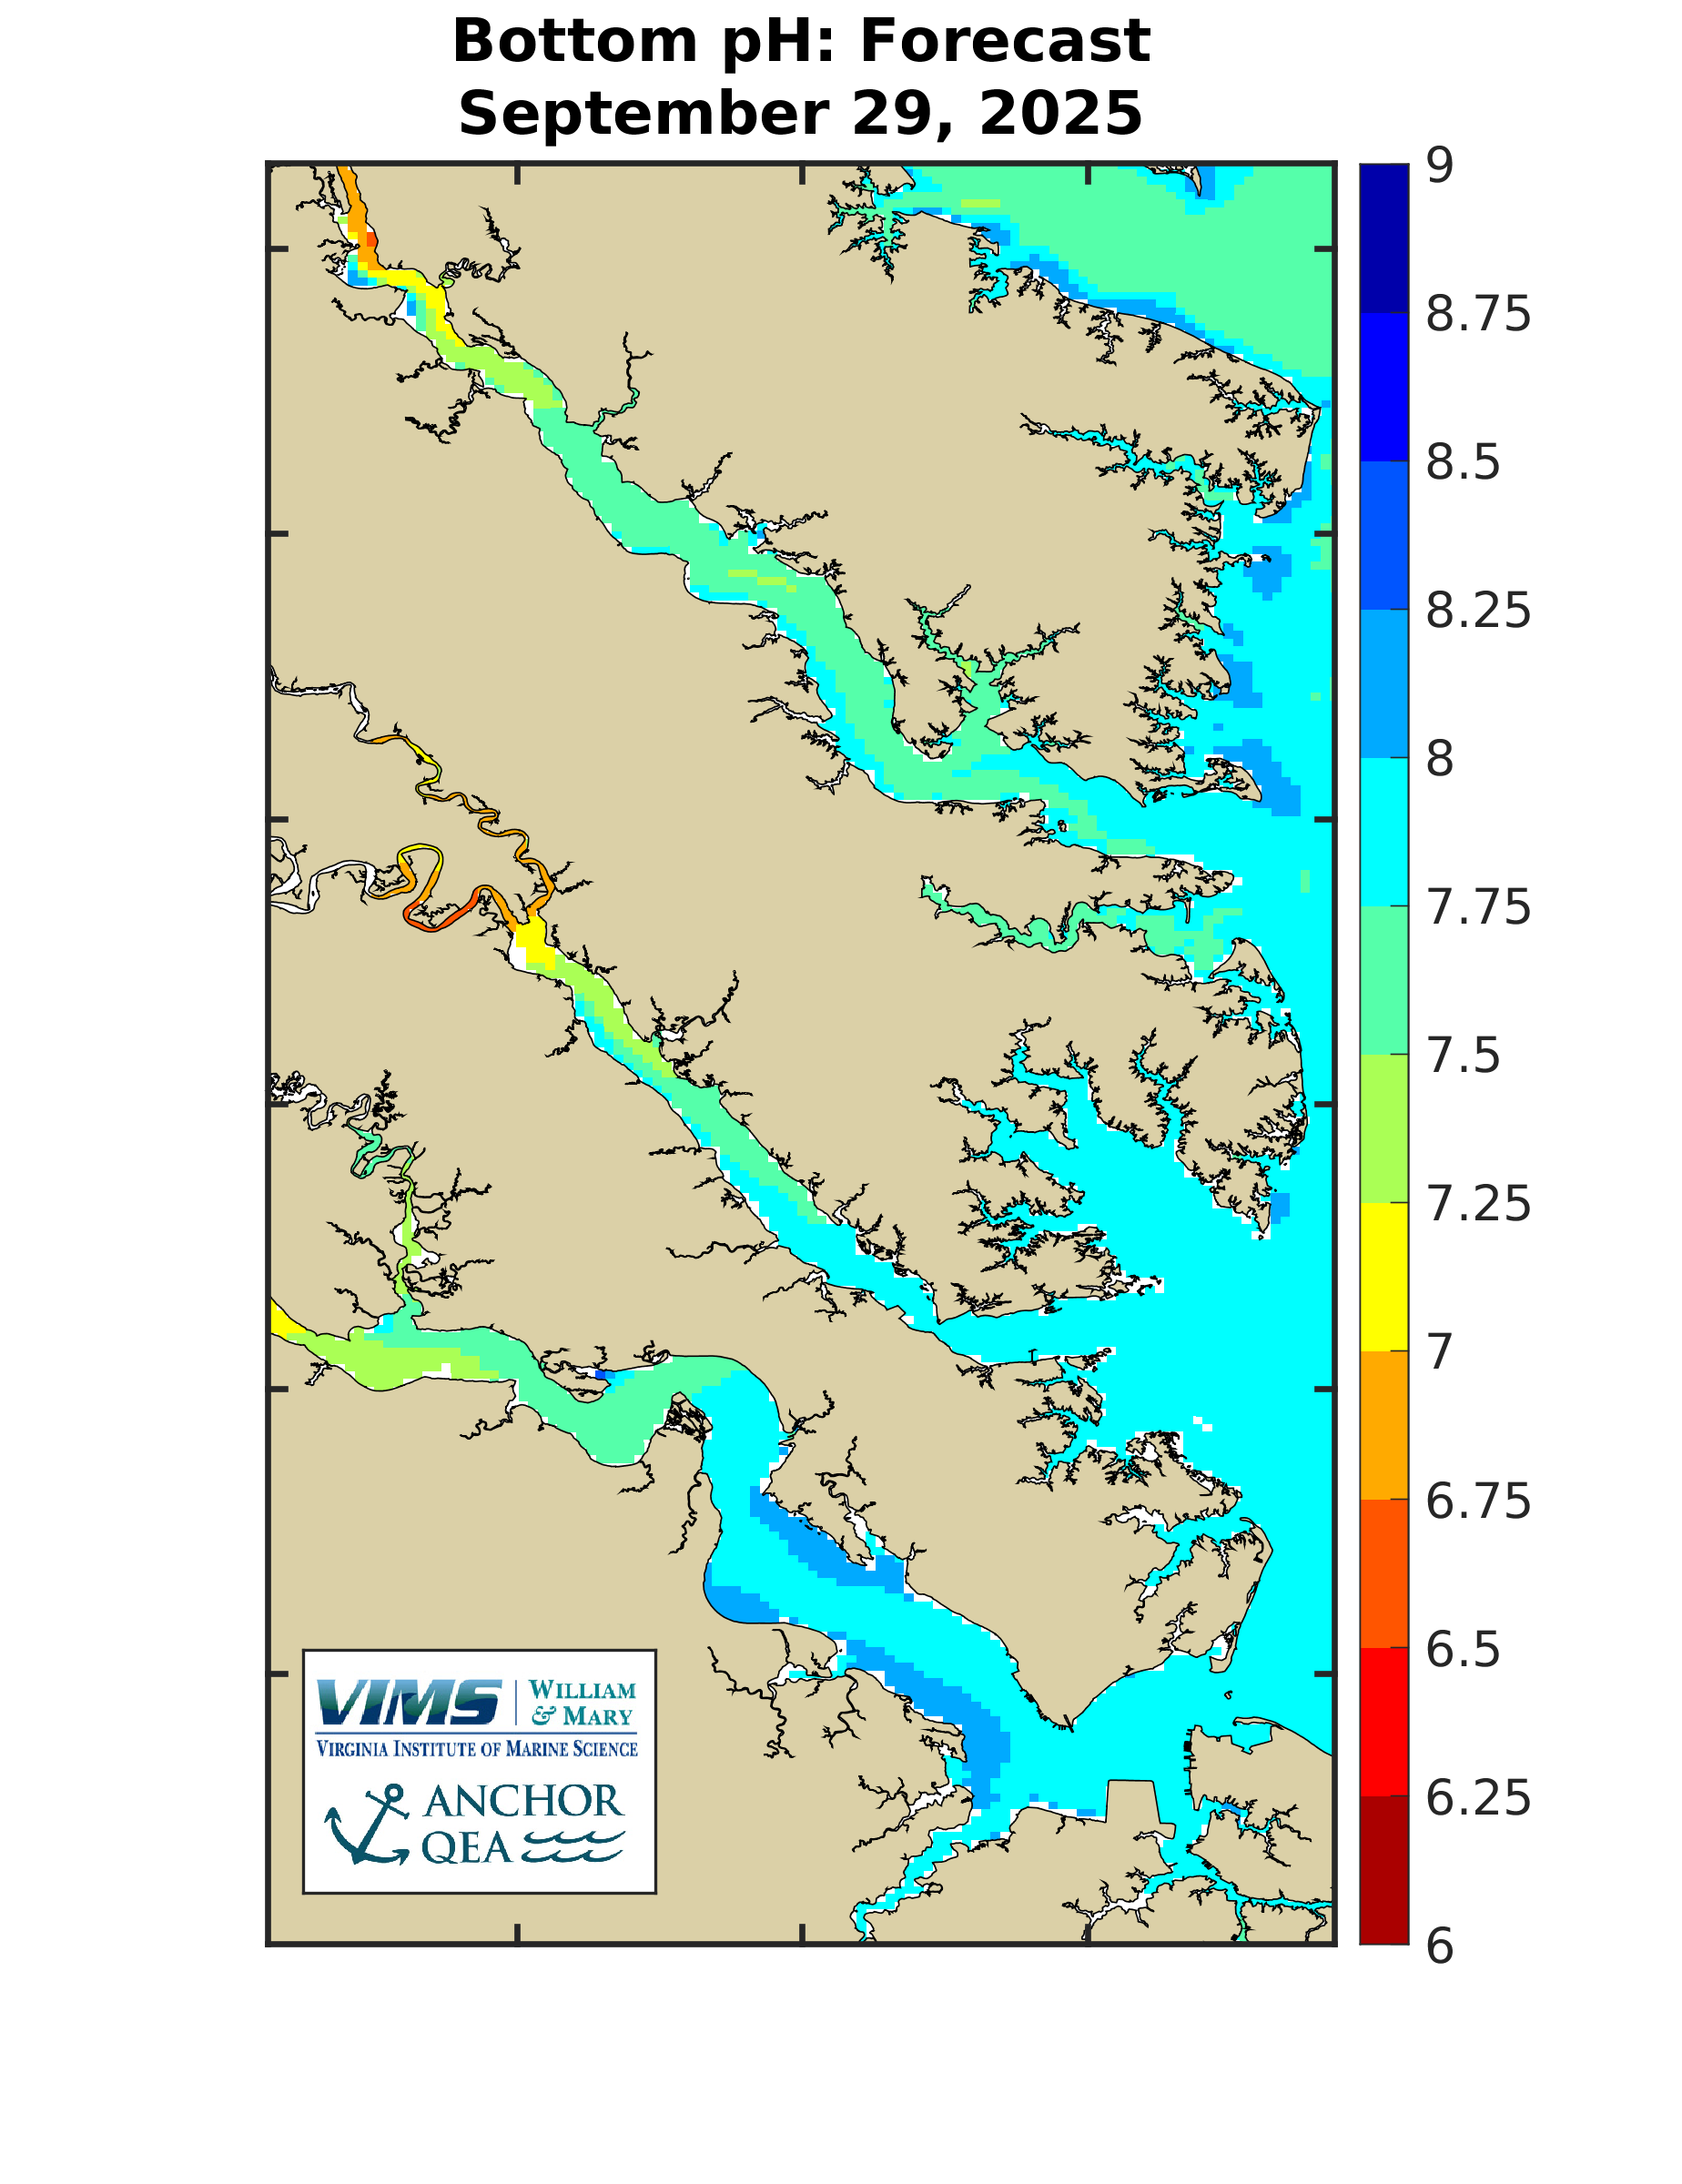
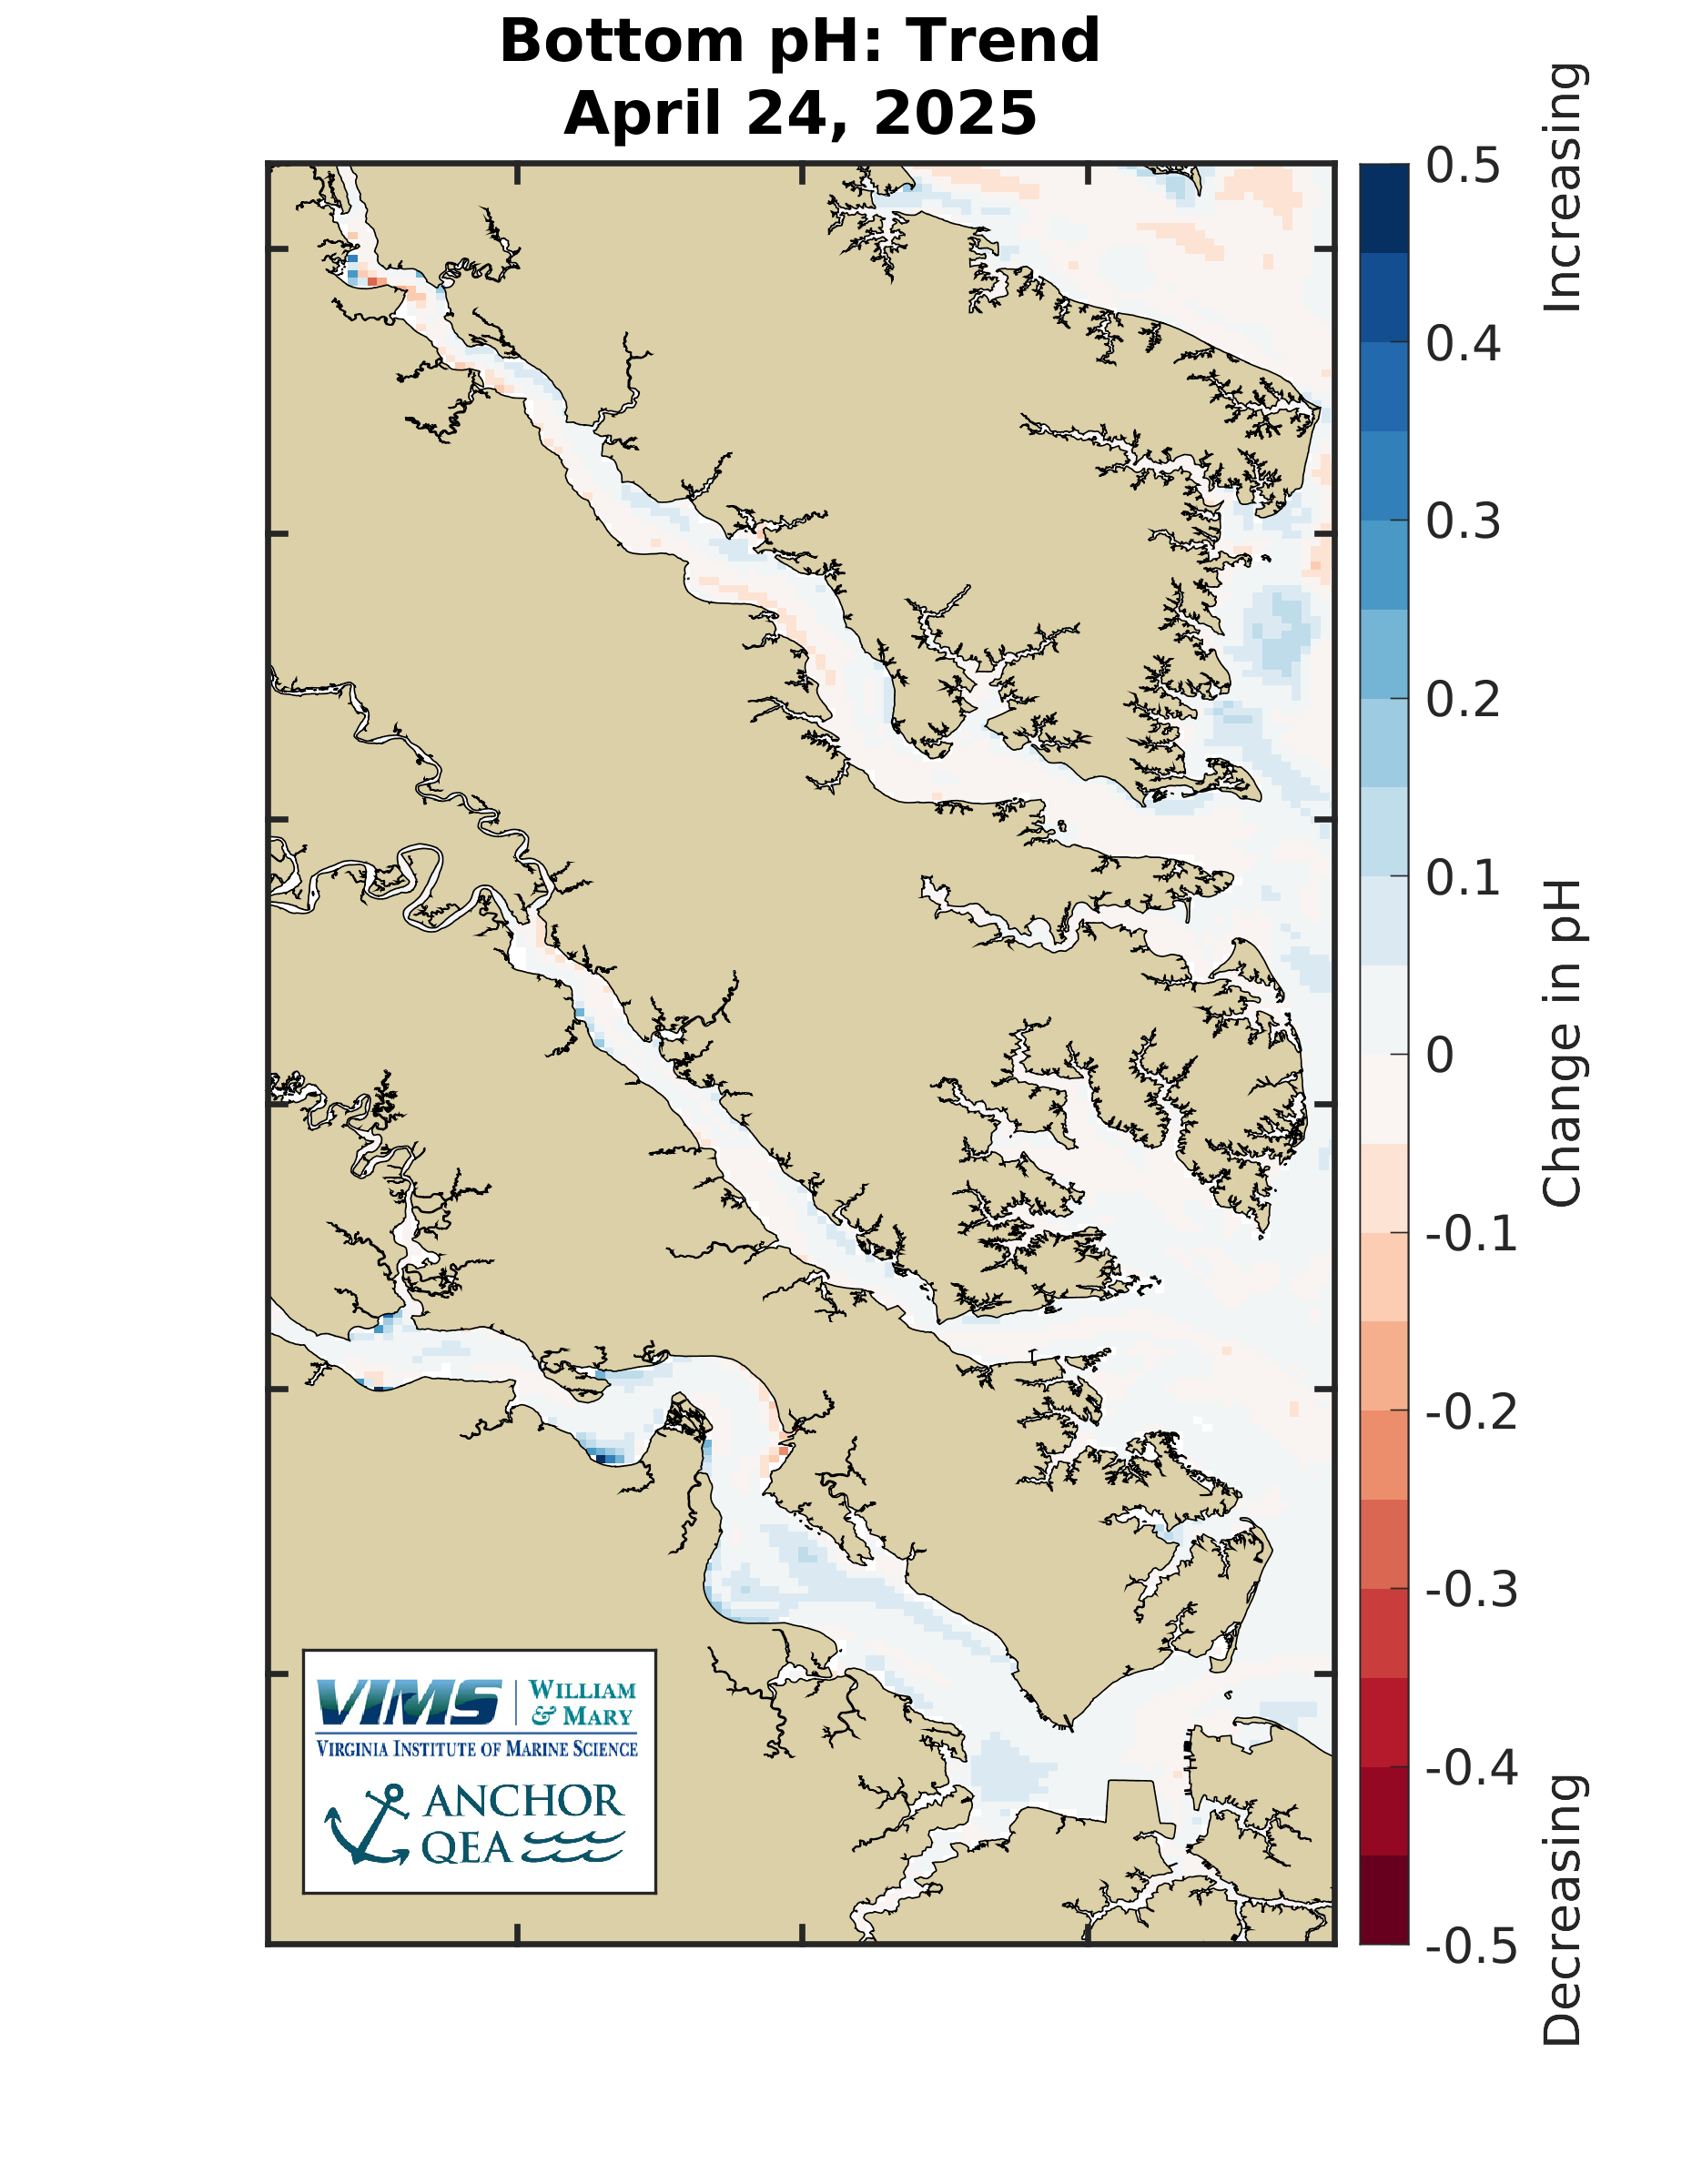
pH - Bottom Maps
|
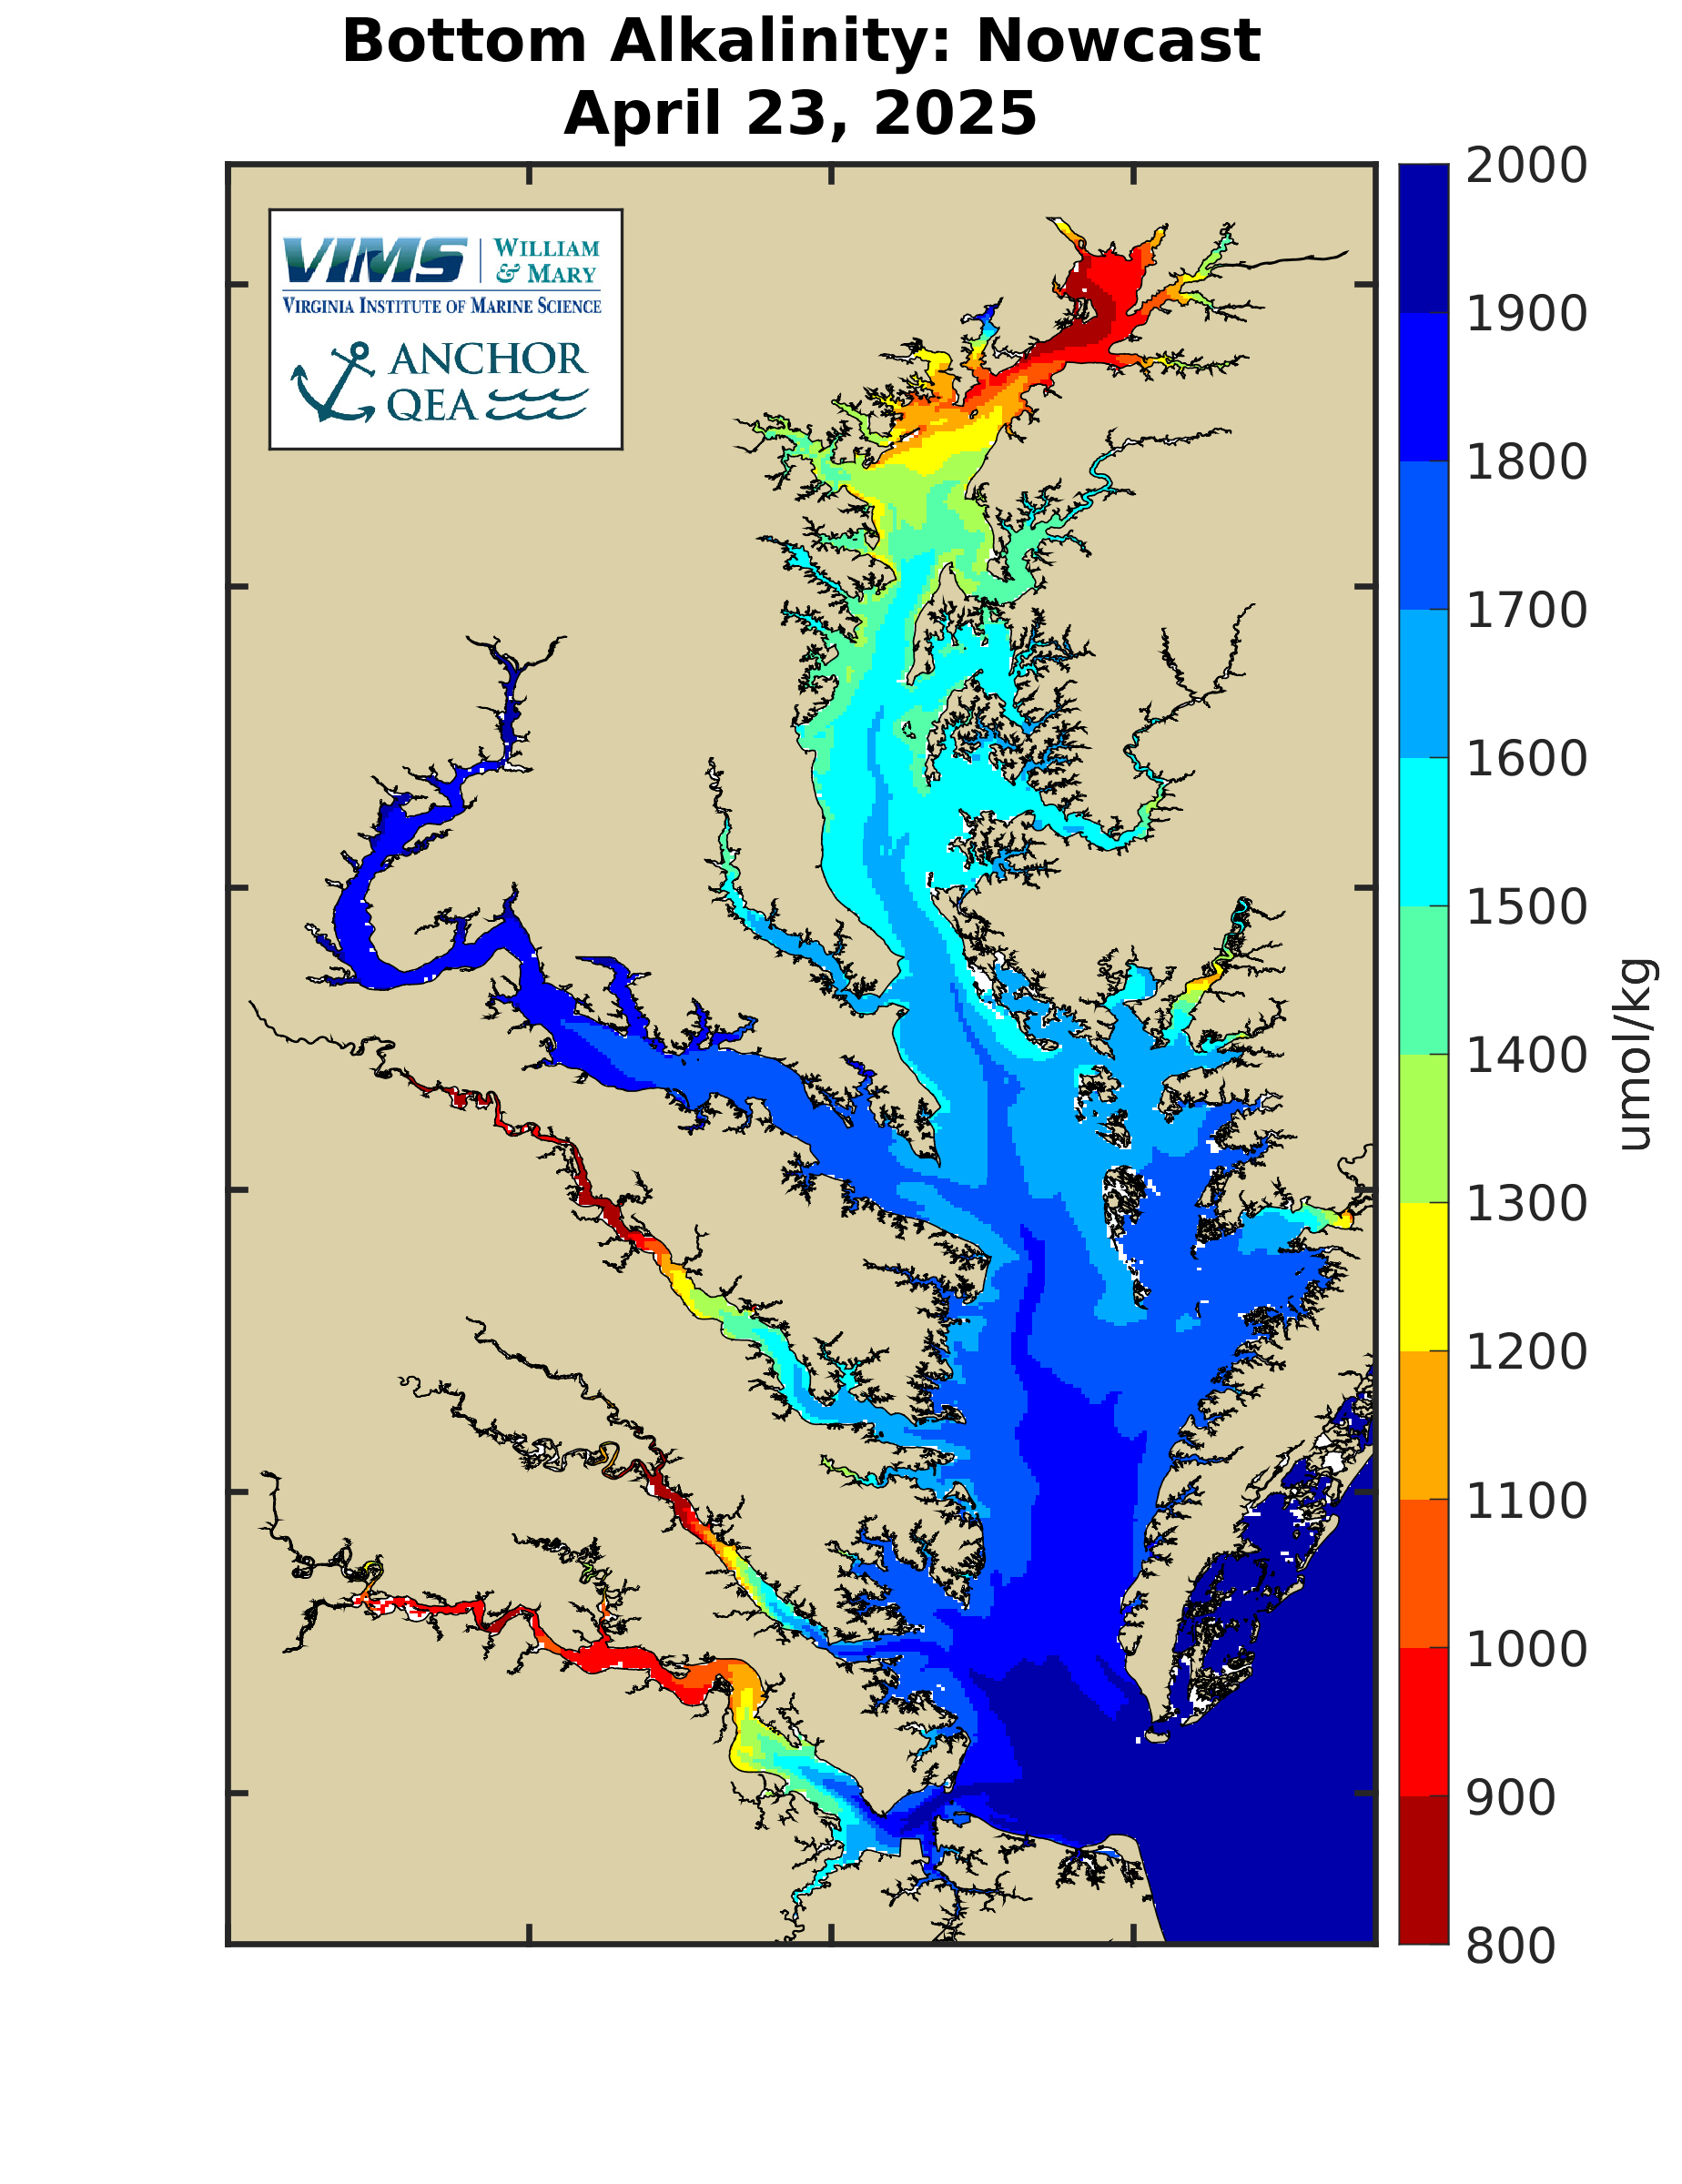
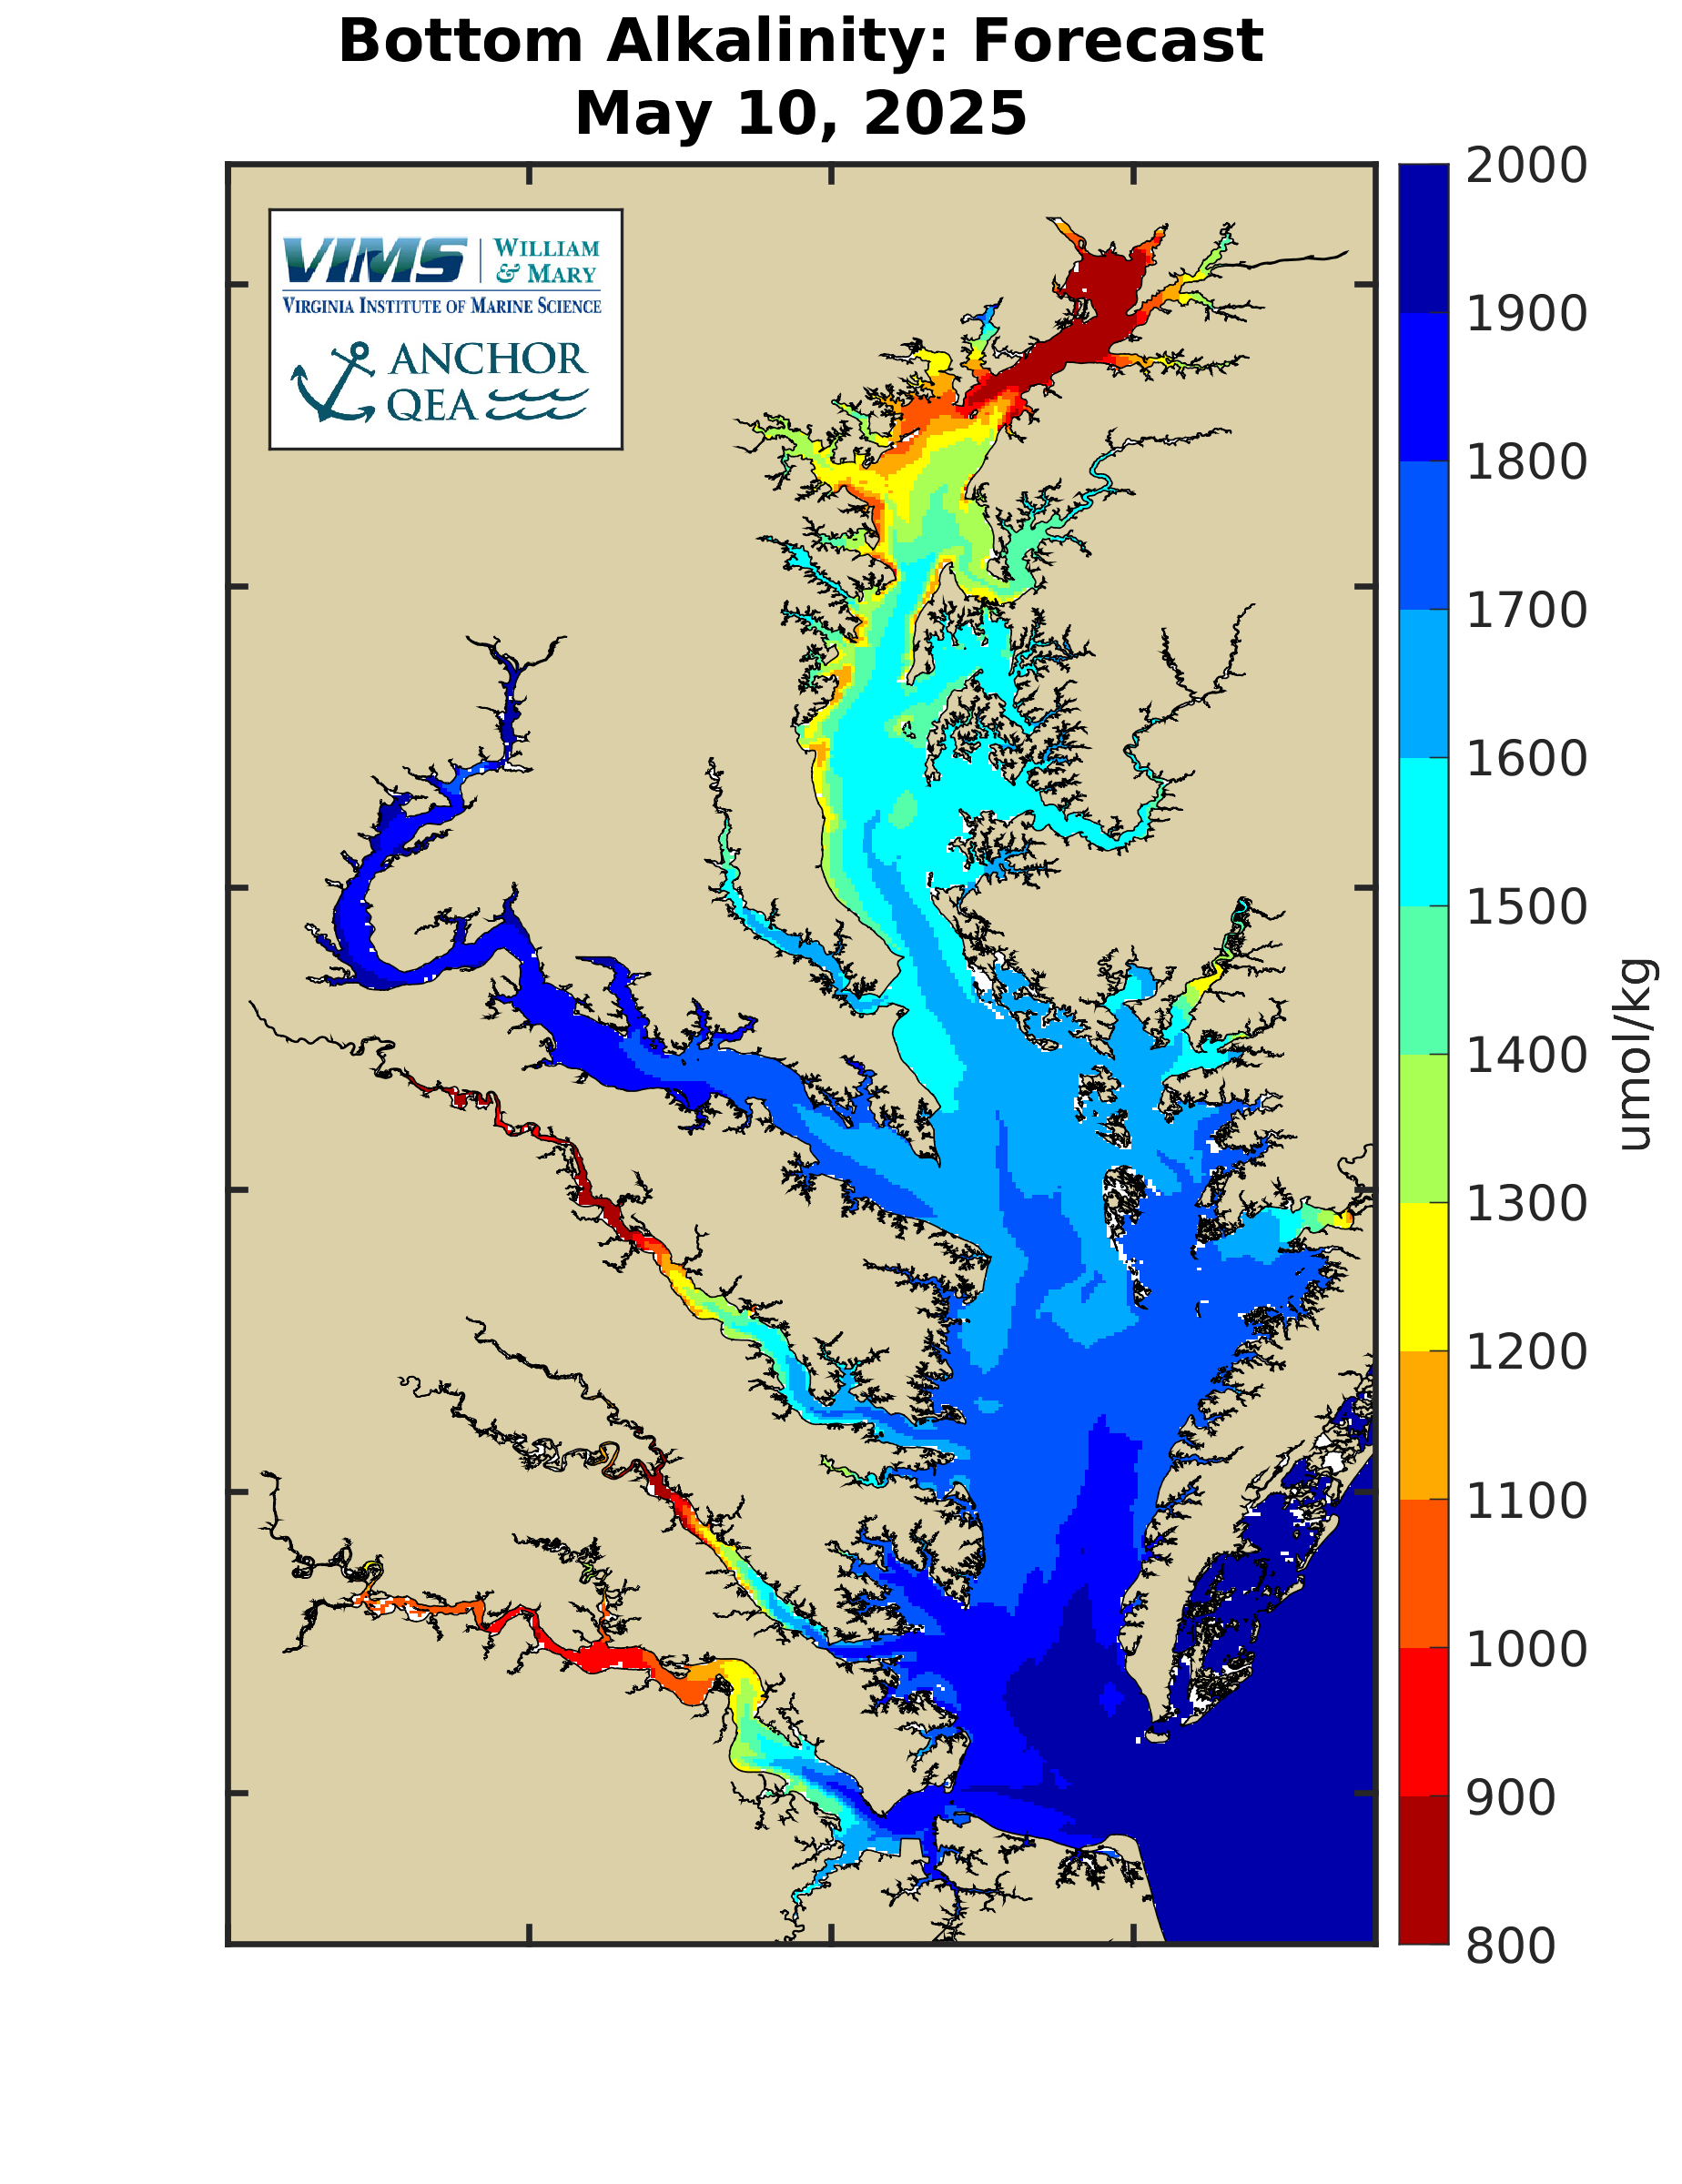
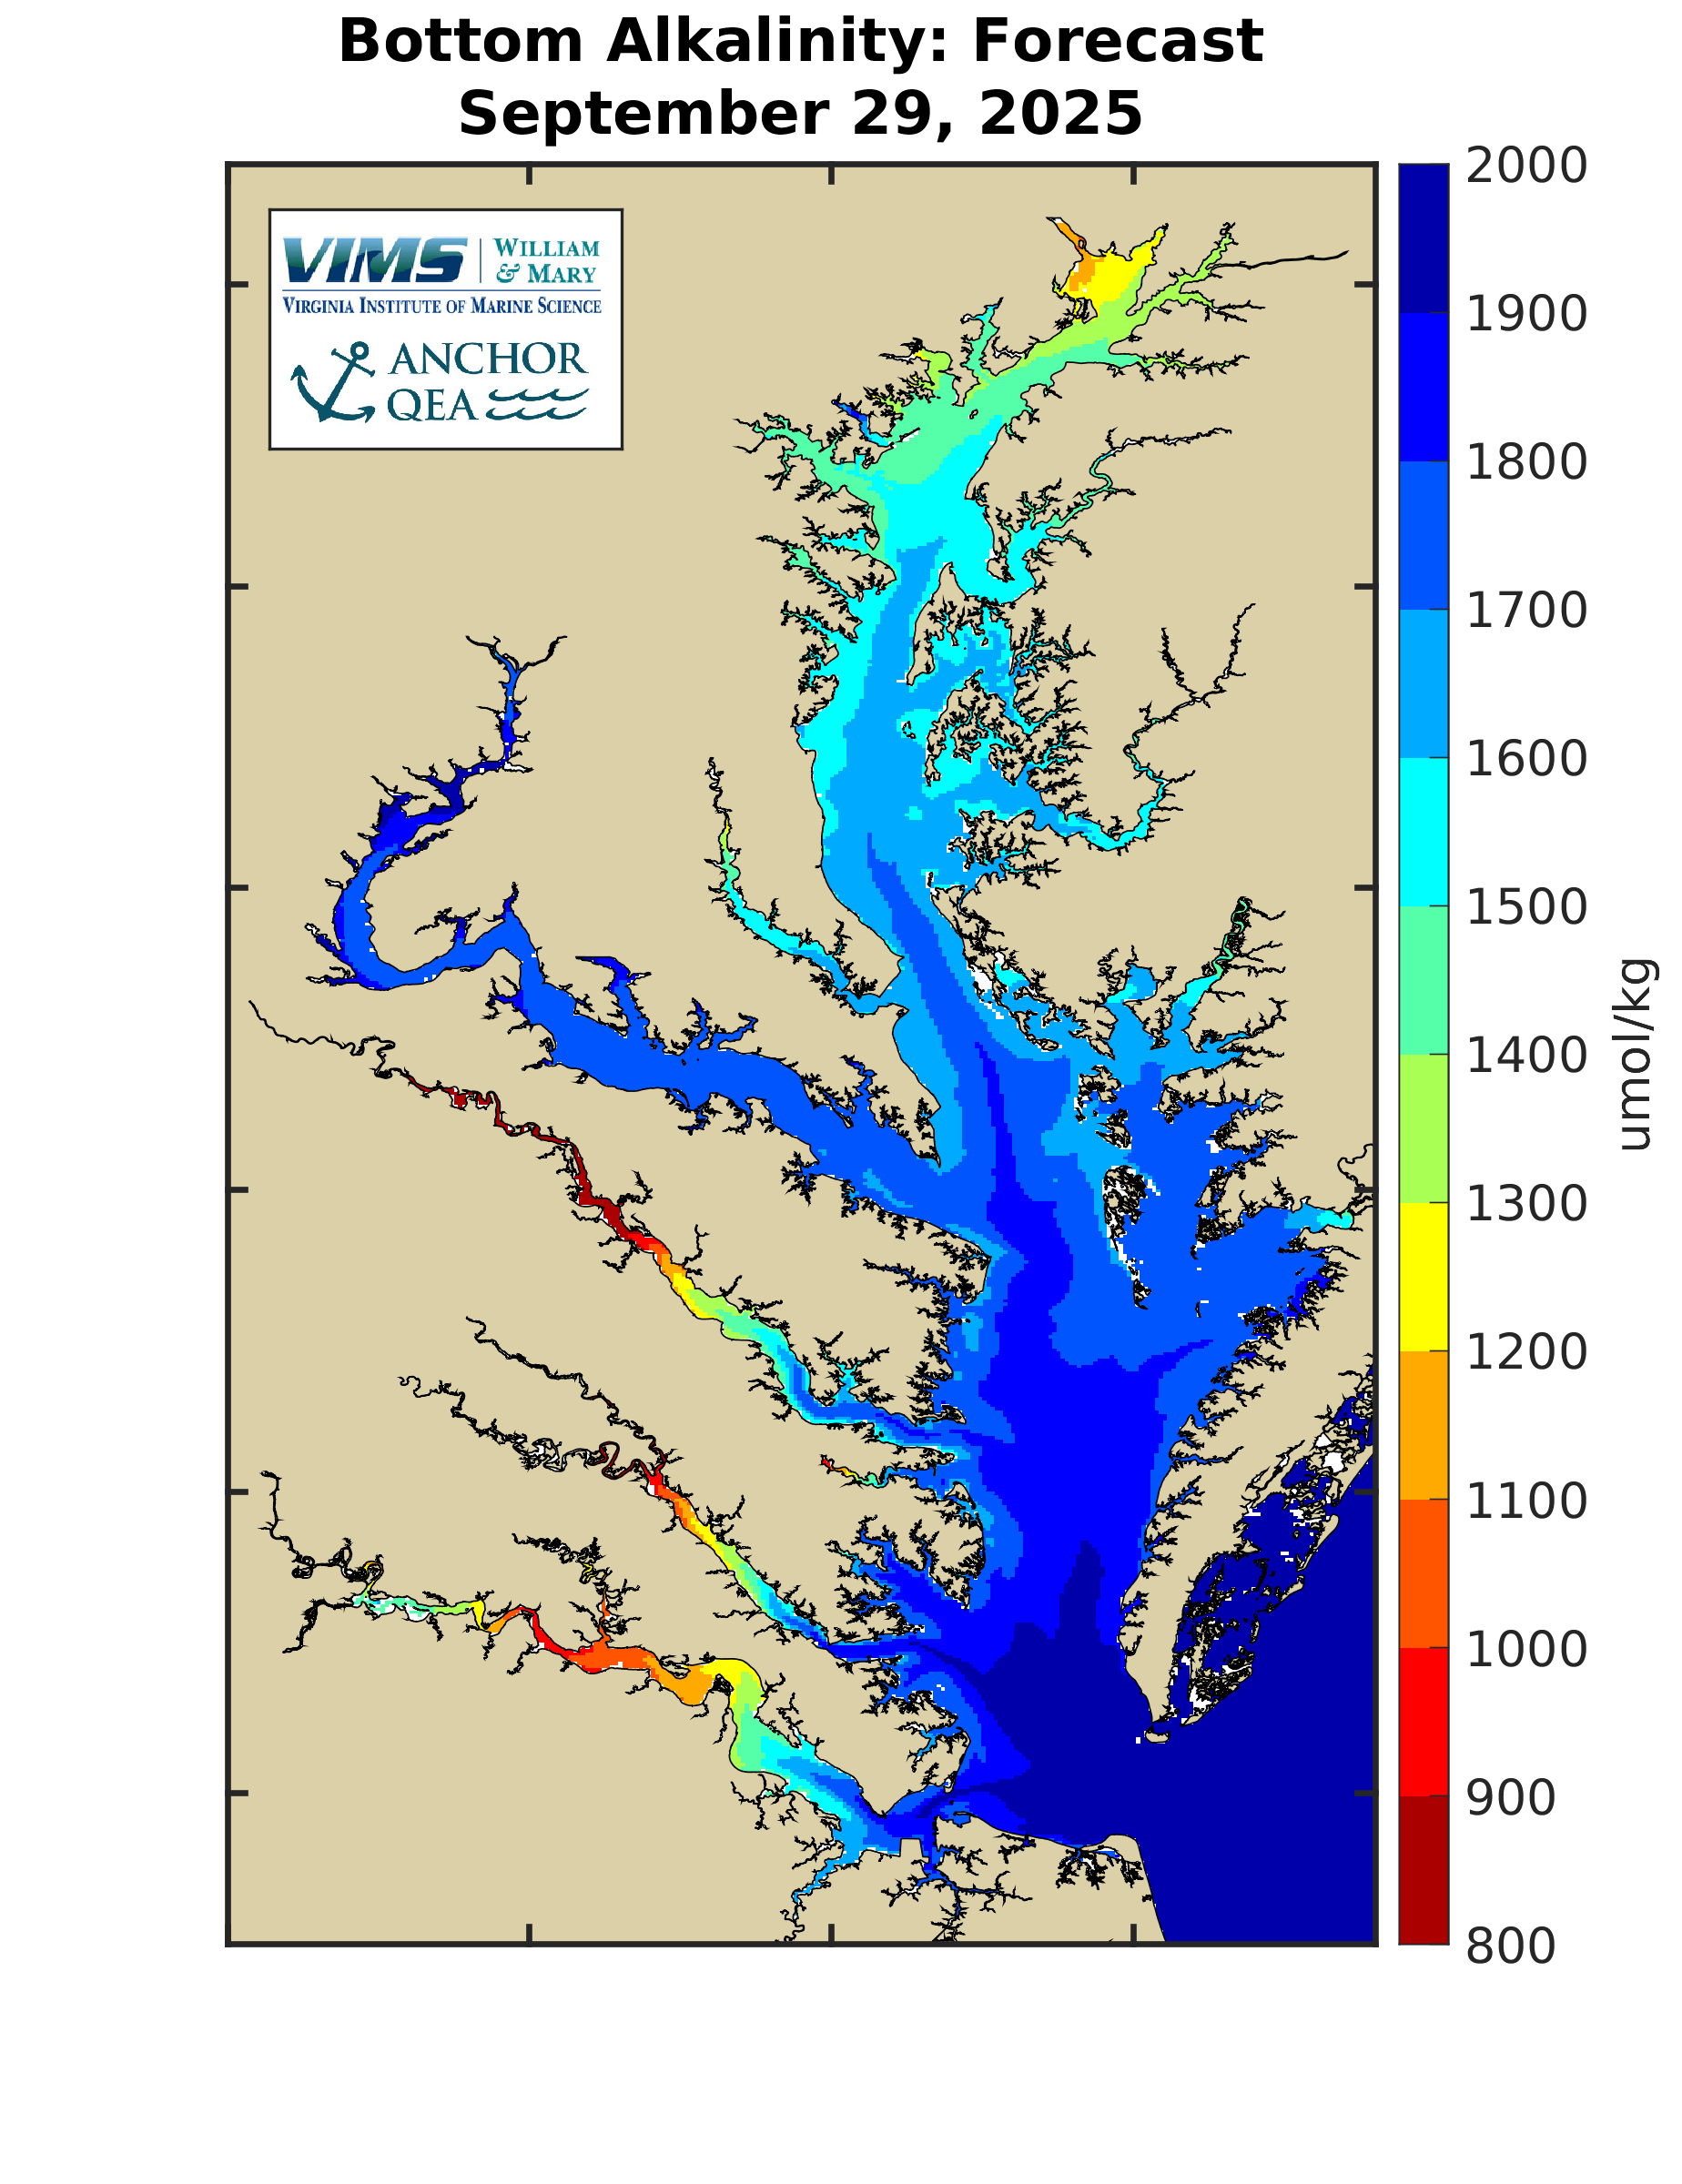
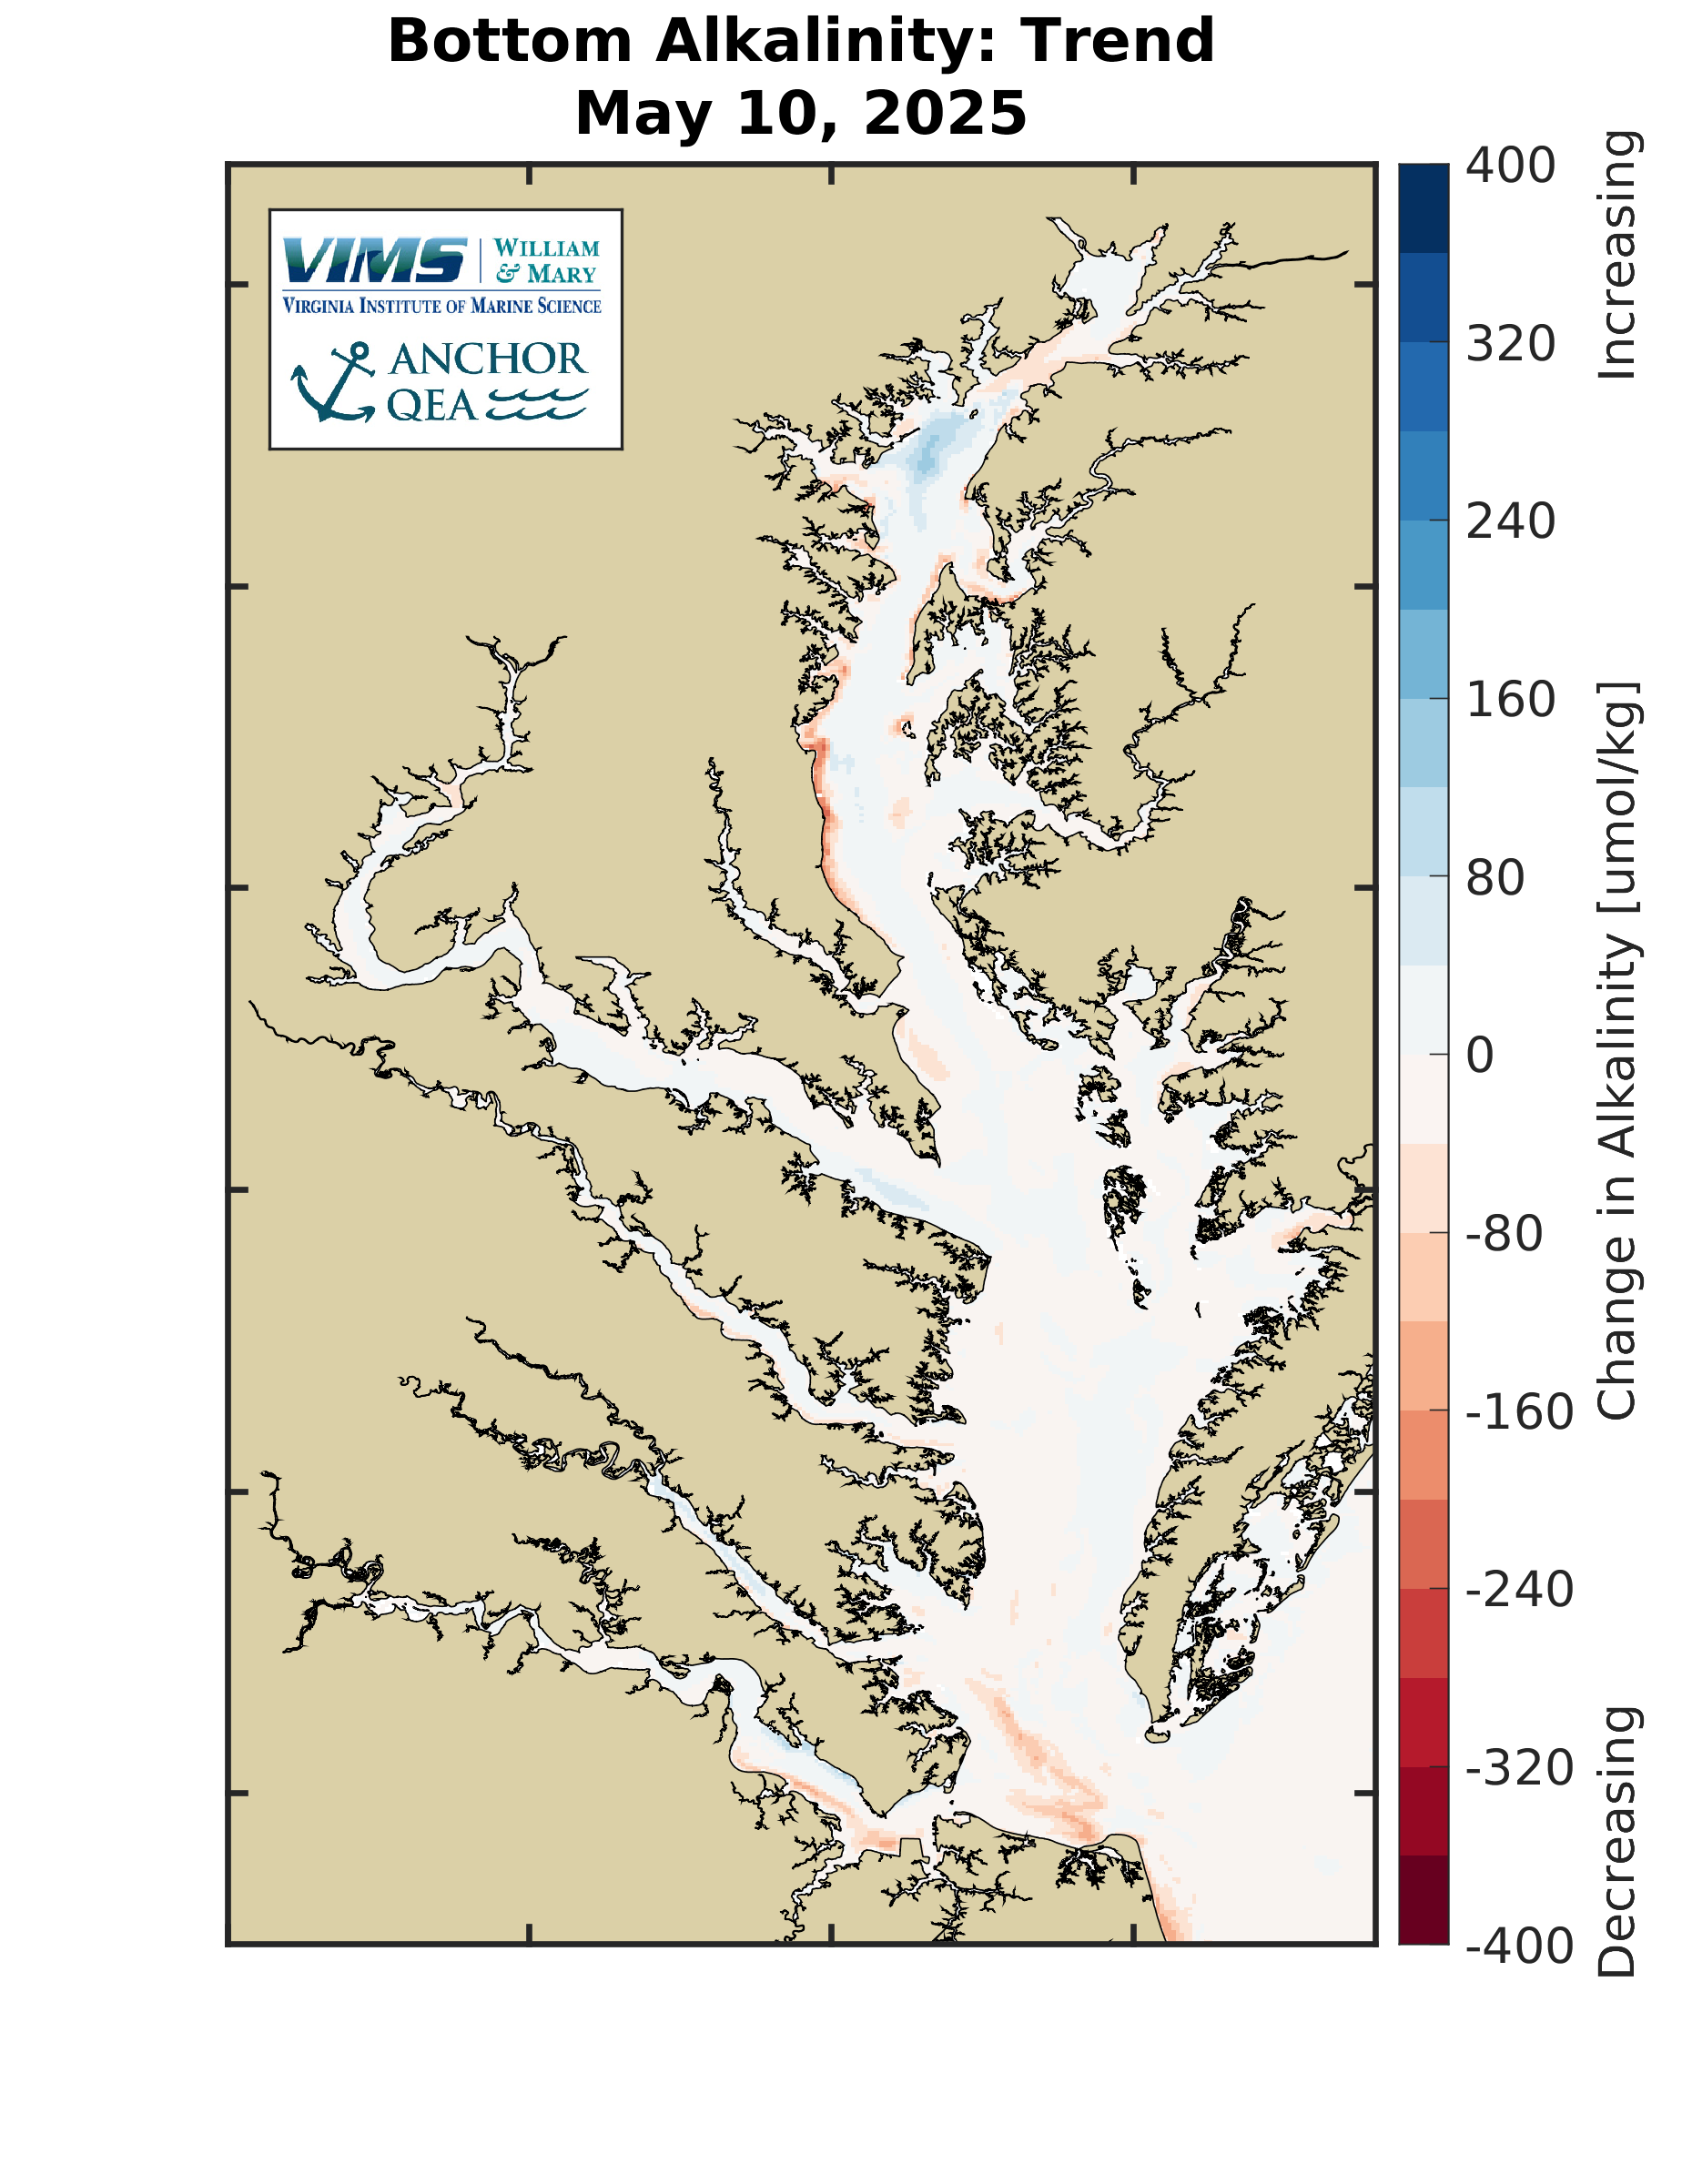
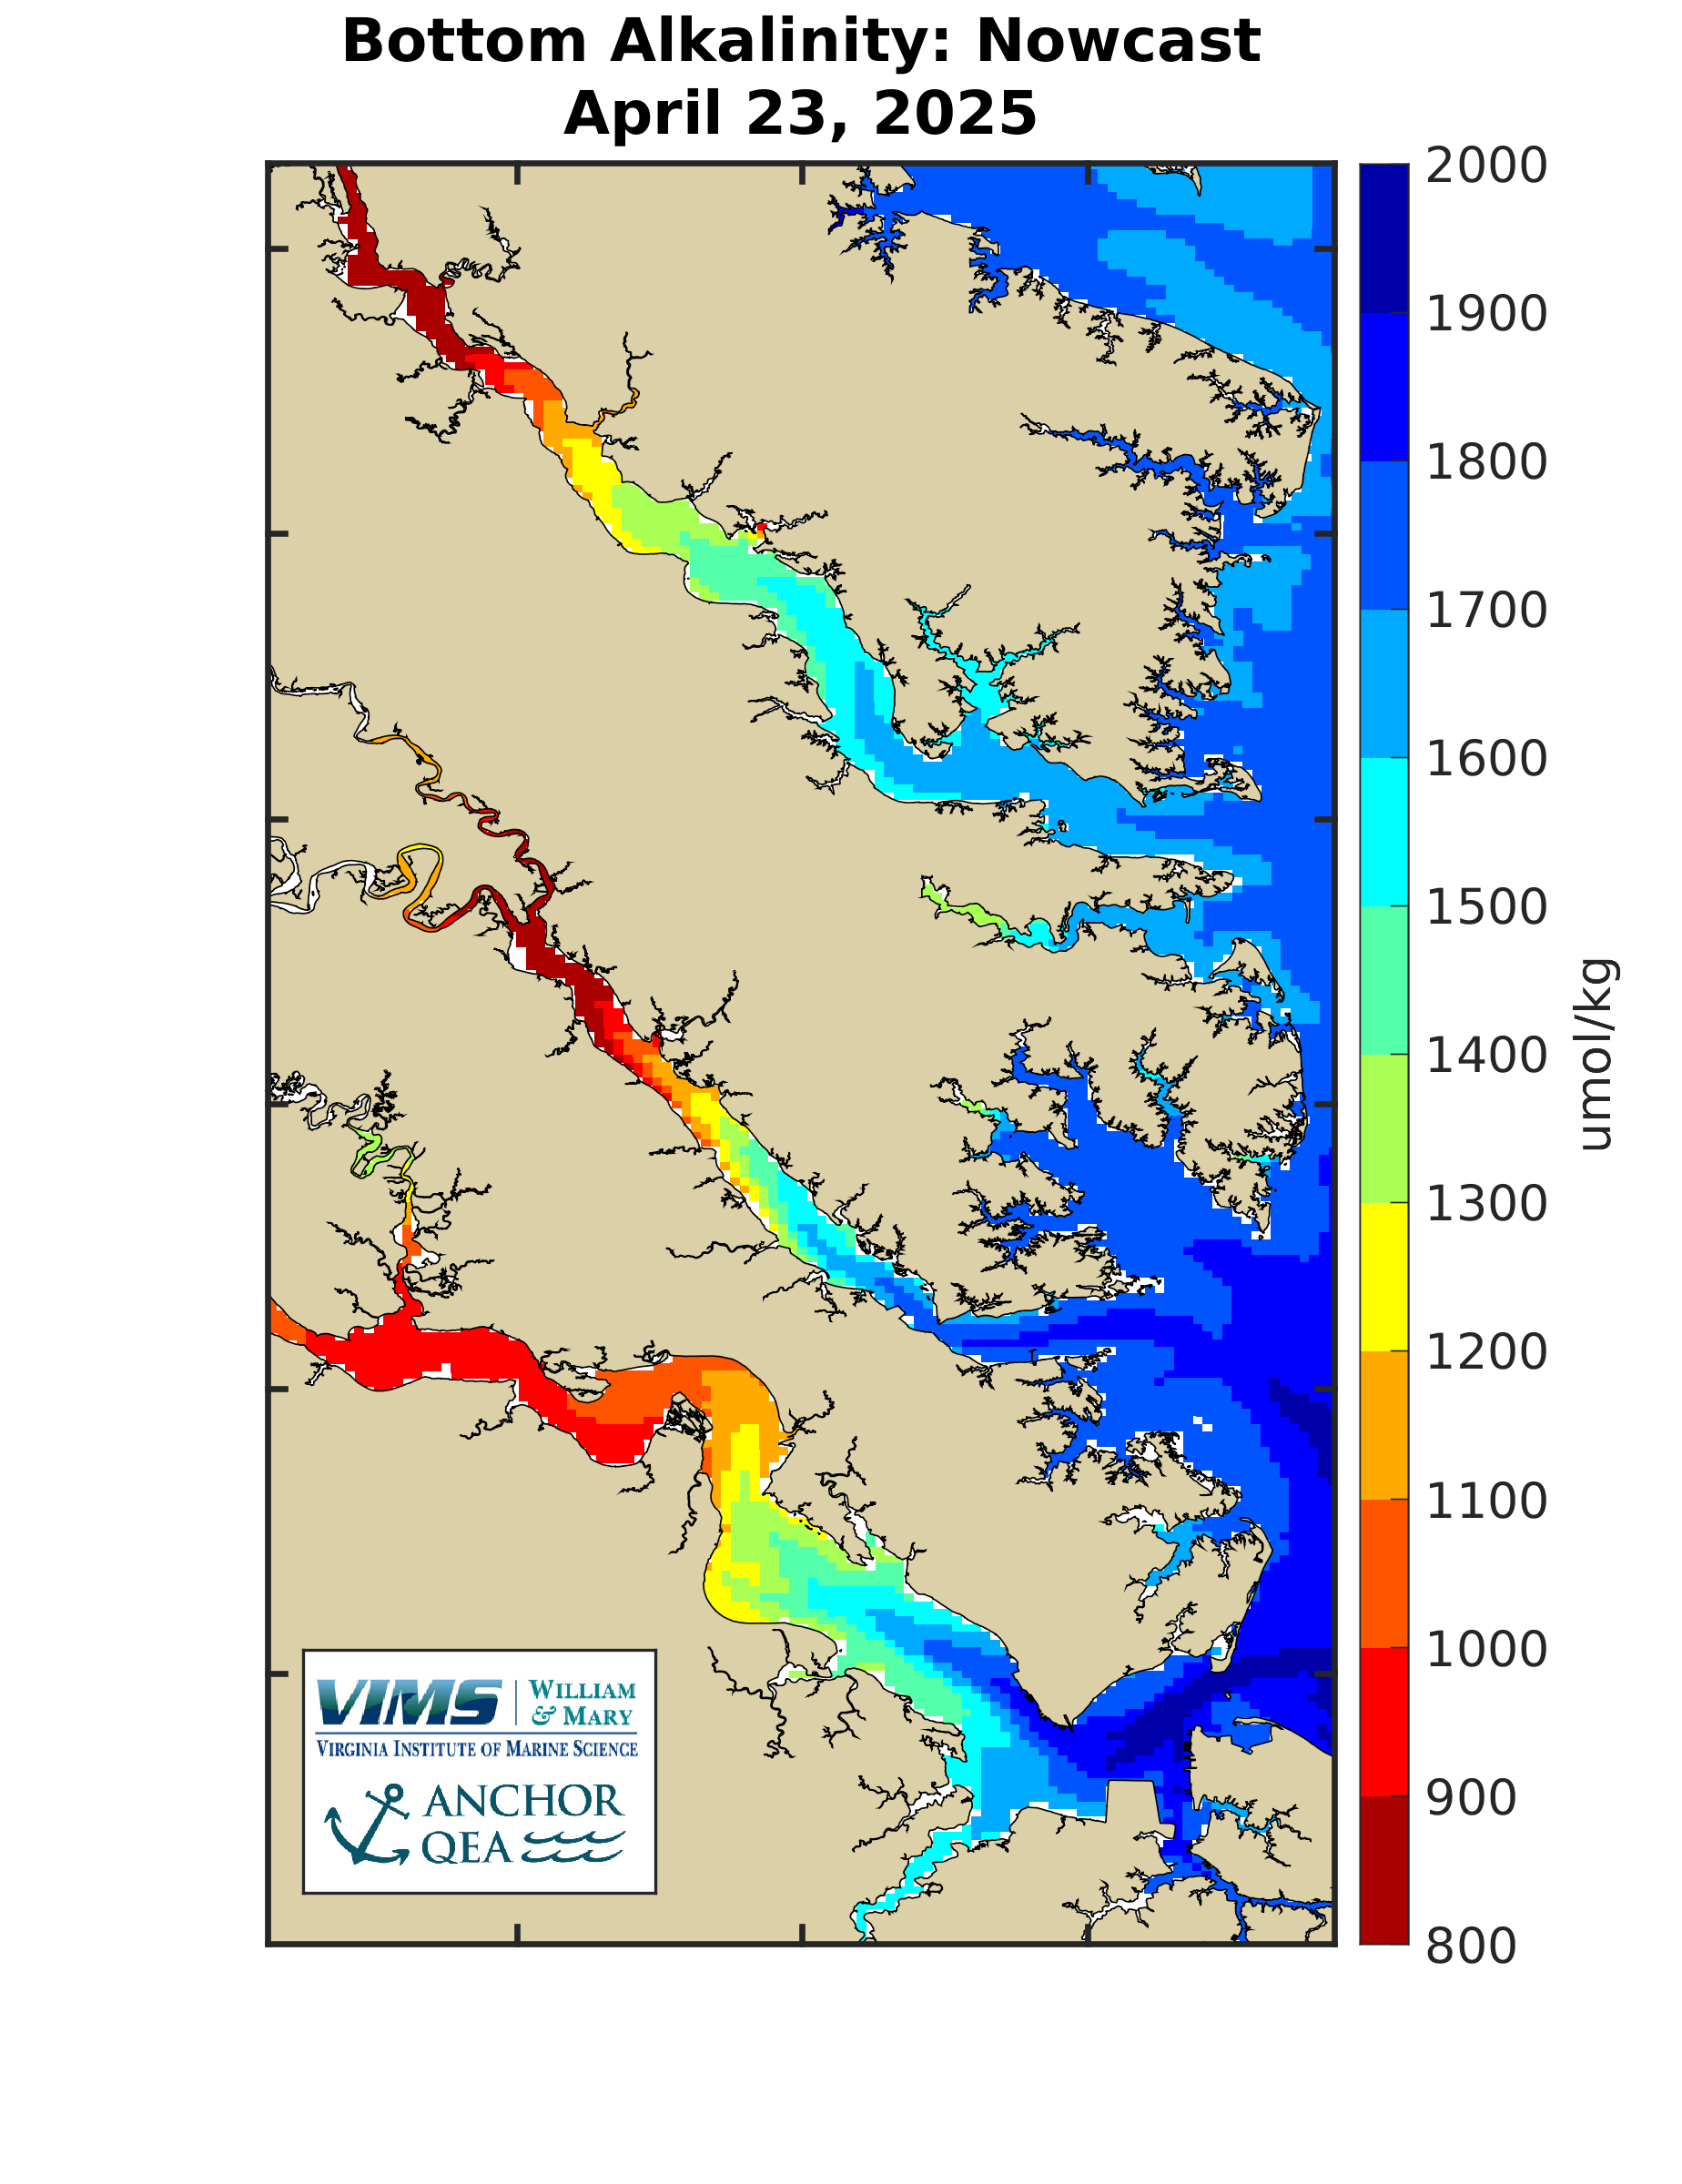
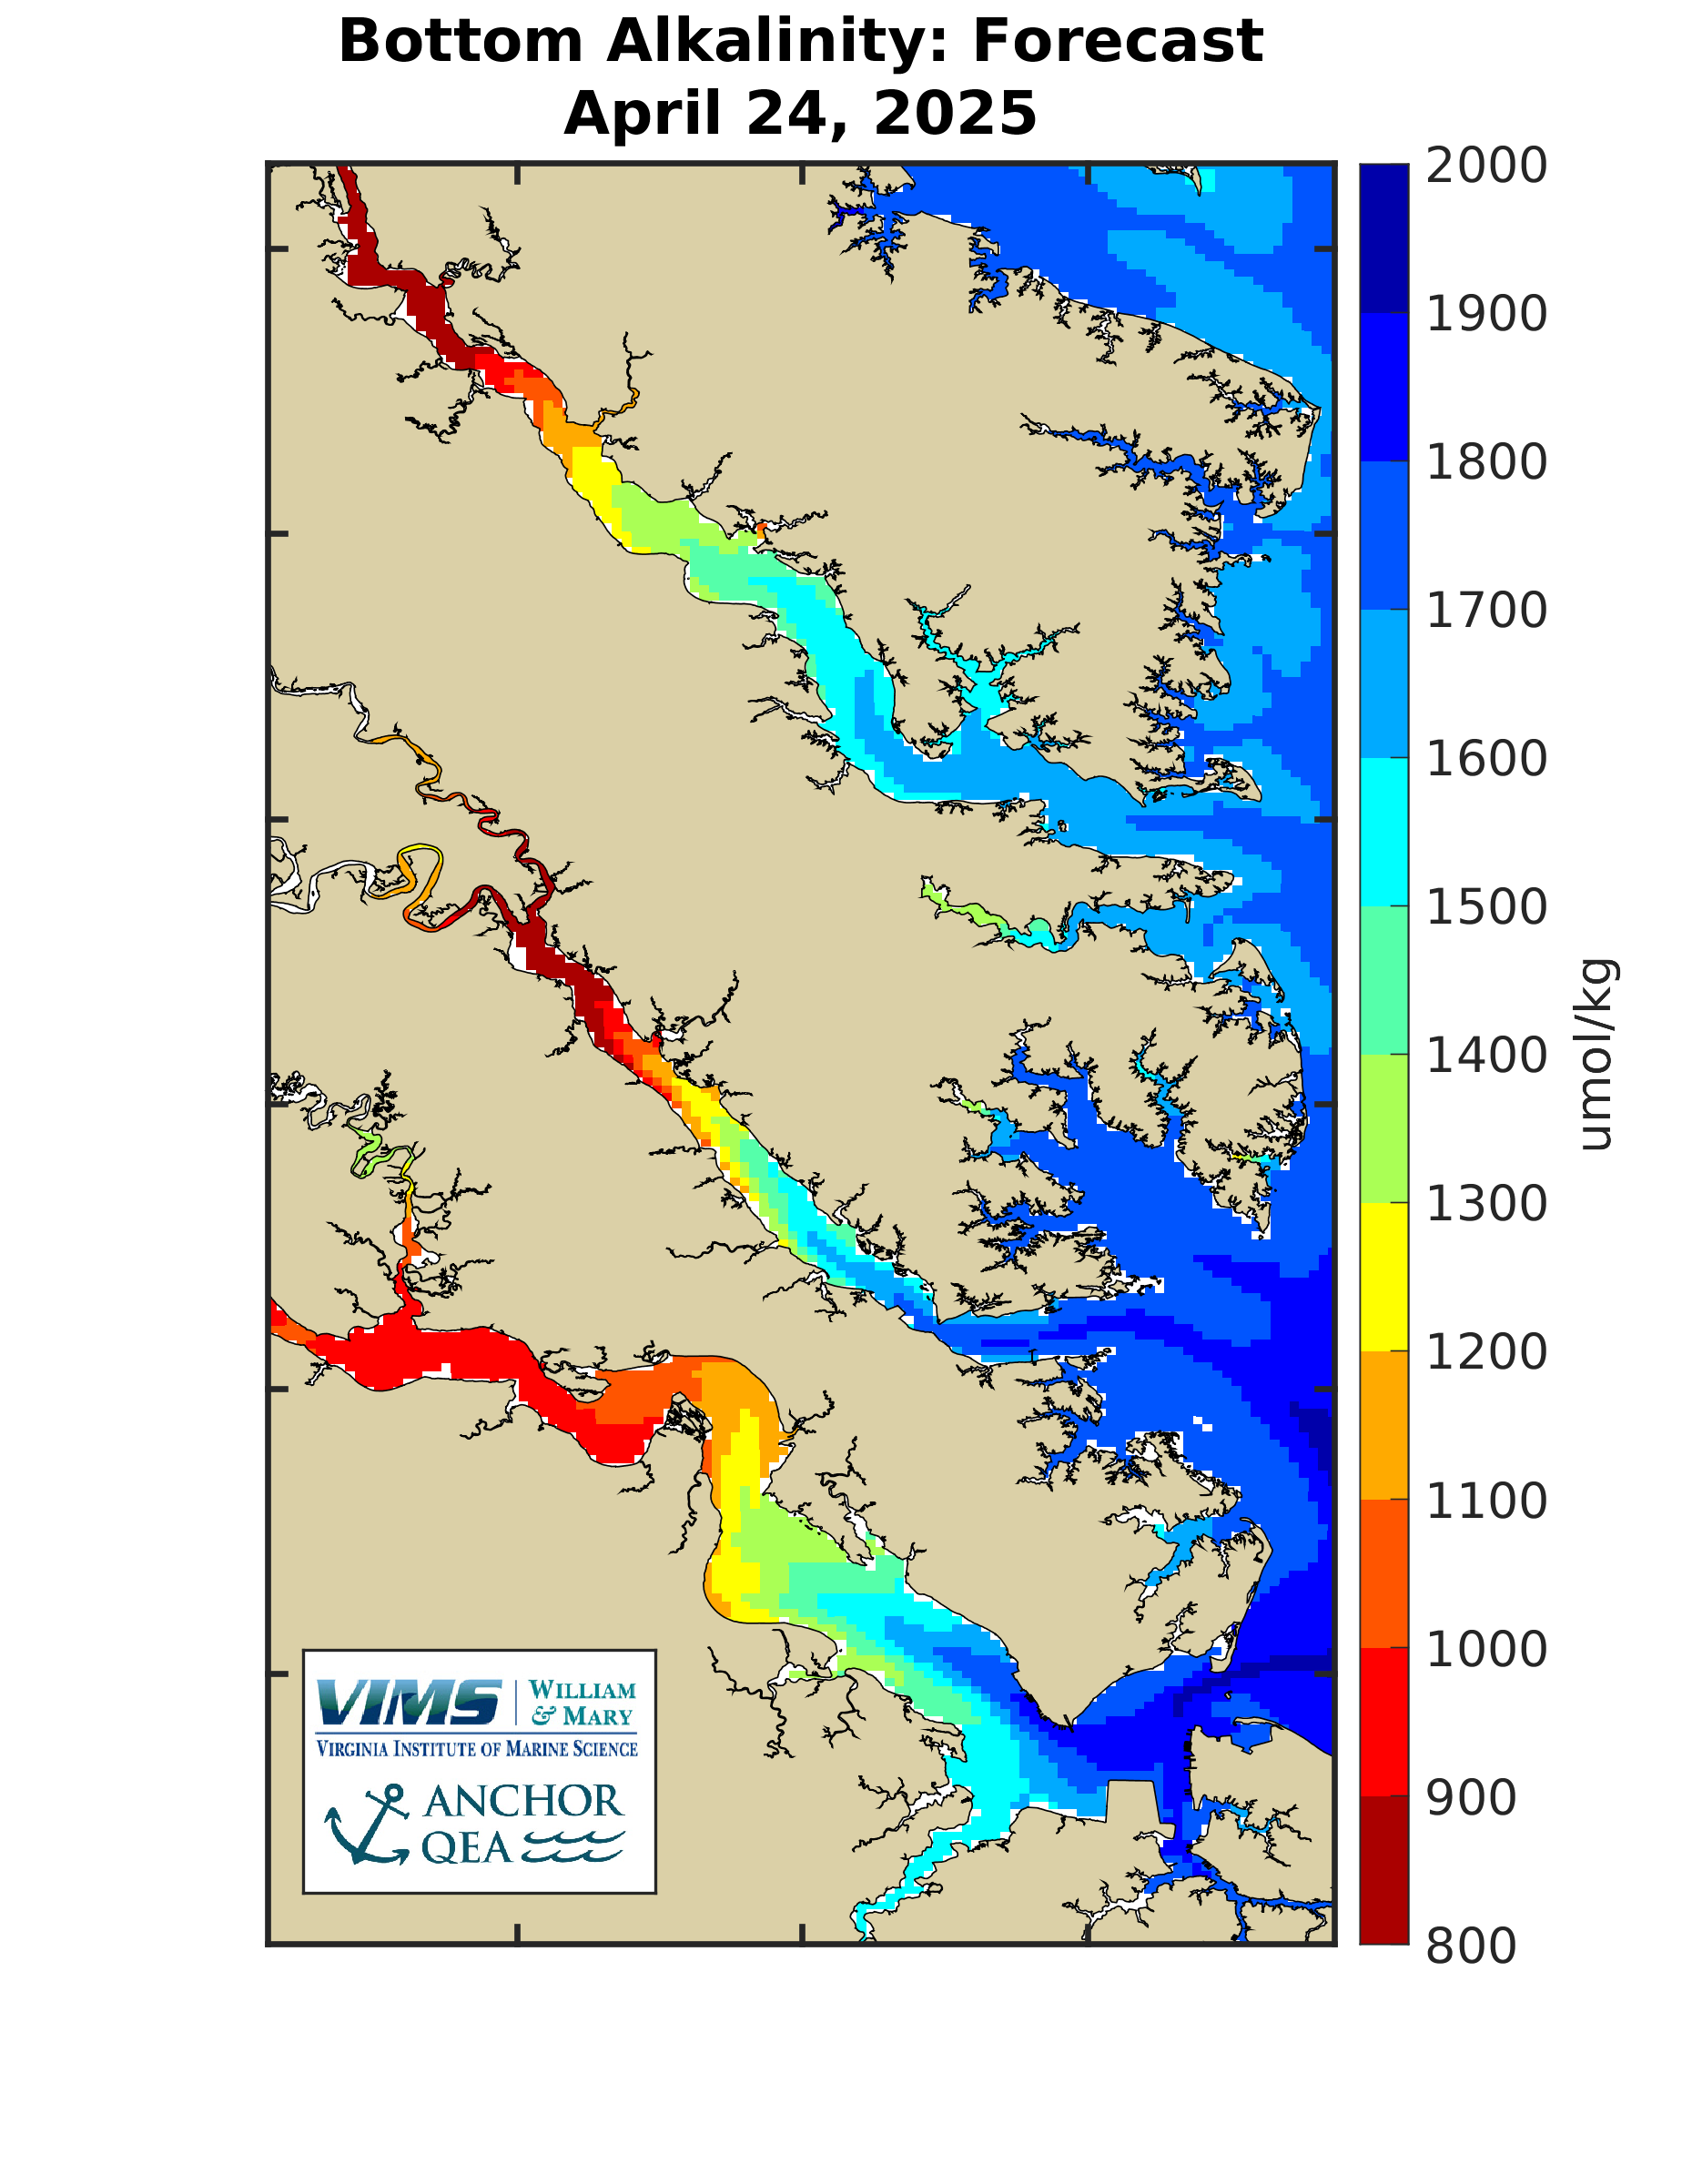
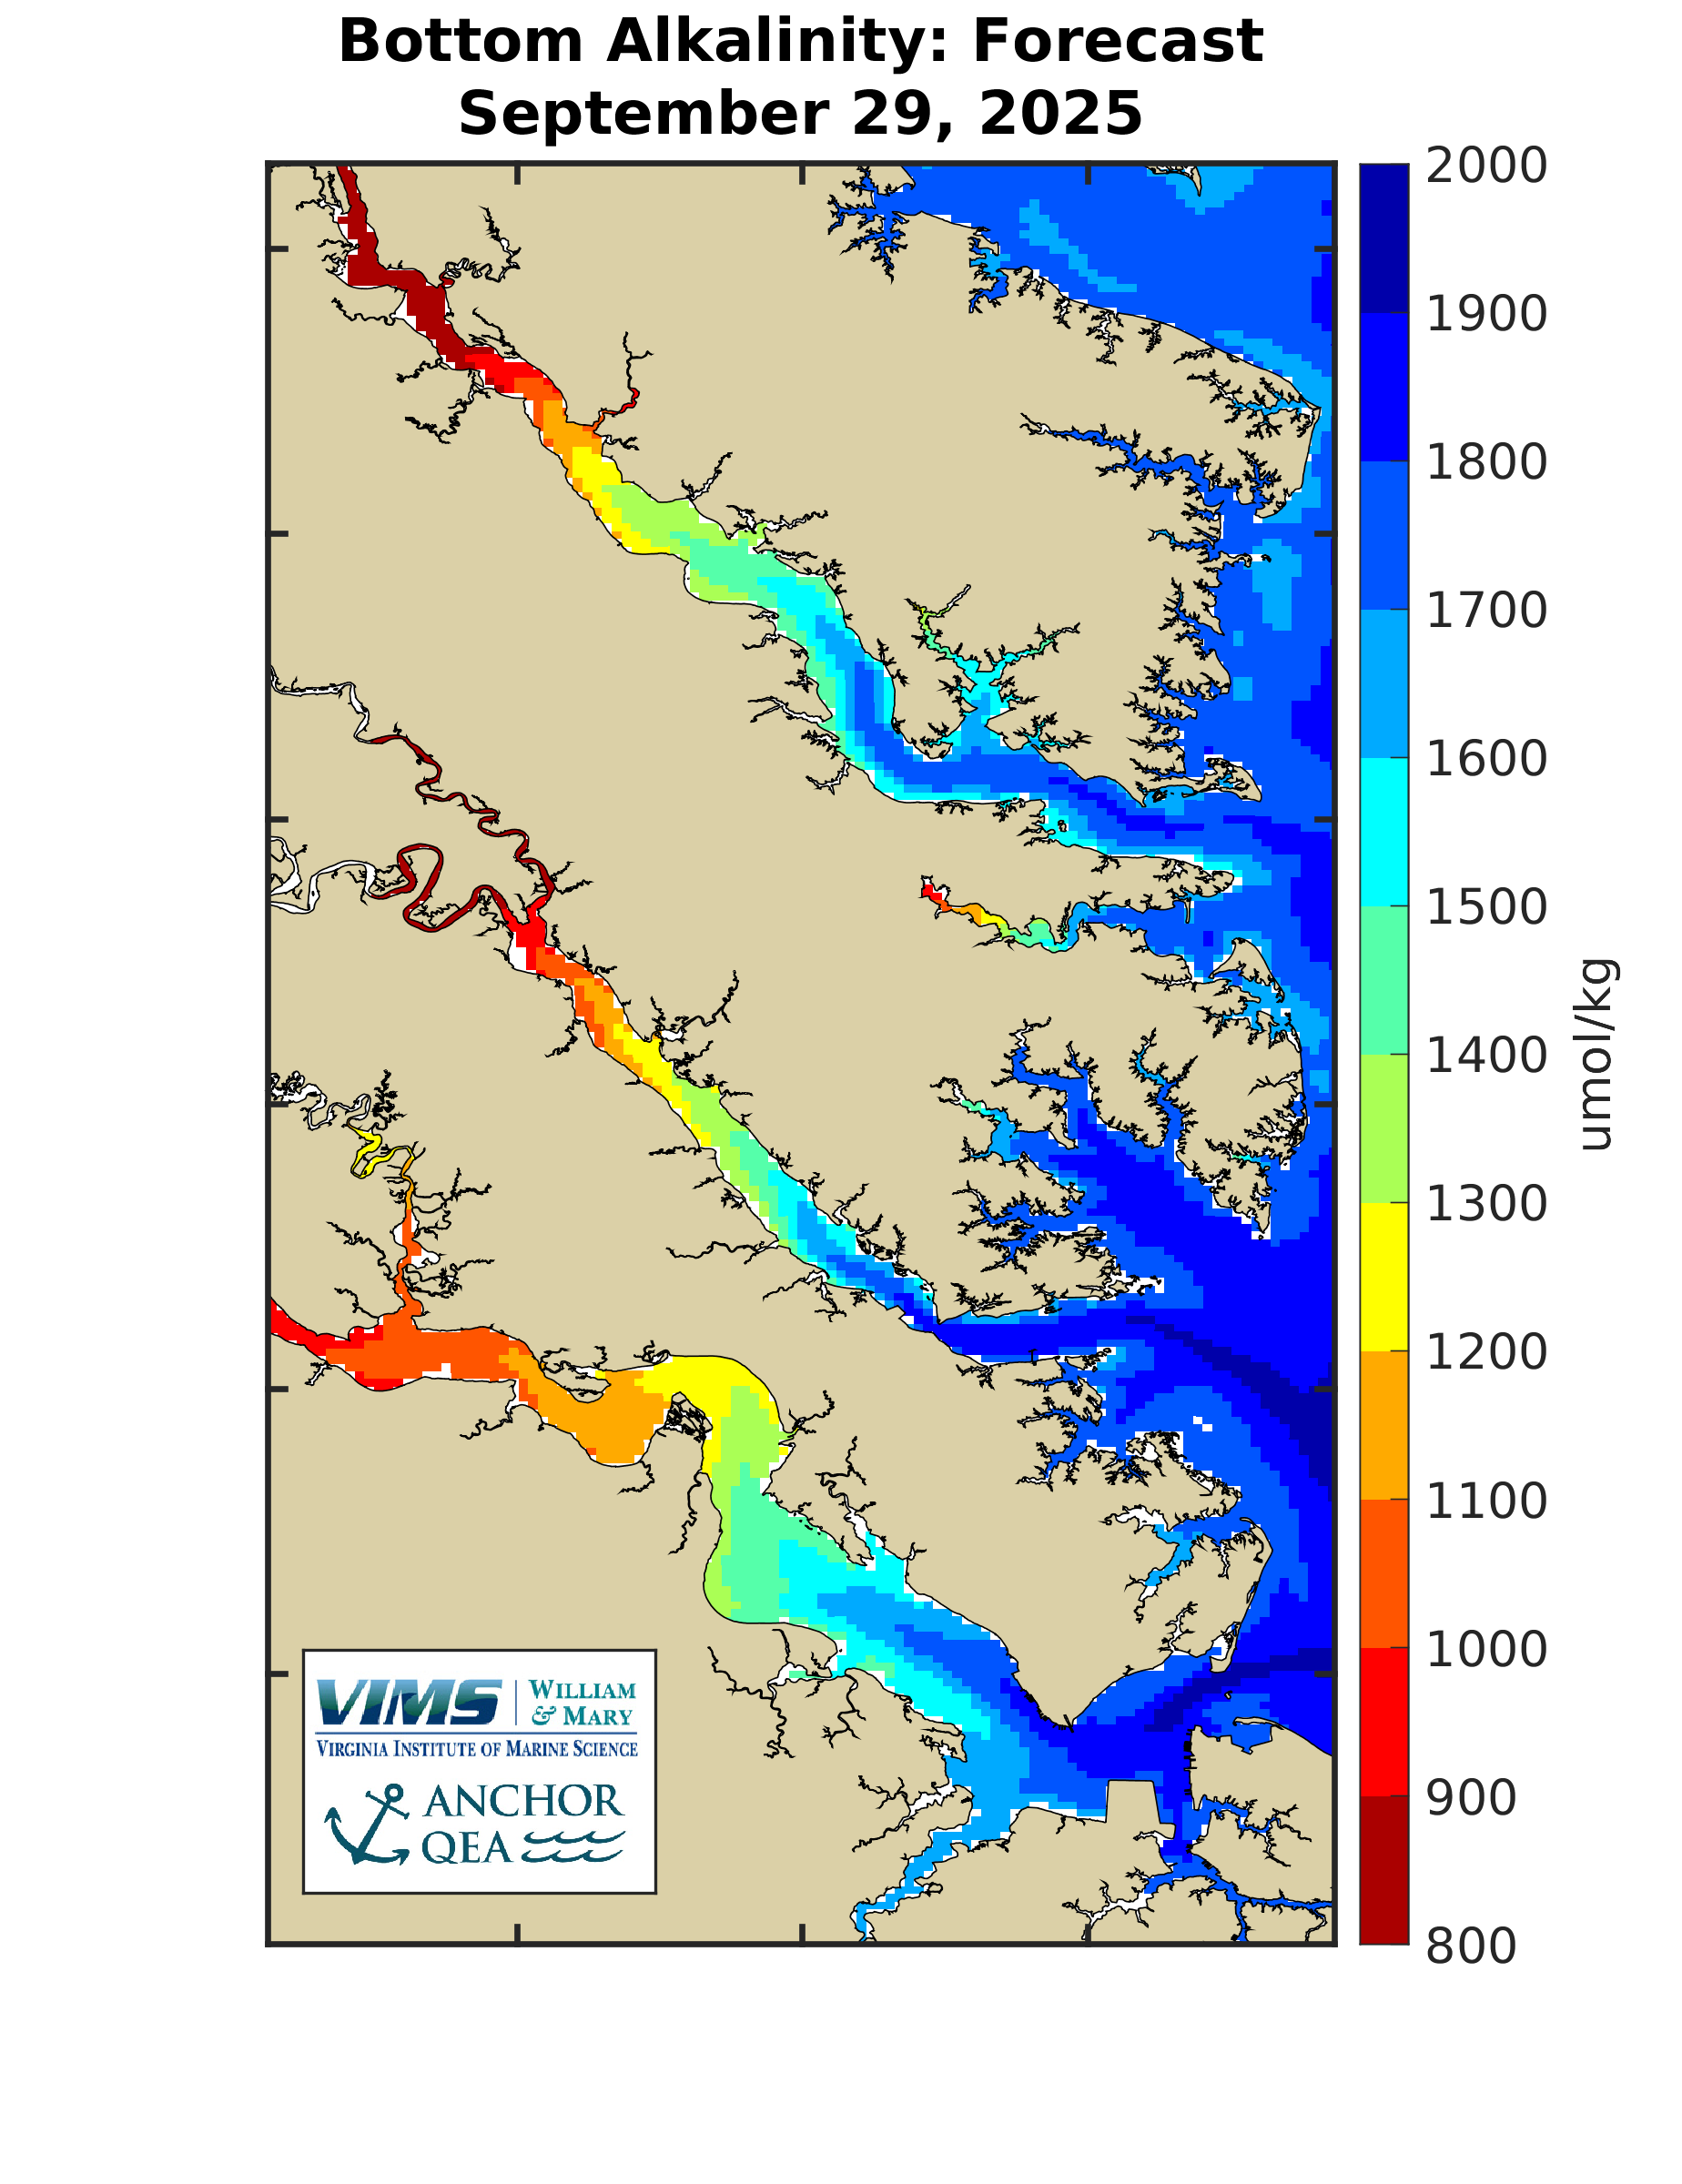
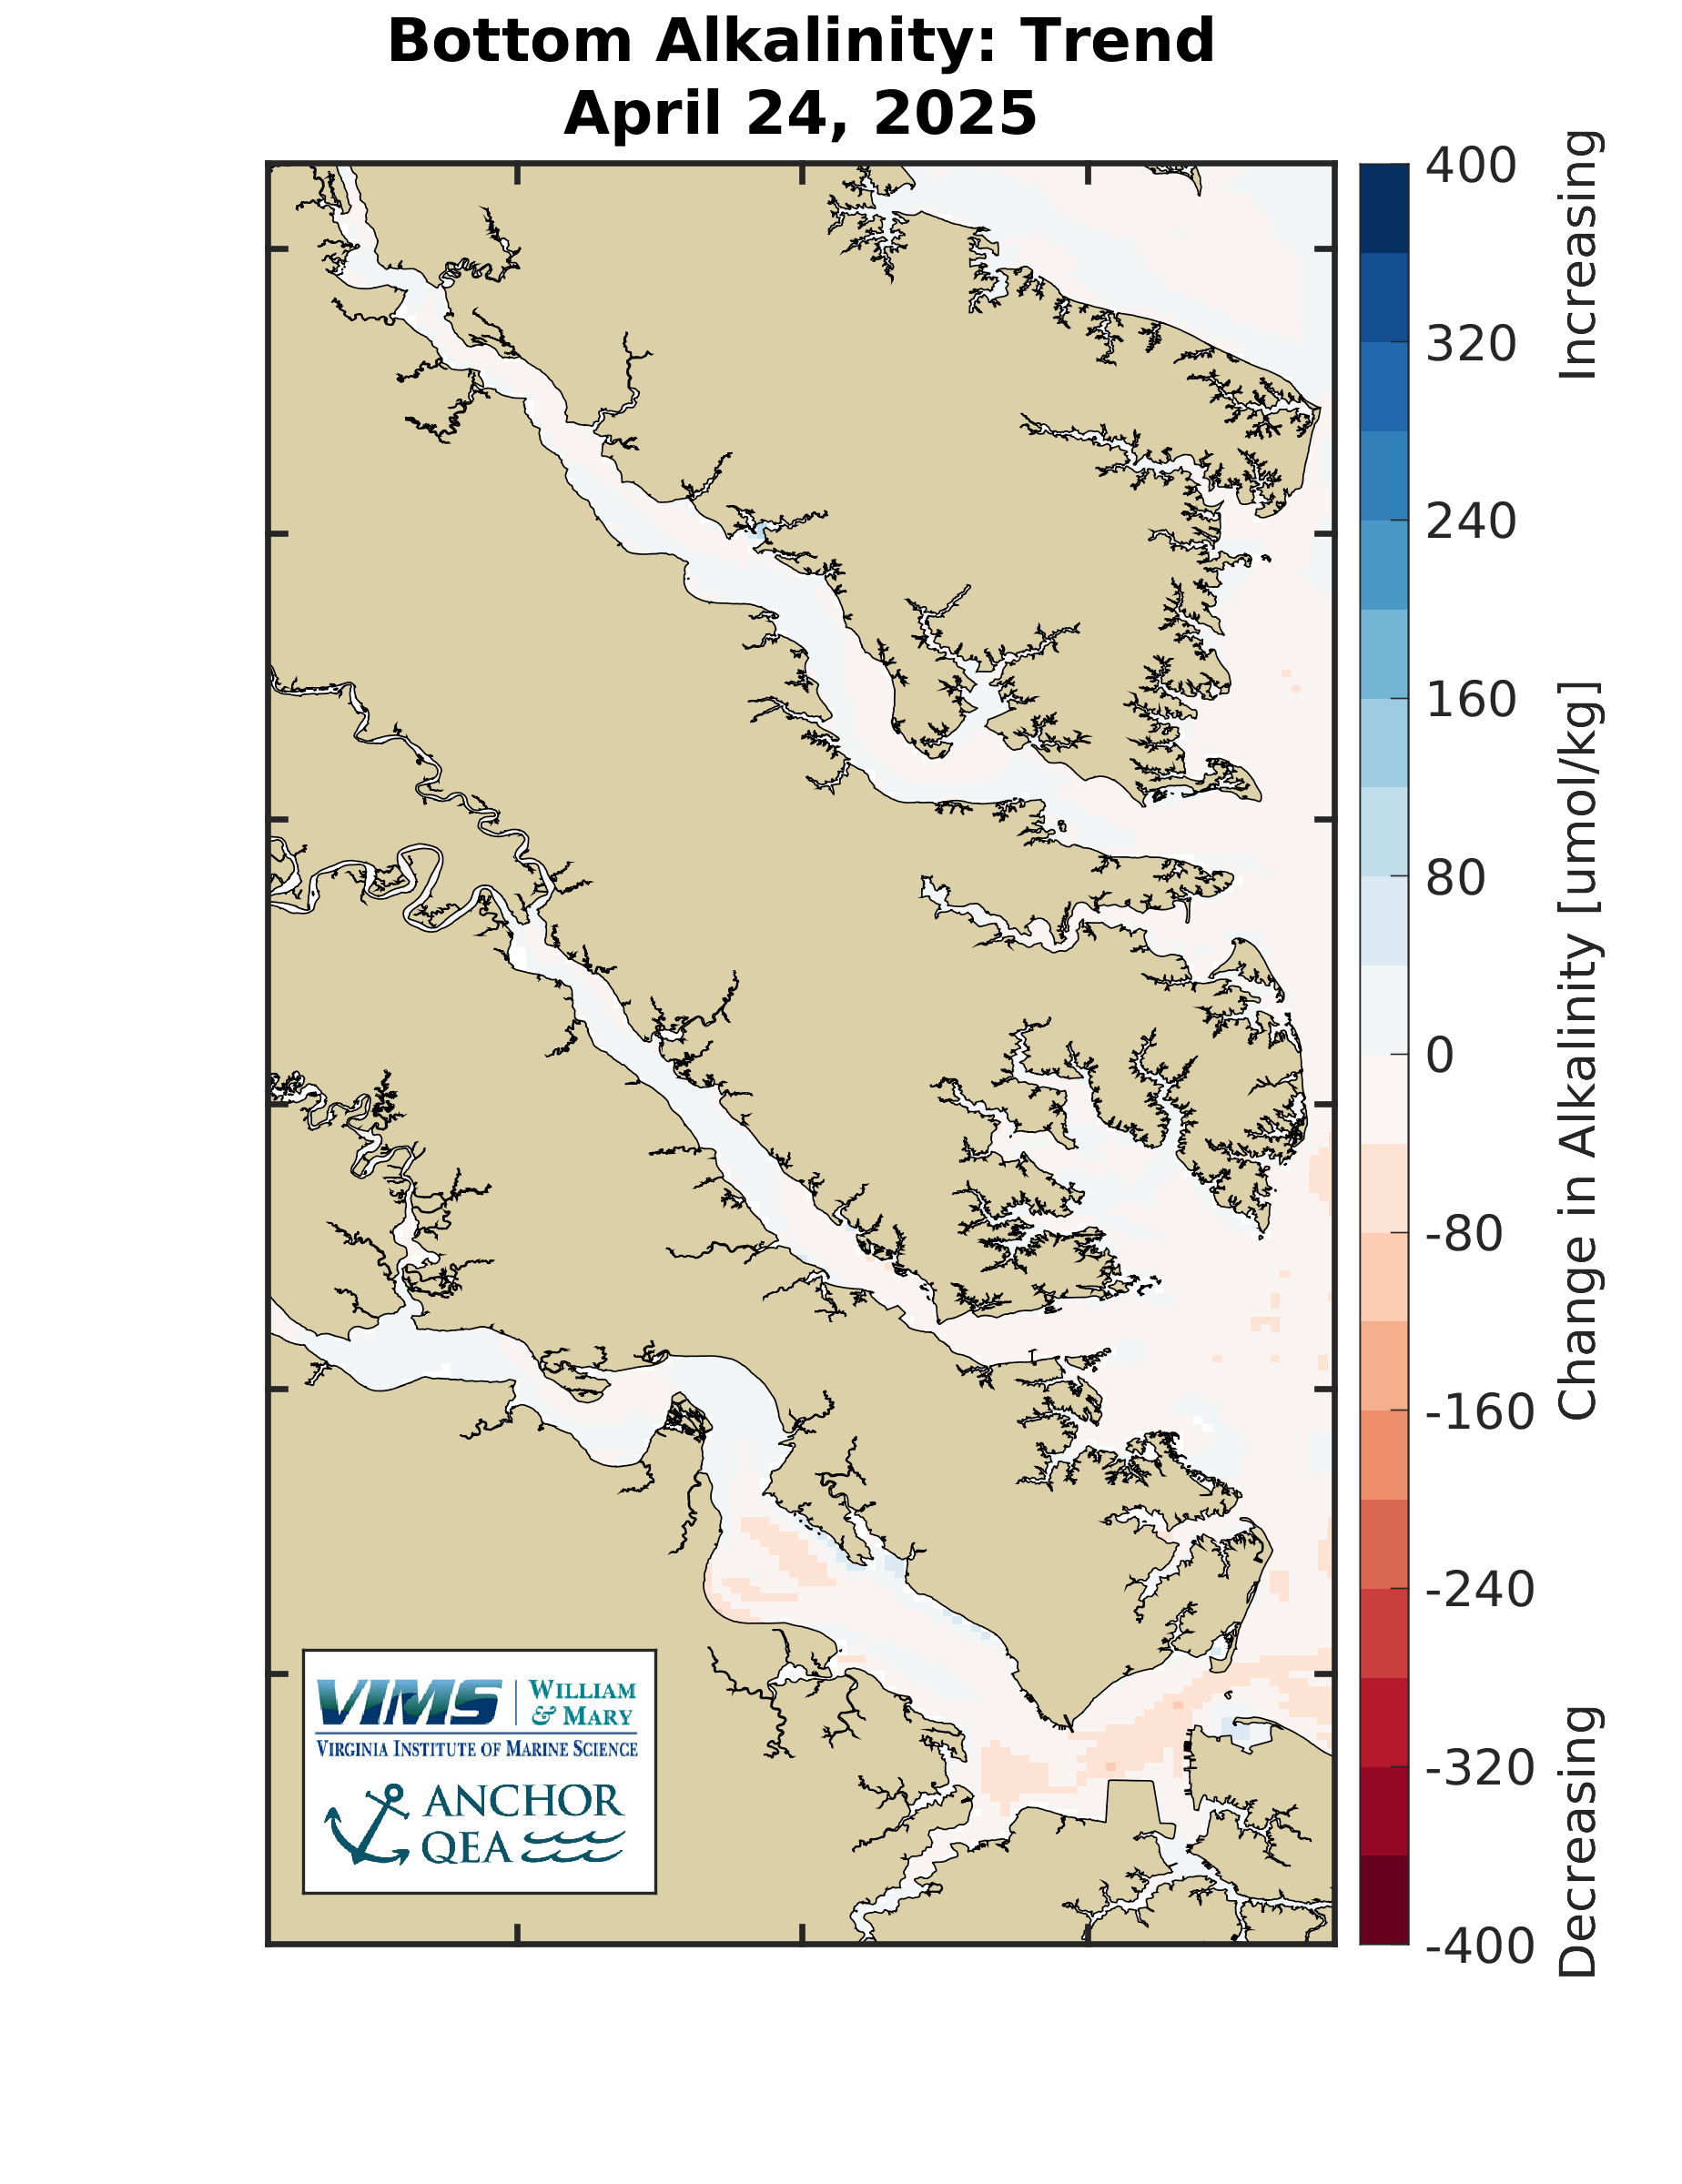
Alkalinity - Bottom Maps
|
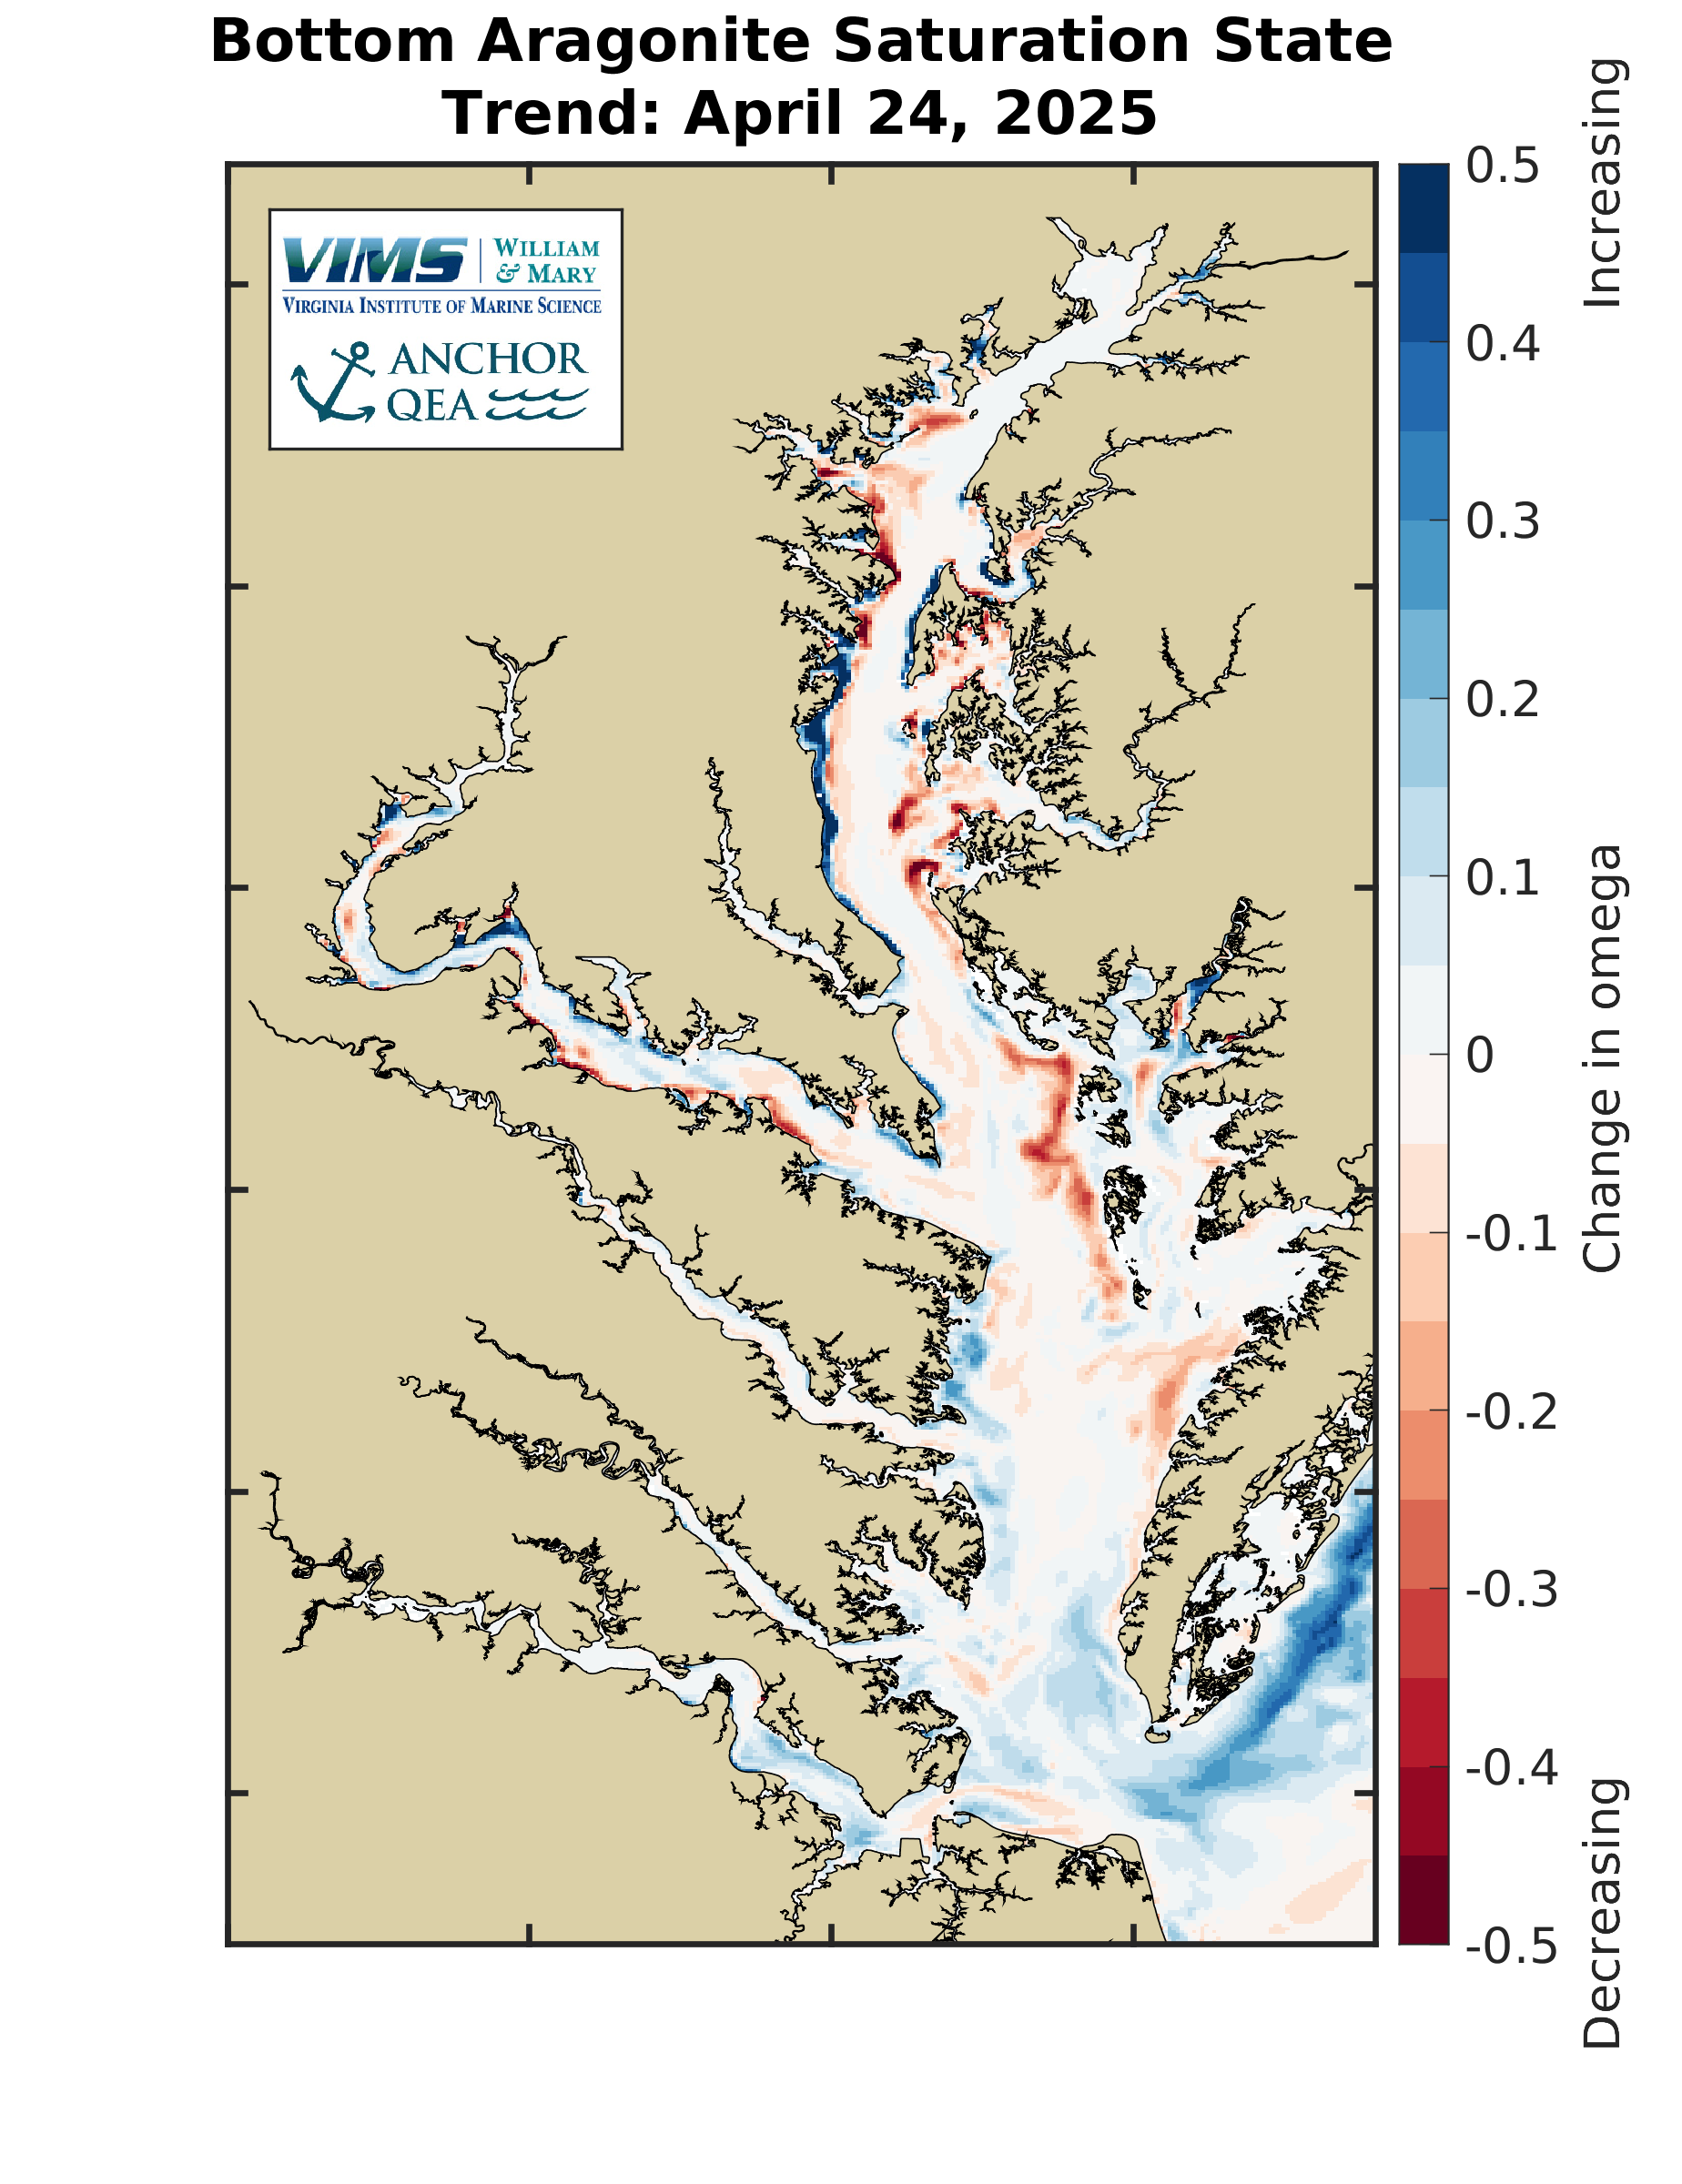
Aragonite Saturation State (Omega) - Bottom Maps
|