King tide provides royal value
Researchers use data collected by citizen scientists to improve flood models
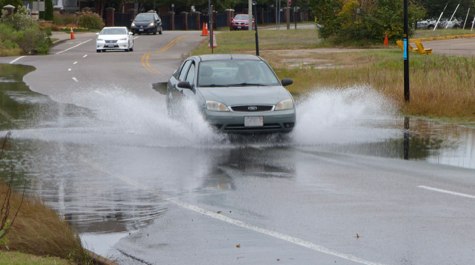
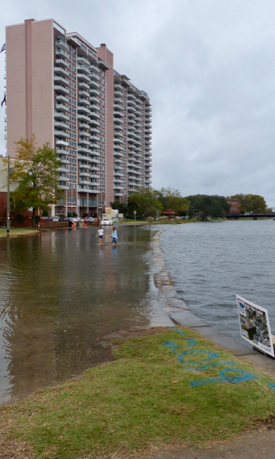
The third annual “Catch the King” event—when trained volunteers hit the shores of Hampton Roads to map the reach of the year’s highest astronomical tide—took place Sunday morning, and though the tide’s reach may not have been quite as “majestic” as in recent years, the data it offered to citizen scientists were still just as golden.
 Dr. Derek Loftis of the Virginia Institute of Marine Science, chief scientist for Catch the King, says “A southerly wind, delayed rainfall, and an offshore shift in the Gulf Stream caused our model to predict less flooding than some of our volunteers may have seen in previous events or even in the past few weeks.” But, he notes, their water-level measurements will still play an important role in improving VIMS’ street-level inundation model: “The data will help verify the impact that atmospheric factors have on predicting flood levels,” says Loftis.
Water levels during Sunday’s king tide were almost a foot lower than they were in mid-October, when a striking example of "sunny day flooding” impacted the Chesapeake Bay due to the combined effects of an offshore nor'easter and the seasonal high tide. “Comparing data collected by our volunteers during these two events will help us better understand how non-tidal factors like wind, rain, and ocean currents affect our model’s flood forecasts,” says Loftis.
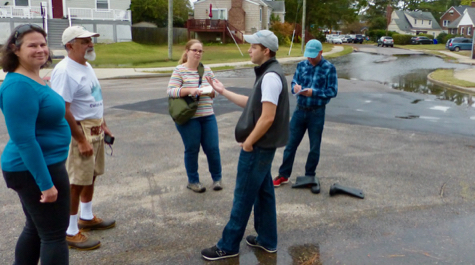
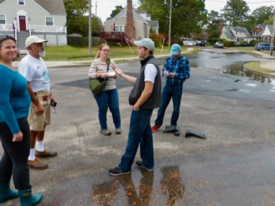
Karen Duhring, a colleague of Loftis in the Center for Coastal Resources Management at VIMS, has been active in training Catch the King volunteers and was impressed with this year’s turnout—especially given the forecast for a rainy, windy morning. “Although the tide level was not extreme or impressive,” says Duhring, “the energy level and data collection efforts of almost 300 citizen scientists certainly was.”
 Catch the King—brainchild of former Virginian-Pilot reporter Dave Mayfield, Skip Stiles of local non-profit Wetlands Watch, and Loftis—is designed to raise awareness of coastal flooding and sea-level rise by giving participants a firsthand look at a troubling reality: within the next few decades, regular high tides will be as high as today’s annual “king tides,” while king tides will reach heights now only seen during storms.
“We care about king tides because they're harbingers of what's to come in the decades ahead,” says Mayfield. “They are a window into that future.”
“Catch the King” participants gather their data using the free “Sea Level Rise” app developed by Stiles in conjunction with Concursive, a Norfolk-based software company. With phones in hand, these “king’s attendants” walk along the water line near peak tide, thumbing a “GPS pin” every few strides to mark the extent of tidal inundation.
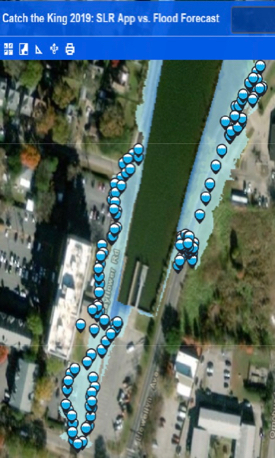
“The app gives us an easy way to map the entirety of Hampton Roads,” says Loftis. “This year, almost 300 volunteers collected more than 35,000 GPS points and 218 geotagged photos for geospatial comparison throughout Tidewater Virginia, which enabled us to validate our model across the region.”
Flood-model validation
VIMS’ street-level inundation model builds on data from network of water-level sensors to predict the time and place of coastal flooding throughout Hampton Roads—from the broad shorelines of the Chesapeake Bay to the narrowest tidal creeks.
{{youtube:medium|3J9VtXM7hBQ, Learn how Dr. Derek Loftis uses data collected by volunteers during Catch the King events to validate VIMS' street-level flood model.}}
Loftis uses the data collected during Catch the King and other flood events to validate the model’s forecast via a painstaking, cell-by-cell comparison of predicted and observed water levels. He says “We take the GPS values from the app, and the 1.2 million individual grid cells in our model, and compare the time series of what was observed and what was predicted. We then use any discrepancies to help improve the model.”
Loftis has even created a tool that allows Catch the King participants to check the validation themselves. “We built an online map that lets people measure between any of their points and what our model predicted as the maximum inundation extent,” he says. “They can use the online measuring tools to see in feet any difference between what they recorded as the high-water line and what the model predicted.”
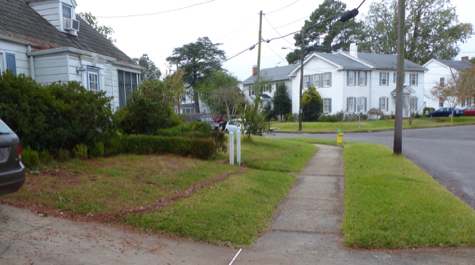
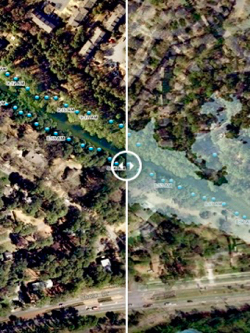
 The differences typically stem not from any problem with the physics the model uses to simulate changes in water level, but from inaccuracies in elevation data. Although LIDAR technology—which uses aircraft-mounted lasers to map ground height—has greatly improved elevation maps in Virginia and around the world, some terrain types still pose problems. “LIDAR can’t see through thick tree cover, or under bridges or though culverts,” says Loftis, “so we need people to visit these trouble spots in person.”
Loftis says this is where Catch the King’s media partners—The Virginia Pilot, Daily Press, WHRO, and WVEC—play a particularly important role. “We’ve collected data since 2014 using the Sea Level Rise app,” he says, “but without media support, everyone tends to go to the one place they know floods—the Hague in Norfolk, for instance. Our media partners are critical in letting people know not to collect data just in the places we already know have issues, but to spread out to areas where model validation is most needed.”
Duhring validates the success of that communications effort in 2019. “Our volunteers,” she says, “expanded our coverage area by mapping on the Middle Peninsula, Northern Neck, and Eastern Shore to document how flooding is affecting rural areas as well as urban places like Norfolk.”
Ian Cheyne, one of a dozen Master Gardeners from the Northern Neck chapter to volunteer for this year’s event, says “We covered about 500 yards of the beach at Hughlett Point and spots on Dymer Creek and the Rappahannock River. We had a great time and everyone is enthused to do it again and get more folks involved.”
Supporting this year’s Catch the King event were the Commonwealth Center for Recurrent Flooding Resiliency, a partnership between VIMS, Old Dominion University, and the Virginia Coastal Policy Center at W&M Law School. Chief sponsors for this year's event were the Hampton Roads Sanitation District and AECOM. Other sponsors include the Batten Environmental Education Initiative, the Hampton Roads Community Foundation, and tHRive, the young professionals of the Hampton Roads Chamber.
Although this year’s Catch the King event has now already occurred, the Sea Level Rise app is available at any time through Apple’s App Store and Google Play, and training sessions will continue to prepare users for future high-tide and storm events.