

VIMS model now capable of street-level storm-tide predictions
Test shows it could have accurately forecasted flooding in NYC during Sandy
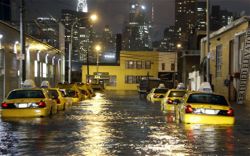
The water that surged into the intersection of New York City’s Canal and Hudson streets during Hurricane Sandy—to choose just one flood-ravaged locale—was ultimately driven ashore by forces swirling hundreds of miles out in the Atlantic.
That simple fact shows not only the scale and power of a tropical cyclone, but the difficulty of modeling and forecasting its potential for coastal flooding on the fine scale needed to most effectively prepare a response.
 Now, a study led by Professor Harry Wang of William & Mary’s Virginia Institute of Marine Science demonstrates the ability to predict a hurricane’s storm tide at the level of individual neighborhoods and streets—a much finer scale than current operational methods.
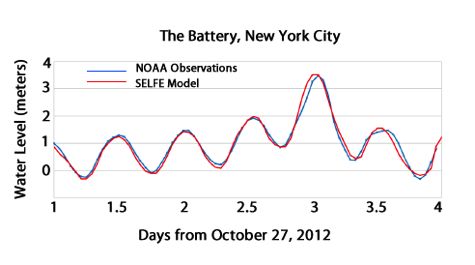
The study, published in today’s issue of the Journal of Marine Science and Engineering, shows that with the right input, the team’s high-resolution computer model was able to simulate water levels to within 6-8 inches of those observed in New York City and surrounding areas during Hurricane Sandy’s approach and landfall in late October 2012. This includes sections of Manhattan where buildings and other infrastructure divert and channel floodwaters in exceptionally complex ways.
“Storm-surge modeling is a tough problem,” says Wang. “People are interested in the possibility of flooding on a very fine scale, on the order of their house, office, or street.” But for a forecast model to work, he says, “We have to resolve the boundary conditions——data on tides and winds—very far away, out into the open ocean. And we have to have that information far enough beforehand to provide time for people and agencies to respond.”
Wang and his modeling team—fellow VIMS researchers Derek Loftis, Zhuo Liu, David Forrest, and Joseph Zhang—conducted their study by “hindcasting” Hurricane Sandy’s landfall along the U.S. Atlantic coast. In this technique, scientists initiate a computer model with data collected before a past event, and then test the model’s accuracy by comparing its output with observations recorded as the event unfolded.
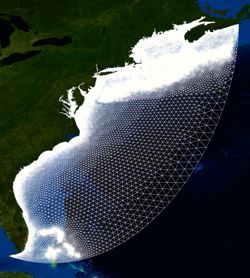
For their test case, Wang and colleagues first used a large-scale model called SELFE to hindcast Sandy-driven changes in water level along the entire East Coast, from Florida to Nova Scotia. They initialized SELFE by entering data on normal tidal conditions along the model’s open-ocean boundary, which is drawn almost 1,500 miles offshore. They allowed the model to "spin-up" for 10 days ahead of Sandy's approach, then another 5 days forward in time once the storm had entered the model grid, adding data on wind speed, wind direction, and air pressure in 6-minute time steps. They derived these data from NOAA’s large-scale NAM (North American Mesoscale) model and a separate fine-scale atmospheric model called RAMS. RAMS—short for Regional Atmospheric Modeling System—was developed by the Poquoson office of Weatherflow Inc., a private-sector provider of weather data.
Wang stresses the importance of a good atmospheric model. “You cannot accurately forecast storm surge without accurate wind forcing,” he says. “We are happy to be able to use RAMS, and it seems to be working quite well.”
Wang says the 6-minute time-step is also key to their model’s success. Some storm-surge models resolve time in increments as short as 3 seconds, but doing so requires computing power that exceeds even that available in W&M’s SciClone Computing Complex. “A 6-minute time-step allows us to run a 5-day simulation in 40 minutes,” says Wang. “That’s the kind of rapid run-time you need for forecasting.”
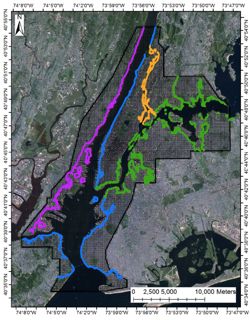
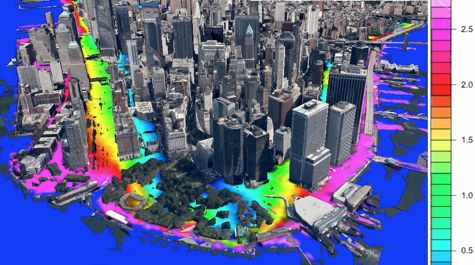
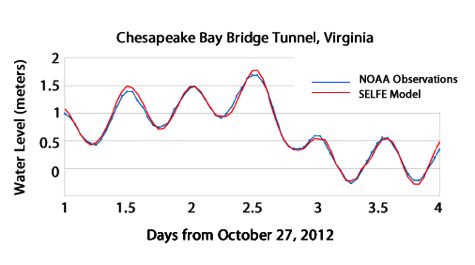
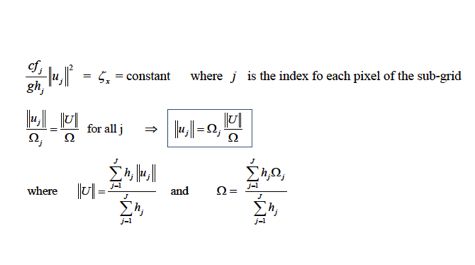
The second step for Wang’s team was to use output from the “large-domain” SELFE model—which they verified by comparing with actual readings from NOAA tide gauges between Long Island and Chesapeake Bay—to drive a model of much higher resolution focused on New York City and its harbor. This “sub-grid inundation model” incorporates high-resolution elevation data collected with LIDAR, a mapping technique that uses airborne lasers to map the ground surface to within a few inches of its actual height.
“High-resolution hydrodynamic models are essential to account for the effects of local features,” says Wang. “When water floods into a city, it encounters everything from waterfront berms to streets, railroads, parks, highways, subway stations, bridges, and building of all different kinds.” These structures and surfaces not only divert and channel the water, but provide different levels of friction that must be modeled as well.
VIMS Dean & Director John Wells calls the results of the team’s sub-grid inundation model a “breakthrough” in storm-tide forecasting—with model output within 6 to 8 inches of the water levels recorded in New York City during Sandy by the U.S. Geological Survey. The USGS measured Sandy’s flooding by deploying temporary tide gauges at selected sites during the storm, and by sending out teams of observers afterward to record mud and wrack lines on buildings, roadways, and other infrastructure.
Says Wang, “Our results compared very favorably with the USGS’ Hurricane Sandy Mapper database in terms of timing, area of inundation, and depth of floodwaters. The maximum extent of horizontal inundation was within 30 meters [90 feet] of the USGS values.”
Animations created by Assistant Research Scientist David Forrest show the accuracy of the sub-grid inundation model in stunning detail. “The animation clearly shows water going around buildings and rushing through the streets,” says Wang.
“What we’ve achieved is an efficient platform that addresses both large-scale storm tide and high-resolution inundation problems simultaneously,” he adds. “Our future plans are to add the many other processes that are at play during a hurricane—rainfall, filtration, storm-water drainage, and the effect of waves. That’s the goal for our future development and further improvements.”
This interactive map, created in Google Earth by Assistant Research Scientist David Forrest, shows the modeled flooding of New York City's Battery during Hurricane Sandy. View Larger Map