U.S. Sea-Level Report Cards
Trends, projections, and processes to aid coastal planning
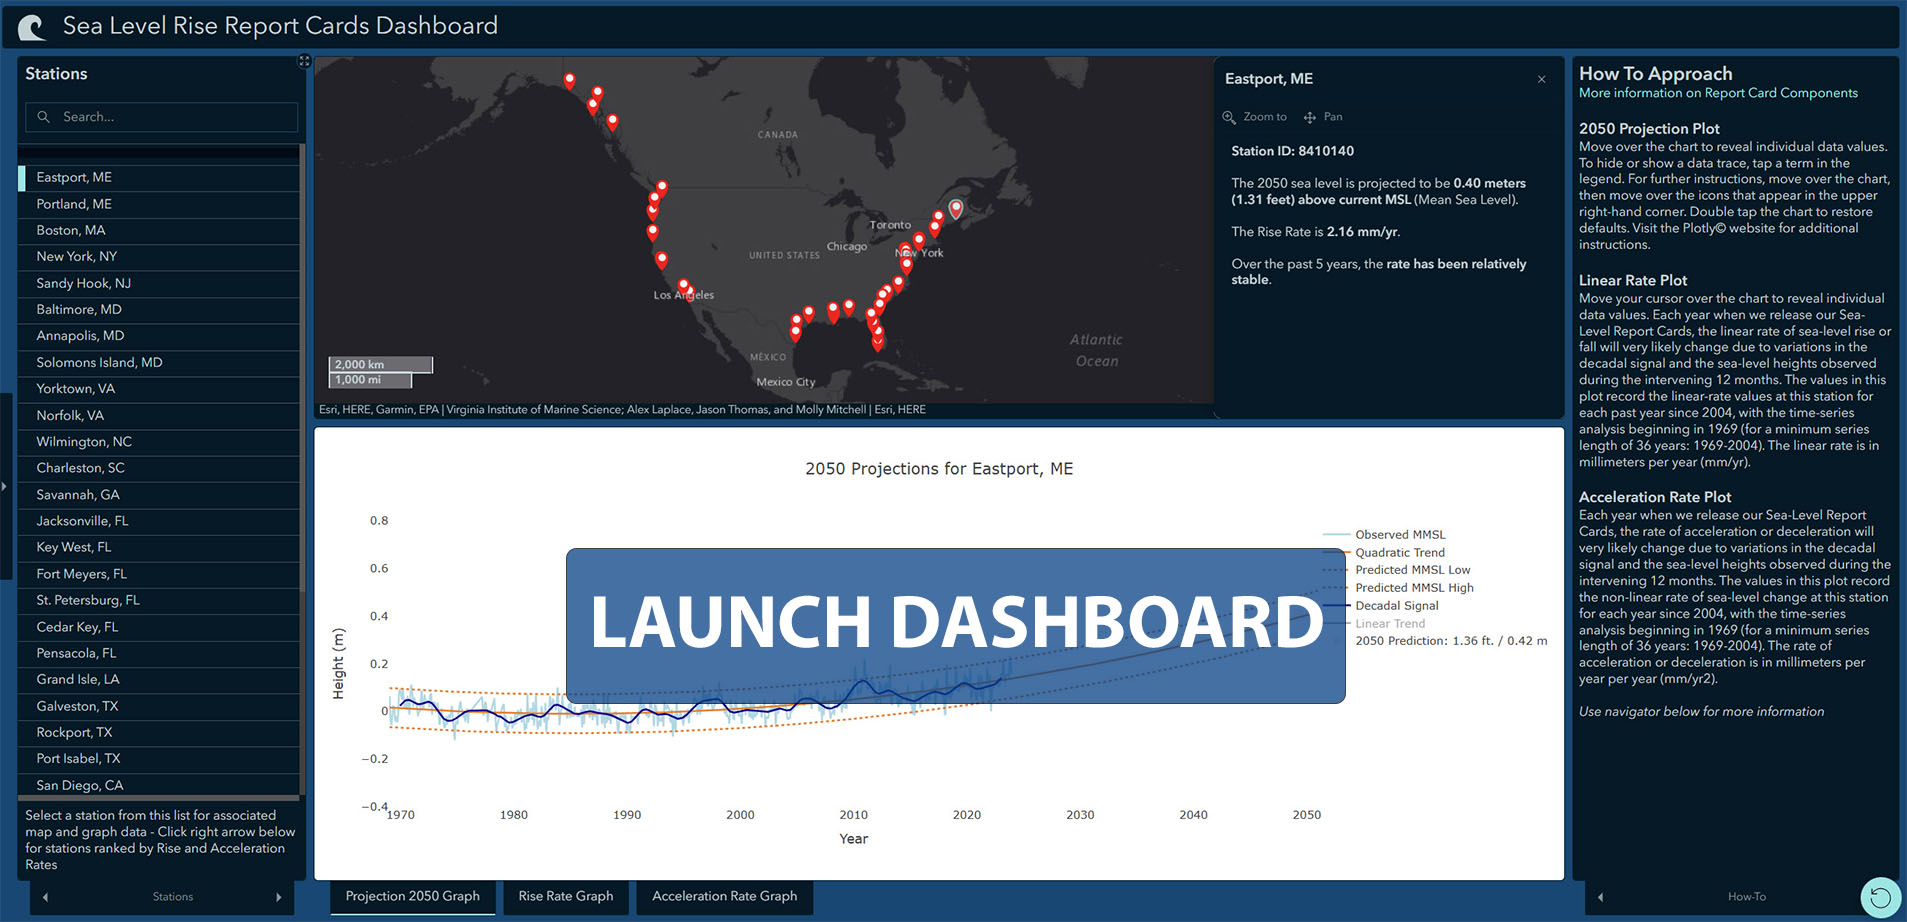
Want to know how sea level in your area has changed over time and what the future might hold? Our 'report cards' can help. Packaged in an interactive dashboard and updated each year as annual tide-gauge data become available, our report cards provide a 2050 projection, recent trends in the rates of sea-level change, and an explanation of processes affecting sea level for 36 localities along the U.S. East, Gulf, West and Alaskan coasts.
For full technical details, read our report.