A desired product of stock assessments is to develop predictive capability based on current assessments and vital rates. The year class structured demographic provides a basis for estimation of extant standing stocks in the defined sampling strata where the areas of the latter are known. This is the case for the current assessment. A forward prediction is possible if we have a substantial stock-recruit (S/R) relationship and/or a predictable range of mortality rates to apply to current standing stock. The S/R relationship for oysters has not been comprehensively examined in the literature. A variable S/R is a common feature of long-lived bivalve populations. In the absence of a robust S/R relationship an alternative approach is to estimate upper and lower bounds for age specific mortality based on prior experience and dat, and project the current age structure forward one year with those upper and lower bounds. This is a relatively crude model for fishery purposes, but it does, for example, allow the critical estimation of one-year projections of the number of sub market (small) oysters in year t (t0) that will survive to market size oysters in year t+1 (t1).
In this project, we described the population demographic in terms of biomass for young of the year (YOY, spat) and all age classes using the equations provided earlier in section 3. Thus spawning stock biomass (all ages >YOY) in year t (t0) can be compared to biomass of age 1 in year t+1 (t1). This comparison is a S/R relationship that avoids the inherent high and density dependent loss of YOY to predation before they reach age class 1. The first year class discrimination based on length has some modest error associated with the applied age 1 to age 2 boundary as discussed earlier; however, this boundary is much less problematic than, for example, the age 3 to age 4 or even the age 4 to age 5 boundary. For the purposes of developing a biomass based S/R relationship the latter boundaries are inconsequential because the ratio includes all age classes >YOY as a single unit in the S component. Thus the definition of area and year specific values of both S and R are tractable.
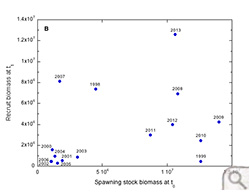
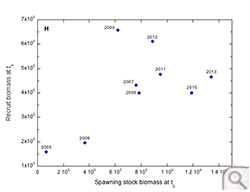
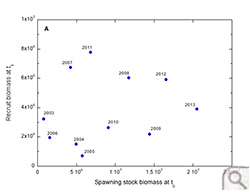
Data for each river/region is presented in separate figures. The number of stations included and areas included are described in Table 1Table 2A (area in acres) and Table 2B (area in m2). Biomass units are in grams dry tissue weight. Fits to the data plots have generally not been attempted. Recruit biomass is on the y-axis and spawning stock biomass is on the x-axis for all plots.
The Pocomoke and Tangier S/R plot covers the recruitment events from 2003 through 2013 and show a generally increasing trend. There remains a considerable scatter between 2011 recruitment biomass (7.77 x10⁶ g) from 2010 spawning stock biomass (6.82 x 10⁶ g), and 2013 recruitment biomass (3.91 x 10⁶ g) from 2012 spawning stock biomass (2.05 x 10⁷ g). The plot does not indicate a clear asymptote, but suggests density independence.
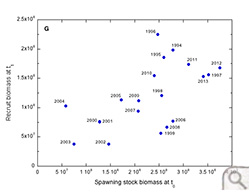
The Great Wicomico River S/R plot covers the recruitment events from 1998 through 2013. Spawning stock biomass in the Great Wicomico population is notably depressed in 2000-2005. These correspond to unusual data points in the mortality/survival data discussion later in this text. There is considerable scatter in the S/R plot with low recruit biomass in much of the 1999-2006 period. From 2007 onwards a notable increase is evident in both the recruit and spawning stock biomass. 2007 recruit biomass exceeds that of 2006 spawning stock biomass by a factor of 4.7! 2013 recruit biomass approximates that of 2012 spawning stock biomass. The system exhibits recovery over the study period, complicating any generalized statement on the nature of the S/R relationship.
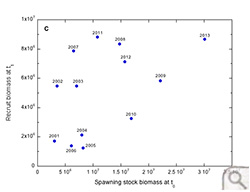
The Rappahannock River S/R plot covers the recruitment events from 2001 through 2013. The Rappahannock River surveys included an increasing number of stations (173 to 301 in the 2000-2004 period and 301-385 in 2006-2007) and area (11.12 x 10⁶ m2 to 2.06 x 10⁶ m2 in the 2000-2004 period and 2.06 x 10⁶ m2 to 2.30 x 10⁶ m2 in 2006-2007) as the study period progressed Nonetheless there is a strong suggestion of density independence in the S/R plot.
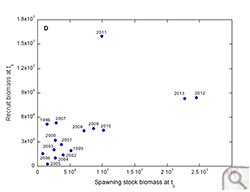
The Piankatank River S/R plot covers the recruitment events from 1996 through 2013 (minus 1997 and 1998). The corresponding area increased gradually from 7.03 x 10⁵ m2 to 8.27 x 10⁵ m2 (see Table 1) with the exception of 1999 when the sampled area was only 3.77 x 10⁵ m2. The Piankatank River exhibited low spawning stock biomass in 2004 at 1.54 x 10⁶ g. The corresponding recruitment in 2005 was comparably low at 2.60 x 10⁵ g. This period corresponds with unusual mortality/survival data for the same period as will be discussed in a later section. By contrast, a very low spawning stock biomass in 2005 (7.98 x 10⁵ g) produced a much higher recruit biomass in 2006 (1.56 x 10⁶ g). Note this is one year earlier than a similar event in the Great Wicomico River. Like the Great Wicomico record, there is a notable increase in spawning stock biomass in the later years of the survey (2007-2013) including a single data pair (spawning stock 2010 at 9.9 x 10⁶ g -recruit 2011 at 1.60 x 10⁷ g) wherein the recruit biomass exceeded that of the originating spawning stock. The S/R plot suggests density independence rather than an asymptote.
The data set for the Mobjack Bay and York River is modest in longevity and not included in the analysis.
The James River data set is extensive in both time (recruitment events from 1994 through 2013) and spatial coverage (increasing from 2.29 x 10⁷ m2 to 2.74 x 10⁷ m2 (see Table 2). The reduction in “count” or sample number over time reflects early (pre-2000, see Table 1) efforts to examine sample number versus standard error of the mean relationships as discussed in section 2. The lower spawning stock biomass in 1999-2003 (<1.5 x 10⁸ g) is epizootic and post epizootic related. The high S/R records occur in 1996 following a summer freshet that both increased the availability of clean substrate and depressed predation on post recruit to the benthos forms in 1995. The 2010-2013 period is notable for both high spawning stock biomass (>2.8 x 10⁸ g) and recruit biomass (>1.5 x 10⁸ g). The S/R plot is strongly suggestive of density independence and exhibits no asymptote.
The Elizabeth and Lafayette Rivers are modest in area (6.6 x 10⁴ m2 in 1999, 2.29 x 10⁷ m2 from 2005-2013) and sample number (14 in 1999, 21 from 2005-2013) on an annual basis. Only the 2006-2013 recruitment events are included in the current discussion and figure. With the exception of the “low” 2005 spawning stock (3.66 x 10⁵ g): 2006 recruit (1.96 x 10⁵ g) data point the S/R plot presents a cluster of data. Inclusion of the “low” data point is suggestive of density independence, exclusion of the data point offers no strong relationship in the remaining data points. In each of the rivers/regions the suggestion has been proffered of density independence in the S/R plot, that is the general absence of some environmental limitation on recruitment within the boundaries of the reported observations. The plots do not include a shell habitat parameter although parallel data are available as described in the survey methods. The suggestion that shell habitat may eventually become limiting requires careful attention and will also be addressed later, following presentation on the relationship of live to dead shell ratios in extant populations.
 The Pocomoke and Tangier S/R plot covers the recruitment events from 2003 through 2013 and show a generally increasing trend. There remains a considerable scatter between 2011 recruitment biomass (7.77 x10⁶ g) from 2010 spawning stock biomass (6.82 x 10⁶ g), and 2013 recruitment biomass (3.91 x 10⁶ g) from 2012 spawning stock biomass (2.05 x 10⁷ g). The plot does not indicate a clear asymptote, but suggests density independence.