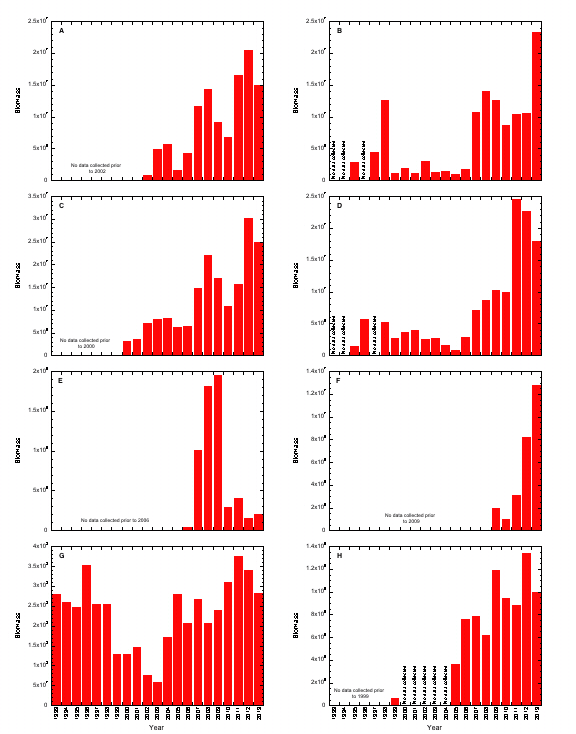
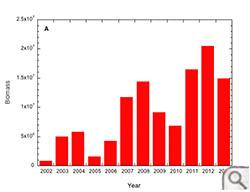
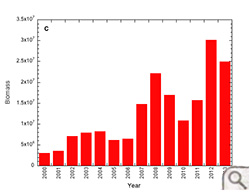
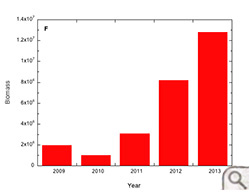
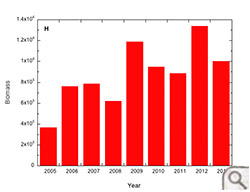
Oyster biomass data is described for defined stocks and are coincident with subdivision of the surveyed area in a north-south direction as follows: (A) Pocomoke and Tangier Sounds, (B) Great Wicomico River, (C) Rappahannock River, (D) Piankatank River, (E) Mobjack Bay, (F) York River, (G) James River, and (H) Elizabeth and Lafayette Rivers.
Data is summarized in previous graphs. Note that the scales of the y-axes are region/river specific. The unit of biomass is grams dry tissue weight. Conversion functions to other metrics are described earlier in the text. All plots begin in 1993 to provide ease of comparison between sites within the plot, even though data collection was initiated at a variety of dates: 1993 for the James River, 1995 for the Great Wicomico and Piankatank Rivers, 2000 for the Rappahannock River, 2002 for Pocomoke and Tangier, 2005 for continuous monitoring of the Elizabeth and Lafayette Rivers, 2006 for Mobjack Bay, and 2009 for the York River.
Of particular note is the long-term pattern of biomass in the James River. Biomass remained between 2.54 x10⁸ g and 3.52 x 10⁸ g between 1993 and 1998. The 1998-1999 winter was warm resulting in an intense MSX epizootic in 1999. The fall decrease in biomass was exacerbated by the occurrence of tropical storms Dennis and Floyd in September 1999 driving salinities from mid teen values to ~6 ppt for an extended period. The disease epizootic was followed by a high salinity, high recruitment year in 2002, and a wet low recruitment year in 2003. Fall 2003 was, however, notable for the passage of Hurricane Isabel and the presence, even if only in small numbers and in limited downstream locations, of predatory gastropods that had been absent since being locally extirpated by Tropical Storm Agnes in 1972. The lowest biomass was recorded in 2003 at 5.83 x 10⁷ g before a gradual recovery was observed to 3.75 x 108 g by 2011. The 2006 and subsequent years include stations downriver of Burwell Bay not covered in the pre-2006 surveys, a modest (13%) increase in total area surveyed. A modest decrease in biomass to 2.82 x 10⁸ g has been observed through 2013.
The Great Wicomico River time series illustrates modest biomass in the 1990s (no samples were collected in 1996) with highest biomass in 1998 at 6.51 x 10⁶ g. Like the James River, the warm 1998-1999 winter and high 1999 salinities resulted in a sustained epizootic event in 1999. Biomass decreased and remained low through 2006. While this may in part be epizootic related, the cause of this prolonged depression in biomass is not fully understood. From 2007 through 2012 biomass stabilized around 1.0 x 10⁷ g, with a notable increase to 2.33 x 10⁷ g in 2013.
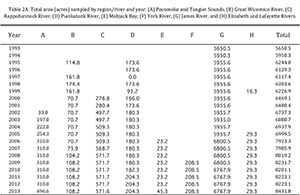
The Piankatank River, like the Great Wicomico, exhibited modest biomass in the 1990s, high salinity and an epizootic beginning in 1999, and decreasing biomass in the early 2000s to a low value in 2005, followed by a sustained increase to the highest values in 2011. This increase is commensurate with shell planting and the addition of more reefs into the survey (see Table 2A).
The Rappahannock River was the focus of extensive shell planting in the late 1990s and early 2000s. This is evident in both the shell data and increasing biomass in the 2000-2006 period. Sanctuary reefs were added to the survey footprint in 2007. Since 2007 biomass has increased dramatically in parallel with the signal observed in all of the above described river systems, in Tangier and Pocomoke, and in the Elizabeth and Lafayette Rivers.
The data series for Mobjack Bay and the York River are the shortest among those presented. Mobjack Bay biomass increased in the 2006-2009 period only to decrease afterwards. Note also a rise and decrease in shell resources over the same time period. The York River biomass illustrates an increasing trend over a stable shell base, but the time series is too short to offer generalizations.
The long-term trends in the presented data are encouraging. The major resources in the James, Piankatank and Great Wicomico Rivers have recovered following the epizootics of the late 1990s. The large watershed subestuaries like the James suffered from low salinities accompanying the passage of Hurricane Isabel in 2003. By contrast the impact in small watershed rivers such as the Piankatank and Great Wicomico was modest, and the cause of the low population estimates for this period remain poorly understood in these rivers. Careful management in concert with strategic shell planting has allowed increasing harvest to current high levels while maintaining standing stocks. In a manner similar to that of the shell resource we have arrived at a default BRP that is sustainable with careful proactive management.


 The Piankatank River, like the Great Wicomico, exhibited modest biomass in the 1990s, high salinity and an epizootic beginning in 1999, and decreasing biomass in the early 2000s to a low value in 2005, followed by a sustained increase to the highest values in 2011. This increase is commensurate with shell planting and the addition of more reefs into the survey (see Table 2A).