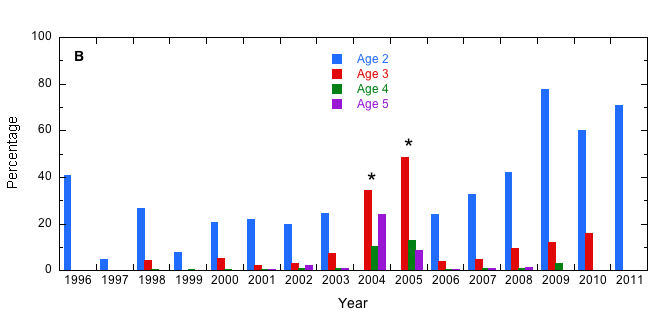
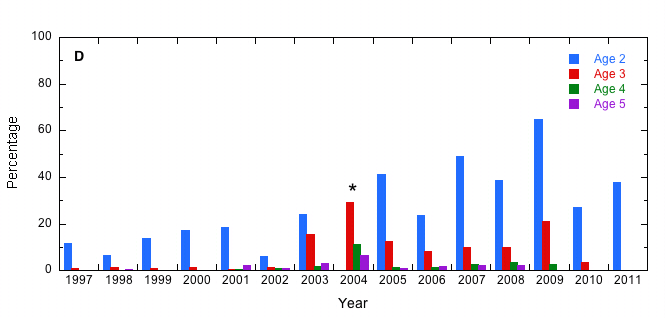
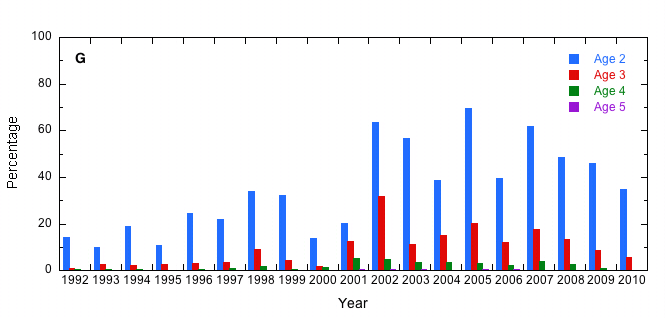
Oyster population demographics determine the long term stability of both the live and shell components of reef structures. Age-specific mortality and survival (%mortality = 100 - % survival) is reported for the Great Wicomico, Piankatank and James Rivers only because these are the only rivers where age versus length relationships are available. For the Great Wicomico River, the 2004 and 2005 age 2 survival value is driven by very low population totals for year 1 for both year classes (low year 1 in 2005 and 2006 survey respectively) and possible assignment of individuals to incorrect age classes. In the Piankatank River the 2004 age 2 survival value is driven by very low population totals for year 1 in the 2004 year class (low year 1 in 2005 survey) and possible assignment of individuals to incorrect age class. In both instances, these periods are noted on the graphics. The cause of the very low abundance in both rivers in this period is not well understood. An “epizootic signal” is also observed in the James River mortality/survival time series; however, the recovery of the oyster population in both the Great Wicomico and Piankatank Rivers occurs later than in the James River.
The current, limited analysis of age-specific survival/mortality would clearly benefit from additional age v length relationships to expand the discussion. A depressed population census drives error possibilities in the survival estimates for both the Piankatank and Great Wicomico Rivers. The nature of these errors is discussed in Mortality Estimates. Notably, after these periods of low population census the survival rates post age 1 appear to increase. Is this a fundamental result of heavy selection during the preceding disease epizootic period? Disease monitoring of these major subestuaries indicate no decrease in disease weighted prevalence post 2000, so the observed increase in survival estimate is not associated with a decrease in disease pressure.
A notable trend in the long-term stock assessment data is the observation of earlier recruitment post 2000 in all three systems addressed by the survival data herein. The earlier recruitment results in larger YOY at the end of the year. The age versus length estimators presented earlier were developed with post 1998, and predominantly post 2000 data, so the observed “shift” in length demographics should not compromise assigning individuals to the correct year classes.