WHAT CAN WE DO TO HELP?
What can YOU do?
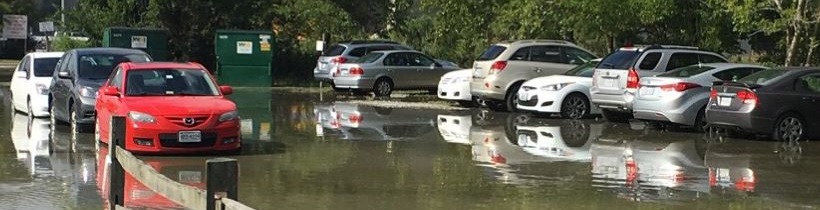
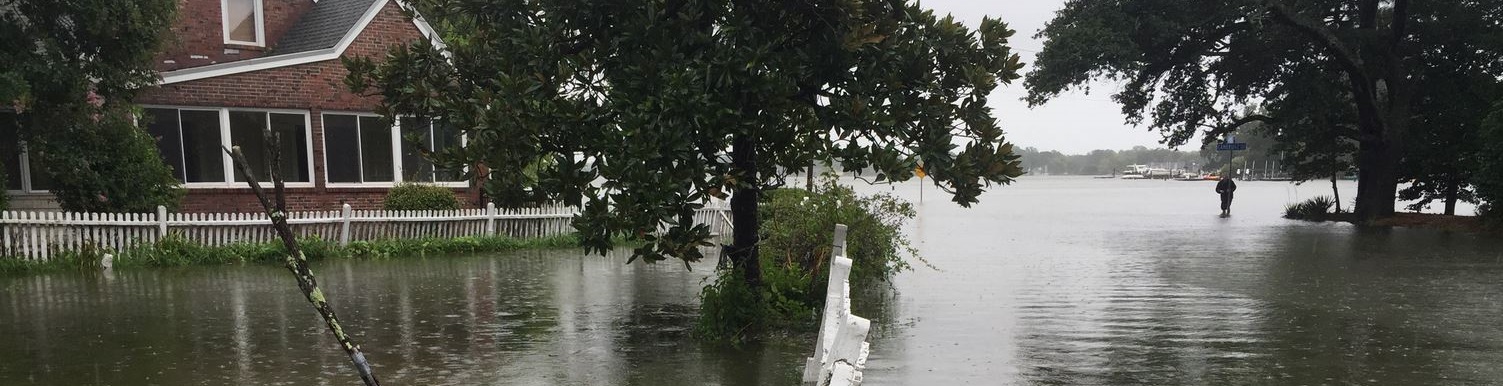
Rising sea levels require individuals and coastal communities to think differently about how they live, work, and play along the coast. Successfully solving the climate change and flooding problem will depend on everyone doing their part ... small changes by individuals can add up to big improvements world-wide.
Reduce Your Carbon Footprint ...
A carbon footprint is the total amount of greenhouse gas emissions that come from the production, use and end-of-life of a product or service. Food, transportation and housing make up a large portion of individual consumption - the more you use, the larger your personal carbon footprint. You can reduce your footprint by reducing, reusing and recycling! Calculate your carbon footprint here.
Here are some of the easiest ways you can start to shrink your carbon footprint:
FOOD
- Reduce meat and dairy in your diet. A large proportion of greenhouse gas emissions comes from food production, and meat and dairy are associated with much higher carbon emissions than plant-based food.
- Cook at home. Food bought in restaurants has a wider footprint because of the emissions associated with operations like heating and lighting. Food from takeout has additional packaging and additional transport emissions.
- Buy local and seasonal food.
- Buy foods in bulk when possible using your own reusable container.
- Reduce your food waste by planning meals ahead of time, freezing the excess and reusing leftovers.
- Compost your food waste if possible.
- Grow your own food.
|
TRANSPORTATION
- Drive less. Walk, take public transportation, carpool, or bike to your destination when possible.
- If you must drive, avoid unnecessary braking and acceleration. Some studies found that aggressive driving can result in 40 percent more fuel consumption than consistent, calm driving.
- Take care of your car. Keeping your tires properly inflated can increase your fuel efficiency by three percent; and ensuring that your car is properly maintained can increase it by four percent. Remove any extra weight from the car.
- Combine errands to reduce your time on the road.
- Use traffic apps like Waze to help avoid getting stuck in traffic jams.
- On longer trips, turn on the cruise control, which can save gas.
- Use less air conditioning while you drive.
- If you’re shopping for a new car, consider purchasing a hybrid or electric vehicle. But do factor in the greenhouse gas emissions from the production of the car as well as its operation. Some electric vehicles are initially responsible for more emissions than internal combustion engine vehicles because of manufacturing impacts; but they make up for it after three years. This app rates cars based on their mileage, fuel type and emissions from both the production of the car and, if they are EVs, from generating the electricity to run them.
- Avoid flying if possible; on shorter trips, driving may emit fewer greenhouse gases.
- Fly nonstop since landings and takeoffs use more fuel and produce more emissions.
- Go economy class. Business class is responsible for almost three times as many emissions as economy because in economy, the flight’s carbon emissions are shared among more passengers; first class can result in nine times more carbon emissions than economy.
|
HOME
- Do an energy audit of your home. This will show how you use or waste energy and help identify ways to be more energy efficient.
- Change to LED light bulbs. Incandescent bulbs waste 90 percent of their energy as heat compared to light emitting diodes (LEDs). Though LEDs cost more, they use a quarter of the energy and last up to 25 times longer. They are also preferable to compact fluorescent lamp (CFL) bulbs, which emit 80 percent of their energy as heat and contain mercury.
- Switch lights off when you leave the room and unplug your electronic devices when they are not in use.
- Turn your water heater down to 120˚F.
- Install a low-flow showerhead to reduce hot water. Taking shorter showers helps, too.
- Lower your thermostat in winter and raise it in summer. Use less air conditioning in the summer; instead opt for fans, which require less electricity.
- Wash your clothing in cold water.
- Conserve water by watering lawns in morning/evening, preventing dripping faucets/plumbing, turning the tap while brushing your teeth, and by only using dishwashers and washing machines when you have a full load.
|
|
Get Involved ...
- "Catch the King" is the world's largest environmental survey. With the goal of improving predictive models and the future forecasting of "nuisance" flooding, citizen scientists use GPS to collect flood data during the King Tide (the highest yearly tidal event) throughout coastal Virginia. Find out more, and sign up to help!
- Let your representatives know you want them to take action to phase out fossil fuels use and decarbonize the country as fast as possible.
|
What is CCRM doing?
CCRM has been at the forefront of climate change and sea-level rise research in Virginia. We share our information through publications and tools and translate this science to managers and policymakers to influence positive change for all of us.
Informing Policy ...
CCRM recommendations:
- Sea Level Rise Projections: A report for the Governor’s Coastal Climate Resiliency Plan – February 2019 (pdf)
- Recurrent Flooding Study for Tidewater Virginia. Mitchell, M., C. Hershner, J. Herman, D. Schatt, E. Eggington and S. Stiles. 2013. Virginia Senate Document No.3. Richmond, Virginia. Report. (pdf)
|
Research ...
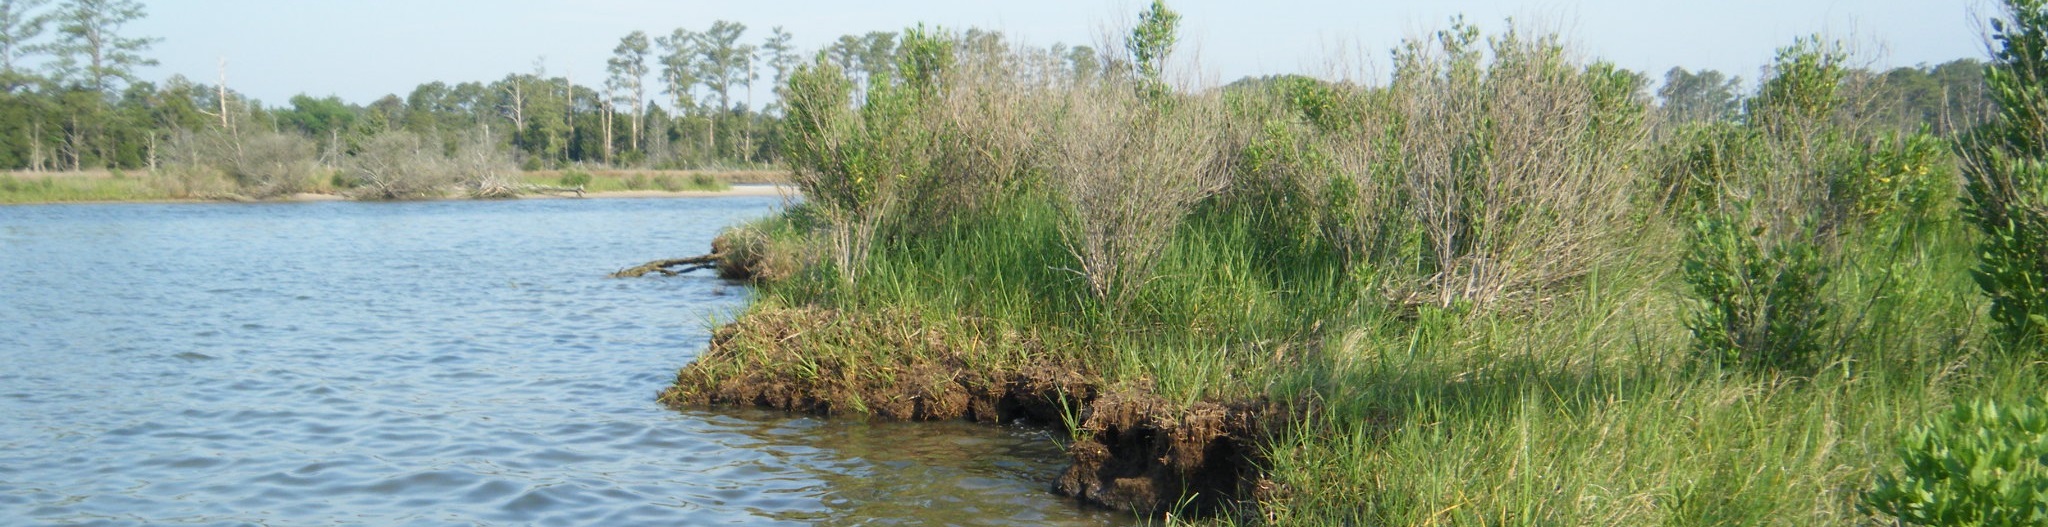
Using natural and nature-based solutions to protect a shoreline has numerous benefits for the environment and society, yet armoring is still the most common choice of property owners. A CCRM study looks at both natural and social science investigations to examine why this is happening. This study characterized the Shorescape Social-Ecological System to determine what elements have the greatest influence on the future sustainability of shoreline ecosystem services.
|
Tools ...
1. AdaptVA is a web portal (single-point of access) for evidence-based planning for everyone engaged in climate adaptation. AdaptVA focuses on the physical and social vulnerabilities by integrating the best available science, legal guidance, and planning strategies through the use of interactive map viewers, story maps and policy guides. (more information) (webpage)
- What financial incentives are there to help coastal communities?
- What are the social characteristics (poor, elderly, etc) in flood prone areas?
- What is Virginia's policy on stormwater management?
2. Locality Road Flood Tool (2021) is an interactive map for incorporating current and future road flooding into locality planning efforts. This tool shows how flood frequency will change over time and which additional areas will be inaccessible during the time of the flooding because some portion of their road network is underwater. (webpage) (tool)
- Will it be hard for emergency services to access this property during storm flooding?
- How frequently will flooding impact access to this property in 20 years?
3. Sea-Level Report Cards have 3 components: the 2050 projection, recent trends in the rates of sea-level change, and an explanation of the processes affecting sea level at each of 32 localities along the U.S. East, Gulf, and West coasts. They will be updated by VIMS each year as annual tide-gauge data become available. (webpage)
- How will sea level change in the next decade?
- What are the long-term processes that affect sea level?
- How does predicted sea-level rise in Norfolk, VA compare to Key West, FL?
|
|
What is VIRGINIA doing?
Virginia’s first step toward reducing risk to people and property from sea-level rise and coastal flooding:
Sea-Level Rise Policy ...
- Increasing Virginia’s Resilience to Sea Level Rise and Natural Hazards – Executive Order 24 was signed by Governor Ralph Northam on November 2, 2018. It outlines the main objectives for building the state's resilience to the effects of sea level rise, natural hazards and extreme weather events and led to the following framework document.
- Virginia Coastal Resilience Master Planning Framework establishes the goals, objectives, guiding principles, and key actions the Commonwealth will pursue to enhance costal resilience, with a focus on protecting key assets, developing cost-effective strategies, conserving and enhancing natural flood controls, and ensuring equity for underserved communities.
|
|