To this juncture the data has focused on recruitment to age 1 in the development of S/R descriptors. Traditionally there has been a long-standing interest in the recruitment of YOY (spat) on either extant shell substrate or recently added shell (shell planting). Two summary presentations are presented of the whole VA data set where individual (year mean for identified region or river) combinations of values for brown shell, live oyster shell (see Liveshell vs Deadshell) and YOY are available. Additionally, the data is presented by area specific plots.
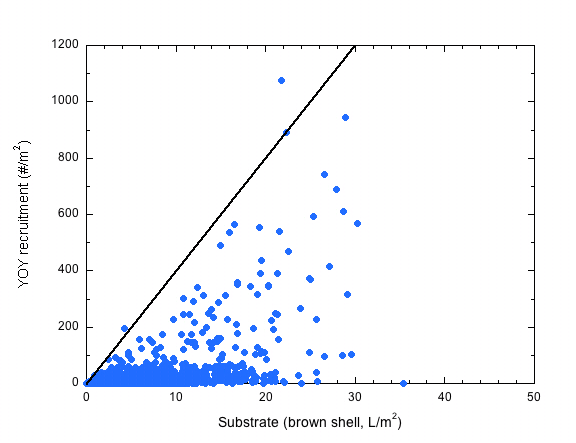
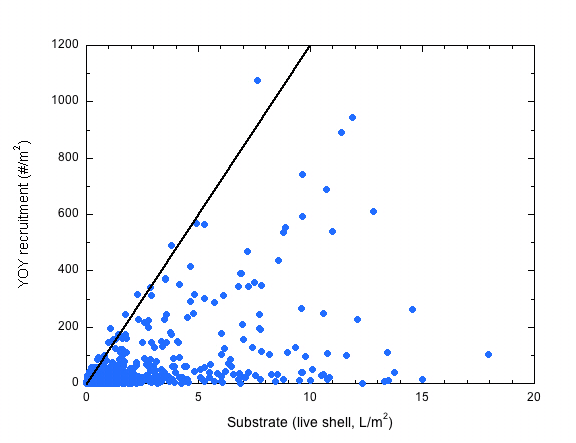
The summary data set includes 1478 x-y points. These are presented in two plots without discrimination with respect to year or source. In both instances of YOY versus brown shell substrate and YOY versus live shell a descriptive line is added suggesting a saturation situation – that is recruitment can occur up to a maximum density per unit volume of substrate. The suggested line approximates to 40 YOY/L for brown shell and 120 YOY/L for live substrate. Recall, however, from the plots in Liveshell vs Deadshell that the brown shell : live shell ratio is region or river specific. Also consider that the above values can be expressed as approximate number of spat per bushel as employed in the seed oyster fishery by multiplying the value by 50 (1 VA bushel approximates 50L). Thus a 40 YOY/L for total substrate becomes 2000 spat per bushel. This would be considered an exceptional seed source – 1000 spat per bushel is generally considered very good.
Of concern in both summary plots is the number of points that are far removed from the proposed saturation line. Is this driven by prior fouling of the shell surface or by the lack of available larvae to compete for the substrate? One line of future analysis to clarify this question would be a comparison of specific stations where both assessment stations and shellstring recruitment data (see Shellstring Spatfall) are available.
Figure 5.1: Total brown shell substrate (L/m2) versus YOY recruitment (#/m2) inclusive of all years and regions.
Figure 5.2: Total live shell substrate (L/m2) versus YOY recruitment (#/m2) inclusive of all years and regions.
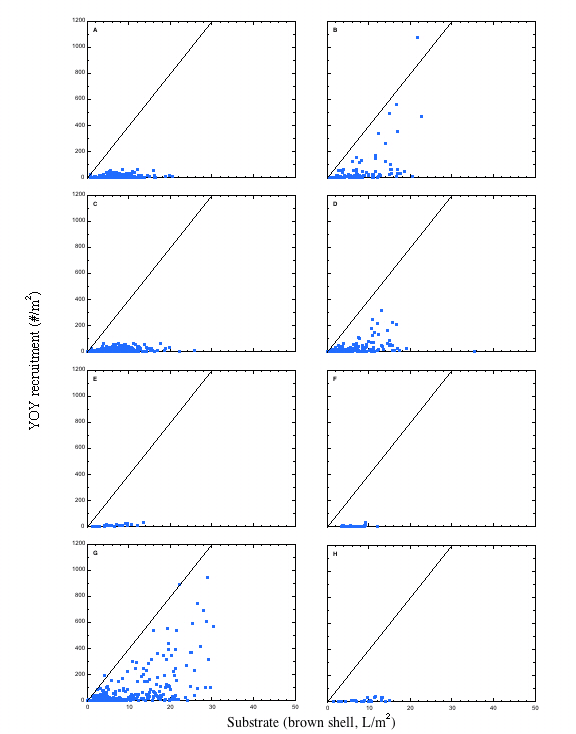
Figure 5.3: Total brown shell substrate (L/m2) versus YOY recruitment (#/m2) for each of the defined regions (A) Pocomoke and Tangier Sounds, (B) Great Wicomico River, (C) Rappahannock River, (D) Piankatank River, (E) Mobjack Bay, (F) York River, (G) James River, and (H) Elizabeth and Lafayette Rivers.
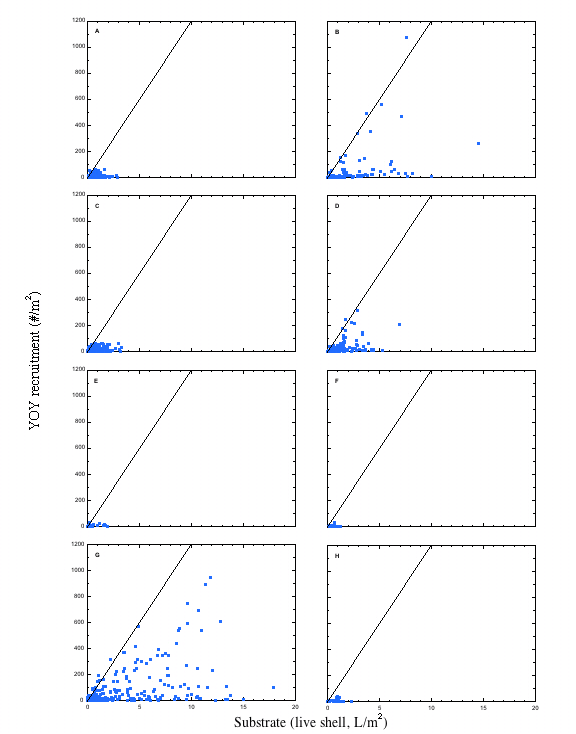
When the recruitment versus shell data are considered on an area specific basis striking variation is observed. Plots for the Great Wicomico, Piankatank and James Rivers (panels B, D and G in figures) illustrate a scatter of points from close proximity to the x axis to the “saturation line” described for the all area summary plots. The remaining areas (panels A, C, E, F and H) illustrate no such spread in the data points with increasing substrate availability having comparatively modest impact on recruitment. Whether this is the product of limited larval supply, intense early post larval mortality, or a combination of both is worthy of additional investigation. The general observation is in agreement with that of Andrews (1979) that the Great Wicomico and Piankatank Rivers are “trap type” estuaries, and that the Burwell Bay area in the James River also experiences retentive circulation.
Figure 5.4: Total live shell substrate (L/m2) versus YOY recruitment (#/m2) for each of the defined regions (A) Pocomoke and Tangier Sounds, (B) Great Wicomico River, (C) Rappahannock River, (D) Piankatank River, (E) Mobjack Bay, (F) York River, (G) James River, and (H) Elizabeth and Lafayette Rivers.