U.S. East Coast Sea Level
Annual Values & Processes
Trend Values for 2024
Processes
The dominant processes affecting the variability of sea-level rise along the U.S. East Coast are summarized below. Learn more by expanding the dropdowns and visiting our Processes page.
Steric ProcessesAt present, steric processes—primarily an increase in the volume of seawater as it warms—contribute relatively uniformly to sea-level rise at tide stations along the U.S. East Coast. |
Glacial Isostatic Adjustment (GIA)
|
Water Storage/WithdrawalTwo anomalies in East Coast tide-gauge records suggest an influence of water storage and withdrawal practices (Karegar et al. 2017). A “southern anomaly”—with the highest subsidence rates along the entire East Coast—affects Norfolk, Virginia, Wilmington, North Carolina and Charleston, South Carolina. This is attributed to excessive groundwater withdrawal between the late 1970s and early 2000s, followed by a recovery. A “northern anomaly” impacts Eastport and Portland, Maine, where geologic loading from water storage above a dam contributes to local subsidence. |
Ice Sheet Melting (Greenland and Antarctica)
At New England tide stations, the gravitational effects of Greenland’s loss of ice-sheet mass slightly counteract (-0.03 mm/year) the 0.15 mm/year of sea-level rise contributed by its meltwaters. Moving south, this contribution reverses. By Florida, the effects of gravitational loading contribute a small amount (0.1mm/year) to sea-level rise (Mitrovica et al. 2001). Contributions to sea-level acceleration from melting of the Greenland and Antarctic ice sheets exceed those from ocean dynamics (including steric processes) and air-pressure effects at all stations south of Sandy Hook, New Jersey, and become relatively more important south of Norfolk, Virginia (Davis and Vinogradova 2017). In addition, the specific origin of glacial melt may affect the geographic distribution of its contribution to sea-level rise. For example, contributions to sea-level rise at the New York gauge can be connected to melting of the North-East Greenland Ice Stream, and the sub-continent’s Petermann and Humboldt glaciers (Larour et al. 2017). |
Ocean DynamicsEzer et al. (2013) suggest that a recent slow-down in the Gulf Stream has contributed to higher sea levels along the U.S. East Coast, with the magnitude greatest at Cape Hatteras (between Norfolk, VA and Wilmington, NC) and decreasing northward. Kopp (2013) links acceleration in this area to the Atlantic Multidecadal Oscillation, North Atlantic Oscillation, and Gulf Stream North Wall indices. The long-term prognosis for changes in these dynamic processes are yet unresolved, hampering projections. |
Other FactorsPiecuch and Ponte (2015) suggest that a string of low-pressure systems may be significantly impacting year-to-year variations in sea level along the U.S. East Coast by generating extreme upsurges in sea level. They suggest this may account for ~50% of sea level rise in New England during 2008 and 2010 and 10-30% of decade-scale sea-level accelerations in the mid-Atlantic “hot spot” (Boon 2012, Ezer and Corlett 2012; Sallenger et al. 2012). However, Davis and Vinogradova (2017) found this effect to be nil in the south and small (0.05 mm/yr) in the north; we thus believe it impacts short-term variability more than long-term sea-level rise. |
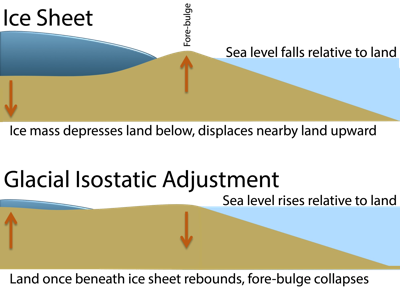 This process is causing most of our East Coast tide stations to subside (and thus relative sea level to rise). Exceptions are
 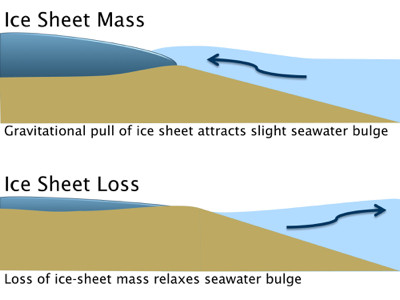 Ice sheets contribute to sea-level rise as they melt and calve, and as their consequent loss of mass decreases their gravitational pull on adjacent waters.