
'Catch the King' Tide
App-Observed King Tide Extents vs. Nov. 4th Forecast of Predicted Maximum Flooding Extents, 08:00-11:59 AM EDT
"Catch the King" is a citizen science GPS data collection effort centered in Hampton Roads, VA, seeking to breadcrumb or map the King Tide's maximum inundation extents to validate and improve predictive models and future forecasting of increasingly pervasive "nuisance" flooding. GPS data points collected by volunteers effectively breadcrumbed the high water line during the high tide period of maximum flooding extent, and appear on the map in blue. Red points correspond with Tidewatch and StormSense water level sensors, for direct comparison with model forecast results below. To see the forecasted maximum flooding extents for Saturday, 11/04/2017, from 08:00-11:59 AM EDT, use the embedded interactive map below. These forecasts are advised by VIMS' hydrodynamic models and by Tidewatch.
Map of Model-Predicted Flooding Extents
Comparing Flood Impacts
Aside from time-stamped geotagged images collected by volunteer users of the App, there are new water level sensors throughout Hampton Roads like the one depicted in the image below-- used to detect street inundation in Norfolk's Hague. These are also compared with model results to verify inundation timing and depths.
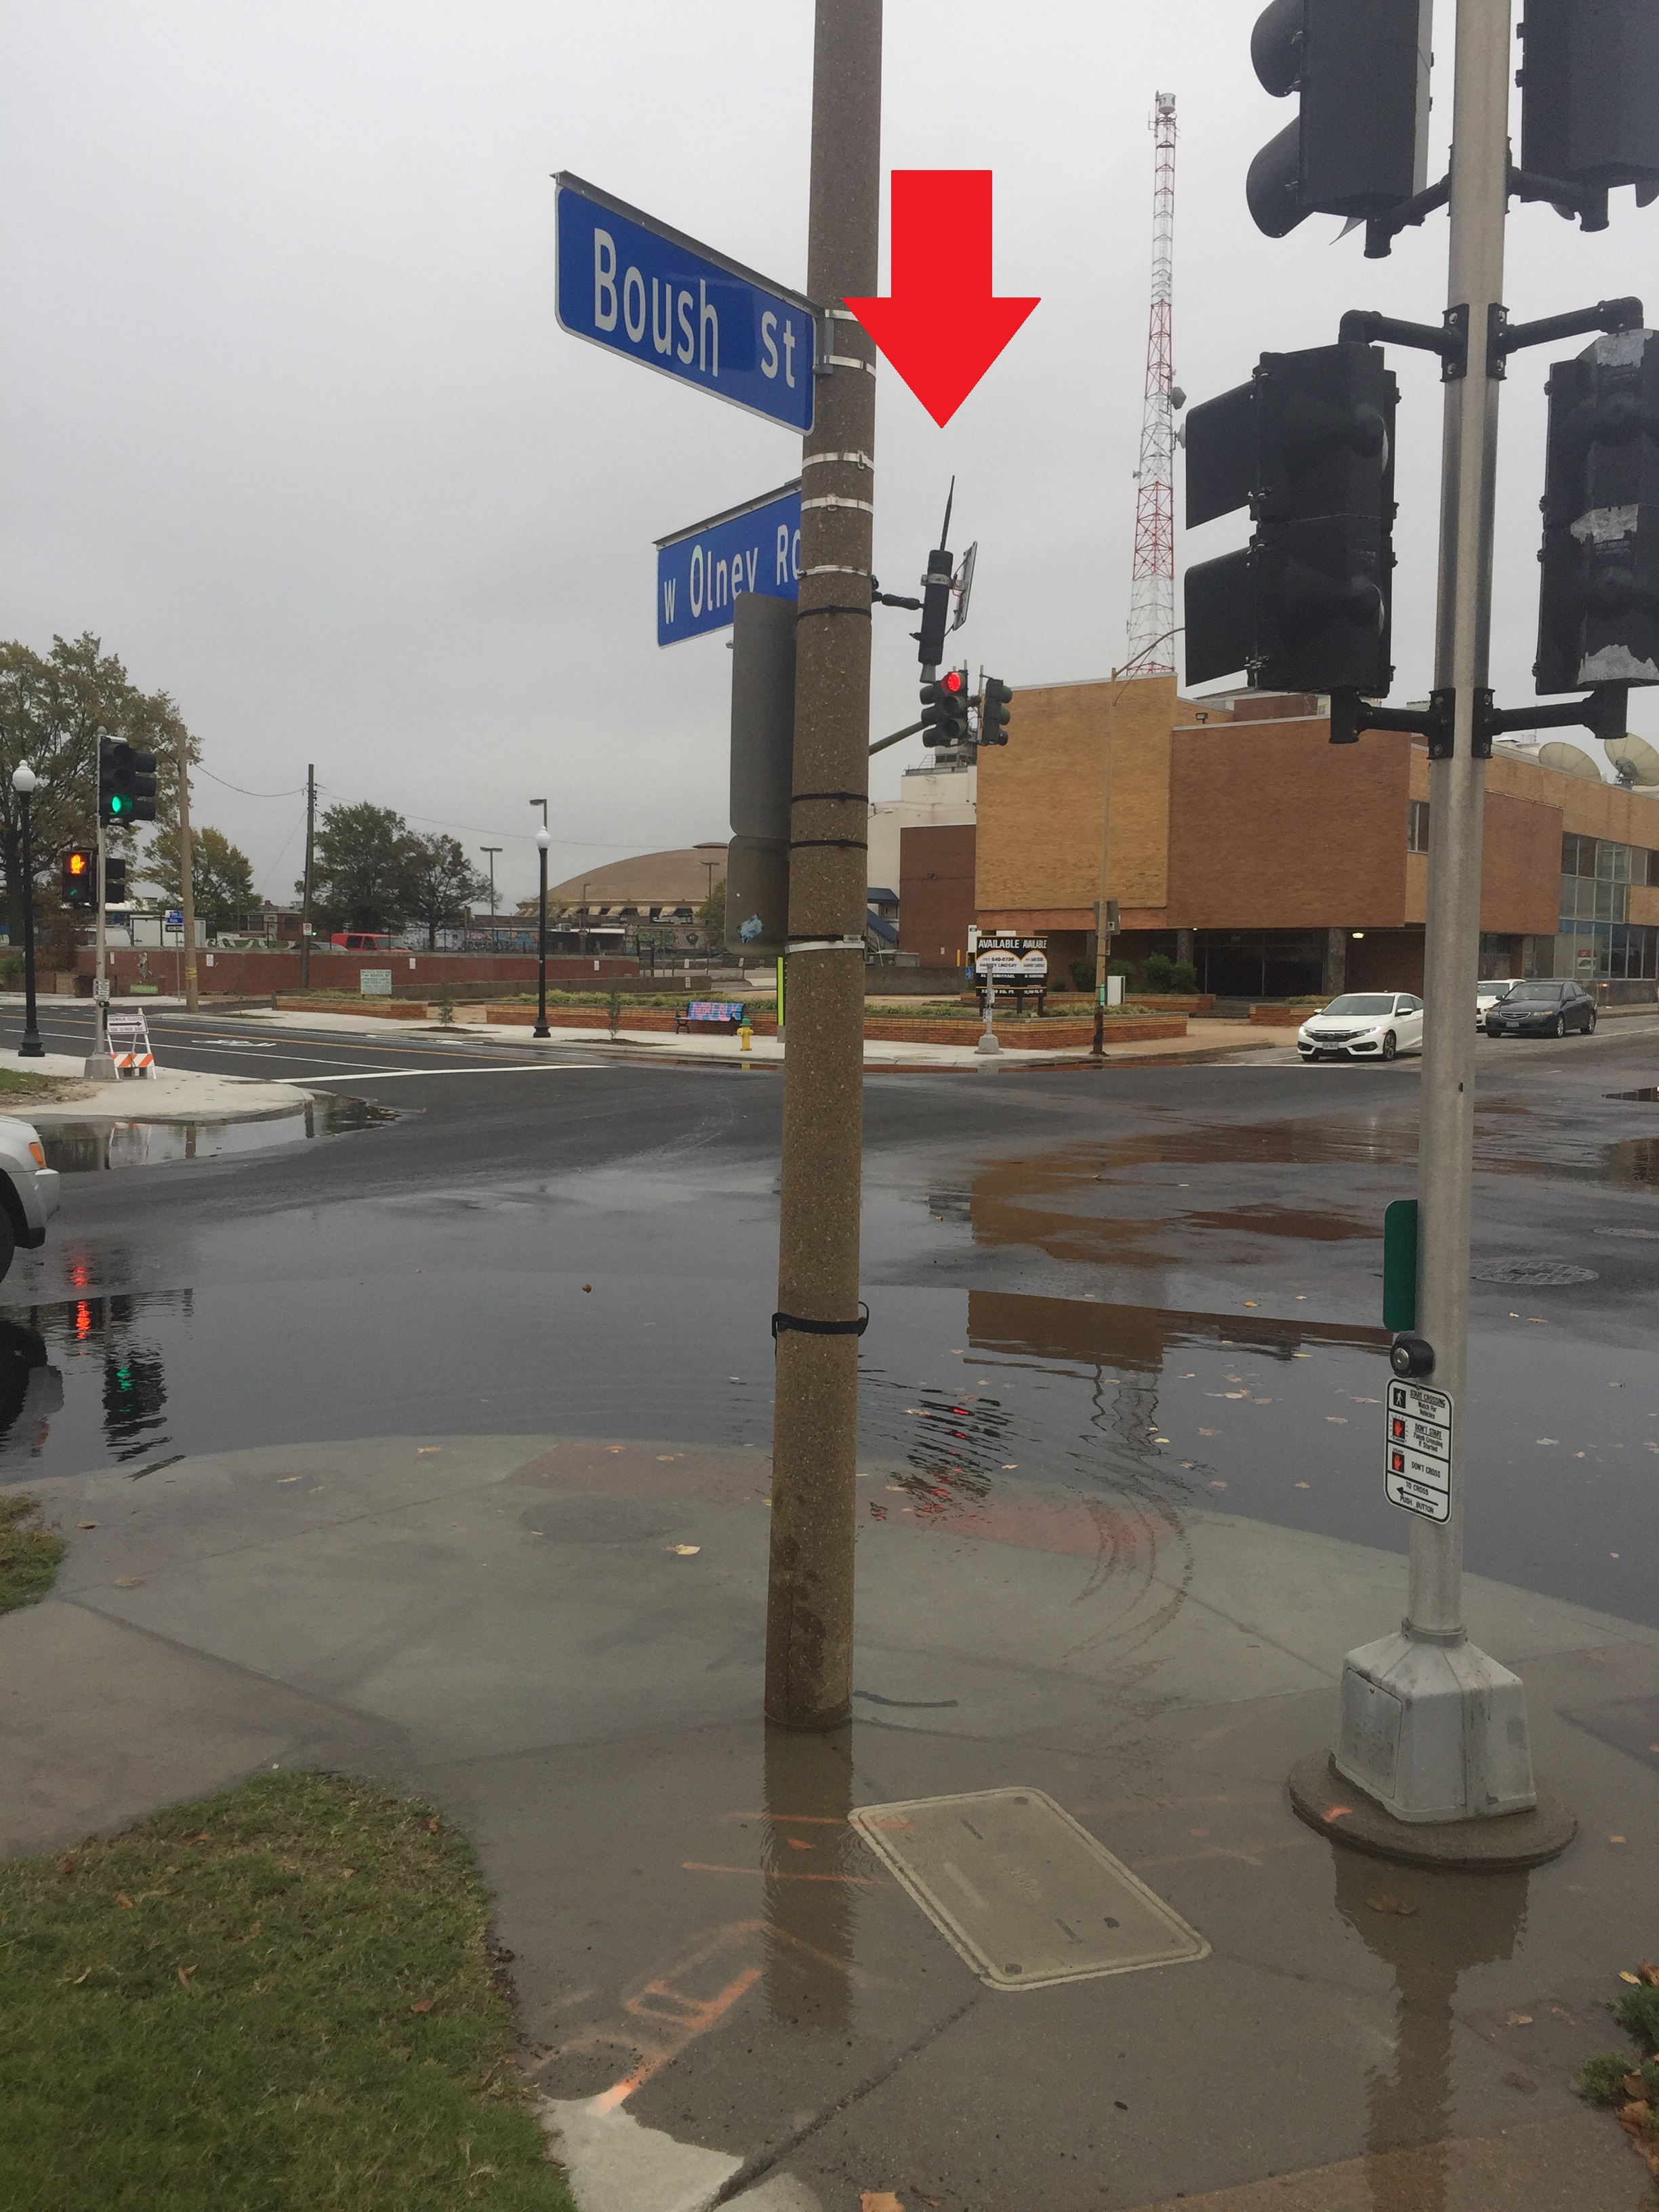
These forecasts were shared with the volunteers via social media the day before the flood event to aid in directing their mapping to places where inundation was reported by the model to aid in ensuring its accuracy. The flood forecast web map above is publicly available and users can see the flood forecast data in the field for ease of verification, as shown on the cell phone image below near the Chrysler Museum in Norfolk.

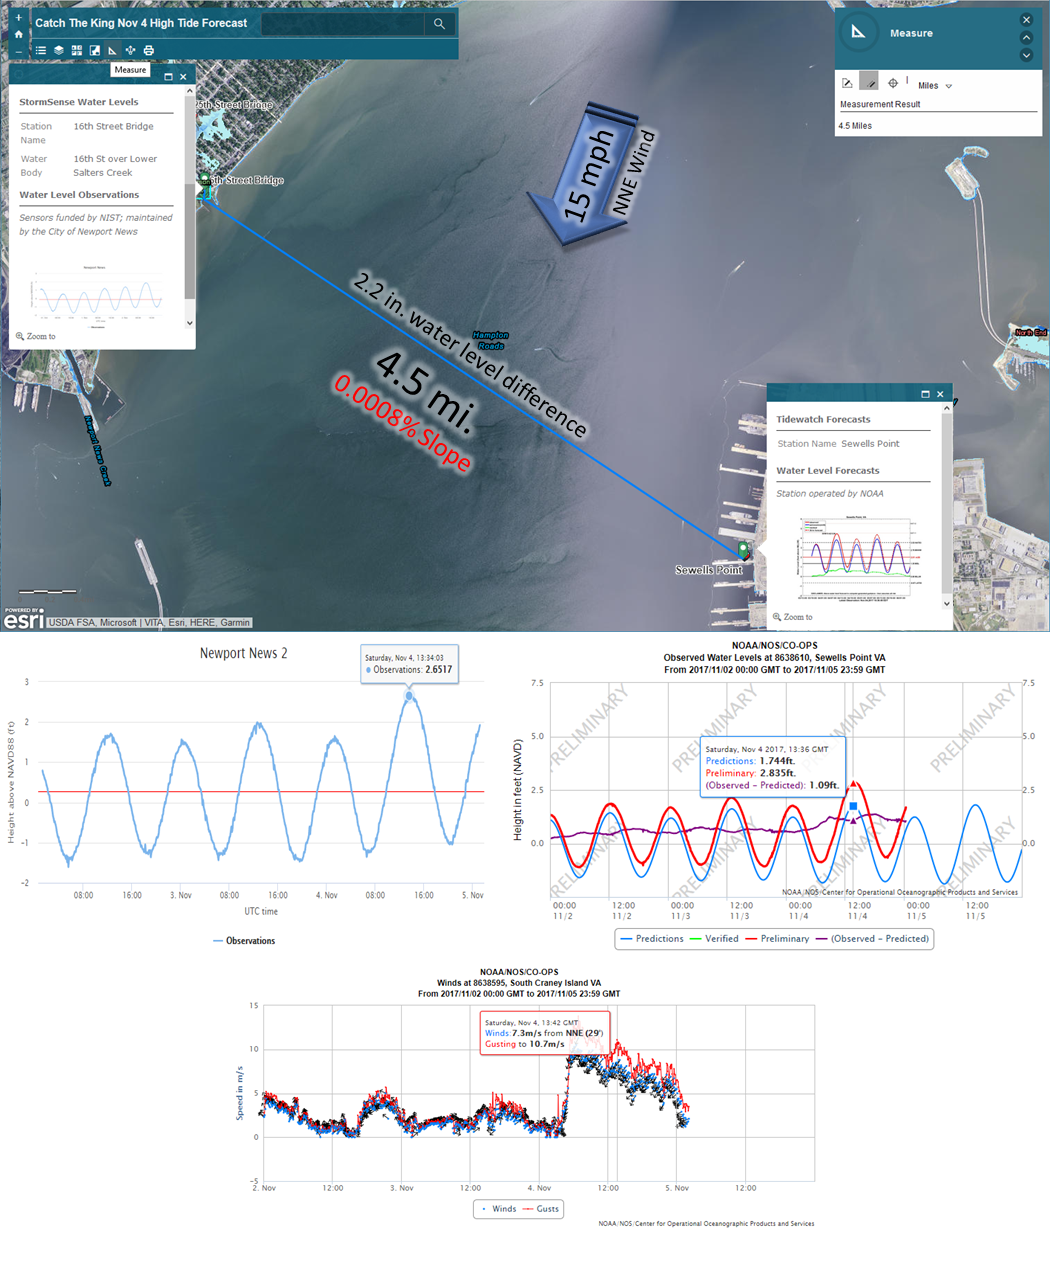
Flood viewer results are shown below, alongside NOAA water level and wind data, and StormSense water level data from Nov. 4th. These aggregated sensor data plots highlight remotely-sensed observations during the during the peak tide period at Hampton Roads Crossing at 9:34 AM EDT. A 2.2 in. detected difference in surface water elevations accounts for a very slight 0.0008% slope toward Norfolk, attributed to a ~16mph wind from the NNE.
A 2nd-opinion distance calculation in 3-D, is depicted below, using Google Earth. The 2.2 in. setup of water on the Norfolk side of the James River resulted in slightly more flooding on the south side of Hampton Roads on Sat. Nov. 4th during the King Tide weekend. Both sensors are vertically calibrated x-band radar sensors, accurate in to ~+1mm in laboratory settings, ~+3 mm with minor wind.
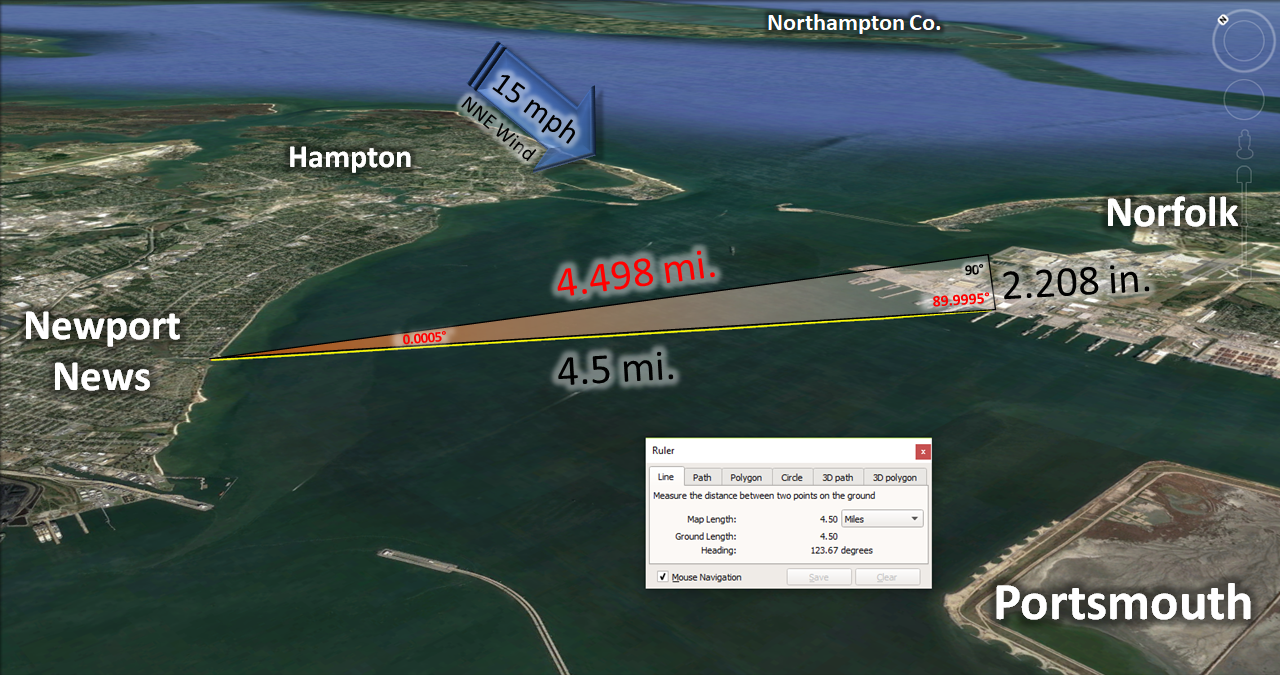
A 2nd-opinion distance calculation in 3-D, depicted using Google Earth. Water level set up (triangle) not to scale.
Volunteers can participate by downloading the "Sea Level Rise" application onto their smartphones, and on the morning of November 5th, 2017, use the app to trace the high tide line from varying locations. The data will be collected and used to help scientists, educators, and community leaders better understand the risks imposed by the rising tide. To learn more about how the Commonwealth Center for Recurrent Flooding Resiliency is working to help address these issues, visit: http://www.floodingresiliency.org/.