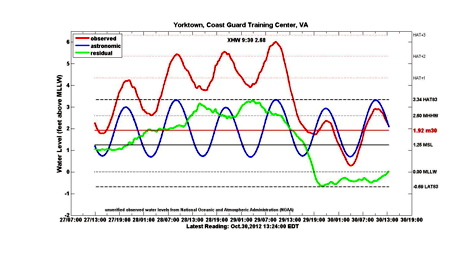
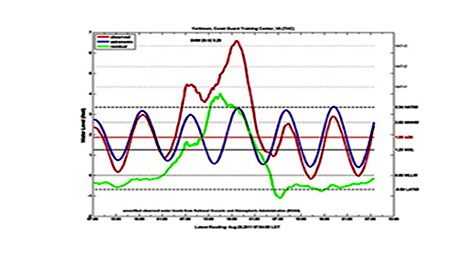
These graphs below show the difference in measured water levels for the Tidewatch tide station at the Yorktown Coast Guard Training Center during the passage of two recent hurricanes. The left-hand image was generated during the passage of Hurricane Sunday between October 27 and 29, 2012, while the right-hand image was captured during the passage of Hurricane Irene in late August 2011. See Tidewatch for details on how these charts are generated and read.