

2025 Preliminary SAV Executive Summary
The 2025 distribution of submerged aquatic vegetation (SAV) in Chesapeake Bay and its tributaries was mapped from aerial multispectral digital imagery and satellite imagery. The aerial imagery was acquired between June and November 2025, with a resolution of 24 cm, encompassing 193 flight lines.
Chesapeake BayFor 2025, 33,576 hectares (82,989 acres) of SAV were mapped in Chesapeake Bay and its tributaries. SAV increased 8% relative to 2024 from 31,093 ha (76,835 ac) to 33,576 ha (82,968 ac) in the regions mapped for both years. In order to ensure a valid analysis of change in SAV distribution and abundance with 2024, all direct comparisons to previous years in this report are restricted to only those regions that were mapped in both 2024 and 2025. Due to a combination of extended poor weather conditions, access restrictions, equipment failure, and the Federal goverment shutdown usable aerial imagery was not acquired in 2025 for several portions of the Bay. Commercial satellite imagery provided some coverage, but some areas, including portions of the Virginia Eastern Shore, Chickahominy River, Mattaponi, and Pamunkey rivers were not fully covered. The area that was not fully mapped in 2025 supported 2,596.81 hectares of SAV in 2024 (6,416.96 acres, 7.7% of the Bay total). Additional imagery was acquired from Maxar, NAIP, and Planet Labs in order to provide a more complete dataset for Chesapeake Bay. These imagery sources and their locations are detailed below:
SAV increased in two salinity zones (Mesohaline, and Polyhaline) and decreased in the other salinity zone (Tidal Fresh, Oligohaline). In 2025, SAV increased in 40, decreased in 19, and remained unvegetated in 34 of the 93 CBP segments.
Significant increases and simultaneous decreases in different regions of the Bay resulted in a small net increase in total SAV coverage between 2024 and 2025 (8% increase, 2,482 hectares, 6,134 acres). The Polyhaline and Mesohaline zones saw significant increases in SAV, there was a modest decrease in the Oligohaline zone, and the Tidal Fresh zone suffered significant declines. The Polyhaline zone increased 13% relative to 2024 (1,164 hectares, 2,875 acres). Segments across the Polyhaline all increased with the largest gains (hectares/acres) occurring in Mobjack Bay, Poquoson Flats, and nearby Western Shore areas. Significantly, this is the most SAV reported in the Polyhaline Zone in the history of the survey, surpassing the record set last year. Observed gains are largely attributable to eelgrass and widgeon grass. Eelgrass increases add to a pattern of consecutive year over year increases in the Polyhaline since the 2019 crash and continued extension of the meadows into deeper waters, consistent with ongoing reductions in water column light attenuation documented in the CBP tidal water quality monitoring dataset. Increases in widgeongrass in the mesohaline are likely driven by similar processes as well with moderate spring rainfall. The multi-species Oligohaline was largely stable but the Tidal Fresh Zone showed a sizeable decrease, the first such decline observed in several years. Decreases in Tidal Fresh regions, which are spatially disconnected from one another, were especially notable in western shore tributaries of Virginia such as the upper Rappahannock. These decreases, largely comprised of losses of Hydrilla verticilata, have occurred within the past several years in multiple adjacent river basins. The mechanisms driving these declines remain unidentified, however, they are comparatively small and offset by larger gains in the higher salinity waters. These contrasting changes observed throughout the system reflect the incredible diversity of geographic regions, land-use regimes, SAV species, and local environmental conditions that contribute in aggregate to Baywide SAV status each year. |
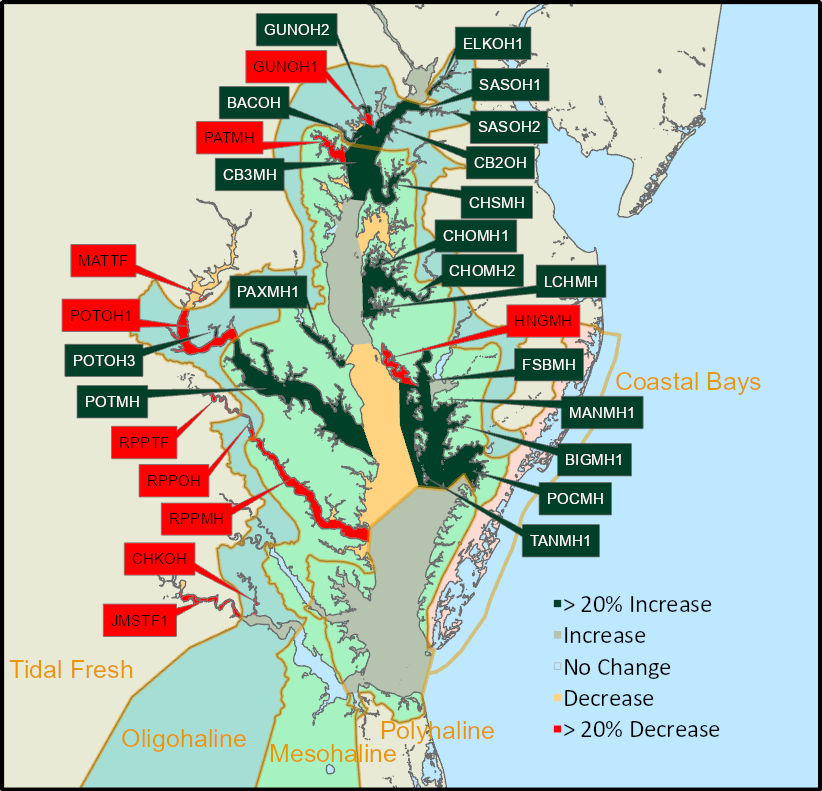
Tidal Fresh Bay Salinity ZoneIn the Tidal Fresh Bay Zone (19 CBP segments), 7,140 hectares (17,643 ac) of SAV were mapped for 2025. Comparing the same mapped regions between 2024 and 2025, SAV decreased 8% from 7,775 hectares (19,212 ac) in 2024 to 7,140 hectares (17,643 ac) in 2025. None of the 19 segments increased by at least 20% and by at least 5 ha from 2024 totals: Three of the 19 segments decreased by at least 20% and by at least 5 ha from 2024 totals:
Nine of the 19 segments remained unvegetated in 2025. |
Oligohaline Bay Salinity ZoneIn the Oligohaline Bay Zone (25 CBP segments), 1,836 hectares (4,538 ac) of SAV were mapped for 2025. Comparing the same mapped regions between 2024 and 2025, SAV decreased 0.4% from 1,844 hectares (4,557 ac) in 2024 to 1,836 hectares (4,538 ac) in 2025. Seven of the 25 segments increased by at least 20% and by at least 5 ha from 2024 totals:
Four of the 25 segments decreased by at least 20% and by at least 5 ha from 2024 totals:
Nine of the 25 segments remained unvegetated in 2025. |
Mesohaline Bay Salinity ZoneIn the Mesohaline Bay Salinity Zone (41 CBP segments), 14,134 hectares (34,926 ac) of SAV were mapped for 2025. Comparing the same mapped regions between 2024 and 2025, SAV increased 16% from 12,172 hectares (30,079 ac) in 2024 to 14,134 hectares (34,926 ac) in 2025. Twelve of the 41 segments increased by at least 20% and by at least 5 ha from 2024 totals:
Three of the 41 segments decreased by at least 20% and by at least 5 ha from 2024 totals:
Fifteen of the 41 segments remained unvegetated in 2025. |
Polyhaline Bay Salinity ZoneIn the Polyhaline Bay Zone (8 CBP segments), a record-breaking 10,466 hectares (25,862 ac) of SAV were mapped for 2025. Comparing the same mapped regions between 2024 and 2025, SAV increased 13% from 9,302 hectares (22,986 ac) in 2024 to 10,466 hectares (25,862 ac) in 2025. None of the 8 segments increased by at least 20% and by at least 5 ha from 2024 totals. None of the 8 segments decreased by at least 20% and by at least 5 ha from 2024 totals. One of the 8 segments remained unvegetated in 2025. |