2022 SAV Executive Summary
The 2022 distribution of submerged aquatic vegetation (SAV) in Chesapeake Bay and its tributaries was mapped from aerial multispectral digital imagery and satellite imagery. The aerial imagery was acquired between May and October 2022, with a resolution of 24 cm, encompassing 184 flight lines.
Due to a number of challenges, additional imagery was acquired from Maxar, Planet Labs, and Spot Image in order to provide a more complete dataset for Chesapeake Bay. These imagery sources and their locations are detailed below:
-
Due to turbid conditions, WorldView 2 satellite imagery acquired from Maxar through the NGA NextView program was used to supplement the aerial imagery for the Susquehanna, Bush, Gunpowder, and Middle rivers, the western shore of Chesapeake Bay from Spesutie Narrows to Back Creek as well as the eastern shore of Chesapeake Bay from the Sassafrass River to Fairlee Creek.
-
Aerial imagery was not acquired for portions of the Potomac River, from Broad Creek to Belmont Bay. WorldView 2 satellite imagery, PlanetScope satellite imagery from Planet Labs, and Pleaides imagery from Spot Image were used to map these areas.
-
WorldView 2 satellite imagery, PlanetScope imagery, and Pleaides imagery were used to supplement our aerial imagery for portions of the Potomac River from Occoquan Bay to Potomac Creek. WorldView 2 satellite imagery was used to supplement our aerial imagery for portions of the Potomac River from Nanjemoy Creek to Wicomoco Creek.
-
WorldView 2 satellite imagery was used to supplement our aerial imagery for portions of the Rappahannock River north of Portobago Bay.
-
Lastly, due to turbid conditions, WorldView 2 satellite imagery was used to supplement our aerial imagery for portions of the eastern shore of Pocomoke Sound from Beasley Bay to Chesconessex Creek.
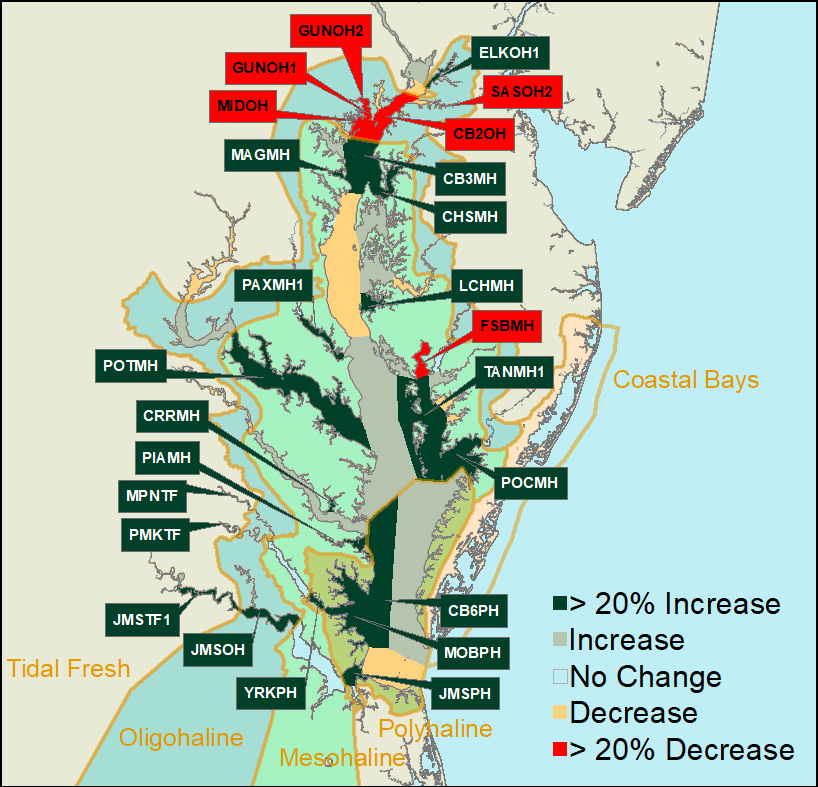
Chesapeake BayFor 2022, 31,332 hectares (77,425 acres) of SAV were mapped in Chesapeake Bay and its tributaries. Although the Chesapeake Bay and its tributaries were fully mapped for 2022, weather conditions prevented acquisition of imagery in 2021 for a portion of the Mattaponi and Pamunkey rivers. In order to ensure a valid analysis of change in SAV distribution and abundance with 2021, all direct comparisons to previous years in this report are restricted to only those regions that were mapped in both years. If a region was not mapped in 2021, comparisons are given using area totals from 2020 instead. The area that was not fully mapped in 2021 supported 27 hectares of SAV in 2020 (66 acres, 0.10% of the Bay total). Notable changes in SAV distribution were measured between 2021 and 2022. SAV increased 14% from 27,528 ha (68,025 ac) in 2021 to 31,301 ha (77,349 ac) in 2022 in the regions mapped for both years. SAV increased in three salinity zones (Tidal Fresh, Mesohaline, and Polyhaline) and decreased in the other one salinity zone (Oligohaline). In 2022, SAV increased in 43, decreased in 24, and remained unvegetated in 26 of the 93 CBP segments.
SAV increased in the Tidal Fresh, Mesohaline, and Polyhaline zones, where SAV continued to recover from recent declines in some areas. The Mesohaline zone showed a 30% increase from 2021 (2,948 hectares, 7,285 acres), mainly driven by the 1,551 hectare increase in the Tangier Sound segments. The Polyhaline zone showed a 19% increase from 2021 (1,251 hectares, 3,091 acres), including 957 hectares from the Mobjack Bay segment. The Tidal Fresh zone stayed essentially the same with a small increase (63 hectares, 155 acres) while the Oligohaline zone showed a 14% decrease (489 hectares, 1,209 acres). The increases in the Mesohaline and Polyhaline zone largely reflect recovery following the SAV crash in 2019. Those losses in 2019 were largely due to declines in widgeongrass which has expanded over the past decade due to increases in water quality but is sensitive to wet springs like the one experienced in 2019. The expansion in the Polyhaline zone is also attributable to a La Nina climate cycle which has resulted in cooler summers, benefiting eelgrass. The primary losses in the Oligohaline were concentrated in a small area, the Gunpowder River, the Middle River, and the adjacent mainstem. These declines may have been influenced by phytoplankton blooms observed in those segments in the spring and summer of 2022. |
Tidal Fresh Bay Salinity ZoneIn the Tidal Fresh Bay Zone (19 CBP segments), 7,855 hectares (19,411 ac) of SAV were mapped for 2022. However, portions of the Mattaponi and Pamunkey rivers, representing 27 hectares (66 ha, 0.35% of the zone total) were not mapped for 2021. Comparing the same mapped regions between 2021 and 2022, SAV increased 0.82% from 7,761 hectares (19,179 ac) in 2021 to 7,825 hectares (19,335 ac) in 2022. 3 of the 19 segments increased by at least 20% and by at least 5 ha from 2021 totals:
None of the 8 segments decreased by at least 20% and by at least 5 ha from 2021 totals. Six of the 19 segments remained unvegetated in 2022. |
Oligohaline Bay Salinity ZoneIn the Oligohaline Bay Zone (25 CBP segments), SAV decreased 14% from 3,393 hectares (8,384 ac) in 2021 to 2,904 hectares (7,175 ac) in 2022. Two of the 25 segments increased by at least 20% and by at least 5 ha from 2021 totals:
Five of the 25 segments decreased by at least 20% and by at least 5 ha from 2021 totals:
Six of the 25 segments remained unvegetated in 2022. |
Mesohaline Bay Salinity ZoneIn the Mesohaline Bay Salinity Zone (41 CBP segments), SAV increased 30% from 9,749 hectares (24,091 ac) in 2021 to 12,697 hectares (31,376 ac) in 2022. Ten of the 41 segments increased by at least 20% and by at least 5 ha from 2021 totals:
One of the 41 segments decreased by at least 20% and by at least 5 ha from 2021 totals:
Thirteen of the 41 segments remained unvegetated in 2022. |
Polyhaline Bay Salinity ZoneIn the Polyhaline Bay Zone (8 CBP segments), SAV increased 19% from 6,625 ha (16,371 ac) in 2021 to 7,876 ha (19,462 ac) in 2022. Four of the 8 segments increased by at least 20% and by at least 5 ha from 2021 totals:
None of the 8 segments decreased by at least 20% and by at least 5 ha from 2021 totals. One of the 8 segments remained unvegetated in 2022. |
Delmarva Peninsula Coastal Bays ZoneIn the Delmarva Peninsula Coastal Bays Zone (10 segments covering Assawoman, Isle of Wight, Sinepuxent, Chincoteague, and Southern Virginia coastal bays), SAV decreased 10% from 6,954 hectares (17,185 ac) in 2021 to 6,288 hectares (15,539 ac) in 2022. 2 of the 8 segments decreased by at least 20% and by at least 5 ha from 2020 totals:
Four of the 10 segments remained unvegetated in 2022. |