2021 SAV Executive Summary
The 2021 distribution of submerged aquatic vegetation (SAV) in Chesapeake Bay and its tributaries was mapped from aerial multispectral digital imagery and satellite imagery. The aerial imagery was acquired between May and November 2021, with a resolution of 24 cm, encompassing 179 flight lines.
Due to a number of challenges, additional imagery was acquired from Maxar, the National Agricultural Imagery Program, and Planet Labs in order to provide a more complete dataset for Chesapeake Bay. These imagery sources and their locations are detailed below:
- Aerial imagery was not acquired for the Mattaponi, Pamunkey, and the majority of the Chickahominy and James rivers. WorldView 2 satellite imagery acquired from Maxar through the NGA NextView program and National Agricultural Imagery Program (NAIP) aerial imagery were used to map these areas.
- Due to turbid conditions and haze from western wildfires, NAIP aerial imagery was used to augment the aerial imagery for the Chester, Choptank, Little Choptank, Magothy, and Miles rivers, Harris Creek, Eastern Bay, and the western shore of Chesapeake Bay along the Calvert Cliffs.
- Due to late imagery acquisition, WorldView 2 satellite imagery acquired from Maxar through the NGA NextView program, NAIP aerial imagery, and PlanetScope satellite imagery from Planet Labs were used to augment the aerial imagery for the Anacostia River and the upper Potomac River, and middle Rappahannock River, including Menokin Bay and Cat Point Creek.
- Due to cloudy conditions, NAIP imagery was used to augment the aerial imagery for the Great Wicomico River and western shore of Chesapeake Bay from the mouth of the Rappahannock River up to Ingram Bay.
- Finally, WorldView 2 satellite imagery acquired from Maxar through the NGA NextView program was available for Mobjack Bay, so it and the NAIP aerial imagery were used to augment our aerial imagery for Mobjack Bay.
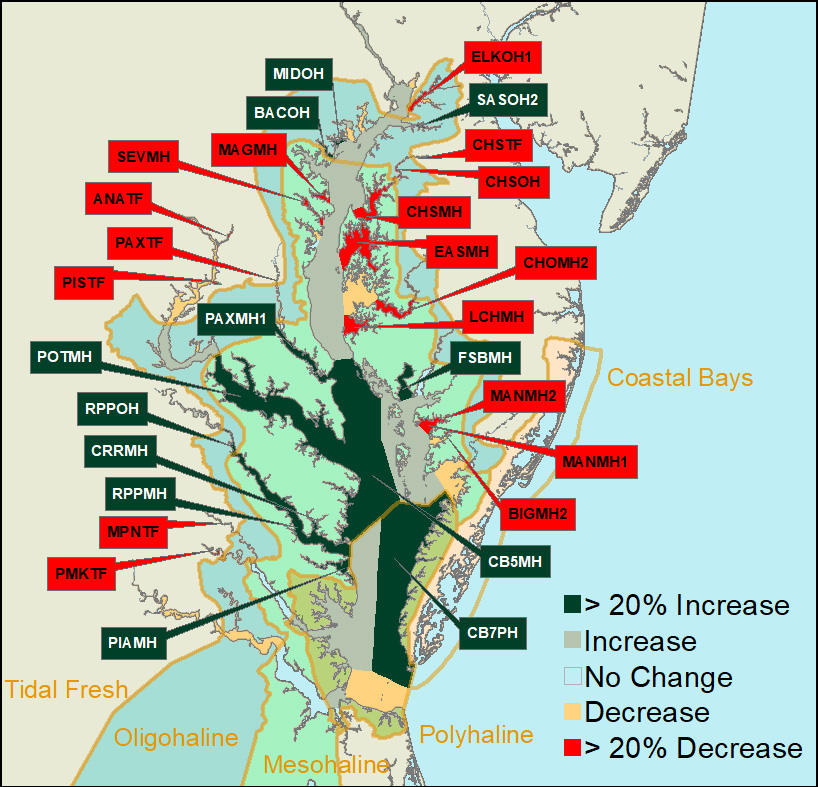
Chesapeake BayFor 2021, 27,528 hectares (68,025 acres) of SAV were mapped in Chesapeake Bay and its tributaries. However, weather conditions prevented acquisition of imagery for a portion of the Mattaponi and Pamunkey rivers. The area that was not fully mapped in 2021 supported 27 hectares of SAV in 2020 (66 acres, 0.10% of the Bay total). In order to ensure a valid analysis of change in SAV distribution and abundance with 2020, all direct comparisions to previous years in this report are restricted to only those regions that were mapped in both 2020 and 2021. SAV increased in the four salinity zones (Tidal Fresh, Oligohaline, Mesohaline, and Polyhaline) in the Chesapeake Bay for the first time since 2015. In 2021, SAV increased in 32, decreased in 36, and remained unvegetated in 25 of the 93 CBP segments.
All of the salinity zones across the Bay experienced increases, but the largest increases were in the Polyhaline zone. In the Polyhaline zone, SAV recovered from recent declines in some areas, contributing to a 19% increase (1,081 hectares, 2,670 acres). The Mesohaline zone showed a 6% increase from 2020 (569 hectares, 1,405 acres). The Tidal Fresh zone showed a 4% increase (296 hectares, 731 acres) while the Oligohaline zone showed a 2% increase (62 hectares, 153 acres). The increases in the Mesohaline and Polyhaline zone largely reflect recovery following the SAV crash in 2019. Those losses in 2019 were largely due to declines in widgeongrass which is prone to boom and bust cycles of expansion and retraction. For example, in 2018, the Mesohaline and northern Polyhaline salinity zones widgeongrass increased and eelgrass was observed by the survey for the first time in an extensive region east of Tangier Island, but these gains were reversed in 2019. The subsequent decline we observed in 2019 mirrors a similar rapid increase in widgeongrass in 2001 and 2002 that was followed by about a 50% decline in 2003. However, while we are observing recovery following the 2019 crash, in some areas in 2021 widgeongrass remains in decline. The largest declines in 2021 in terms of total area (432 ha, 1,067 ac) were again observed in widgeongrass dominated areas of the Mesohaline zone including continued loss in Eastern Bay, the mouth of the Choptank River, and in the Little Choptank River. |
Tidal Fresh Bay Salinity ZoneIn the Tidal Fresh Bay Zone (19 CBP segments), 7,761 hectares (19,179 ac) of SAV were mapped for 2021. However, portions of the Mattaponi and Pamunkey rivers, representing 27 hectares (66 ha, 0.35% of the zone total) were not mapped for 2021. Comparing the same mapped regions between 2020 and 2021, SAV increased 4% from 7,465 hectares (18,448 ac) in 2020 to 7,761 hectares (19,179 ac) in 2021. None of the 19 segments increased by at least 20% and by at least 5 ha from 2020 totals. Six of the 19 segments decreased by at least 20% and by at least 5 ha from 2020 totals:
4 of the 19 segments remained unvegetated in 2021. |
Oligohaline Bay Salinity ZoneIn the Oligohaline Bay Zone (25 CBP segments), SAV increased 2% from 3,331 hectares (8,231 ac) in 2020 to 3,393 hectares (8,384 ac) in 2021. Four of the 25 segments increased by at least 20% and by at least 5 ha from 2020 totals:
Two of the 25 segments decreased by at least 20% and by at least 5 ha from 2020 totals:
6 of the 25 segments remained unvegetated in 2021. |
Mesohaline Bay Salinity ZoneIn the Mesohaline Bay Salinity Zone (41 CBP segments), SAV increased 6% from 9,180 hectares (22,686 ac) in 2020 to 9,749 hectares (24,091 ac) in 2021. Seven of the 41 segments increased by at least 20% and by at least 5 ha from 2020 totals:
Nine of the 41 segments decreased by at least 20% and by at least 5 ha from 2020 totals:
14 of the 41 segments remained unvegetated in 2021. |
Polyhaline Bay Salinity ZoneIn the Polyhaline Bay Zone (8 CBP segments), SAV increased 19% from 5,545 hectares (13,701 ac) in 2020 to 6,625 hectares (16,371 ac) in 2021. One of the 8 segments increased by at least 20% and by at least 5 ha from 2020 totals:
None of the 8 segments decreased by at least 20% and by at least 5 ha from 2020 totals. One of the 8 segments remained unvegetated in 2021. |
Delmarva Peninsula Coastal Bays ZoneIn the Delmarva Peninsula Coastal Bays Zone (10 segments covering Assawoman, Isle of Wight, Sinepuxent, Chincoteague, and Southern Virginia coastal bays), SAV decreased 4% from 7,280 hectares (17,990 ac) in 2020 to 6,954 hectares (17,185 ac) in 2021. 1 of the 8 segments decreased by at least 20% and by at least 5 ha from 2020 totals:
Four of the 10 segments remained unvegetated in 2021. |