2020 SAV Executive Summary
The 2020 distribution of submerged aquatic vegetation (SAV) in Chesapeake Bay and its tributaries was mapped from aerial multispectral digital imagery. These were acquired between May and October 2020, with a resolution of 24 cm, encompassing 190 flight lines. Due to cloudy conditions on the day of the flight, WorldView 2 satellite imagery acquired from Maxar through the NGA NextView program was used in place of aerial imagery for the Anacostia River and northernmost area of the Potomac River.
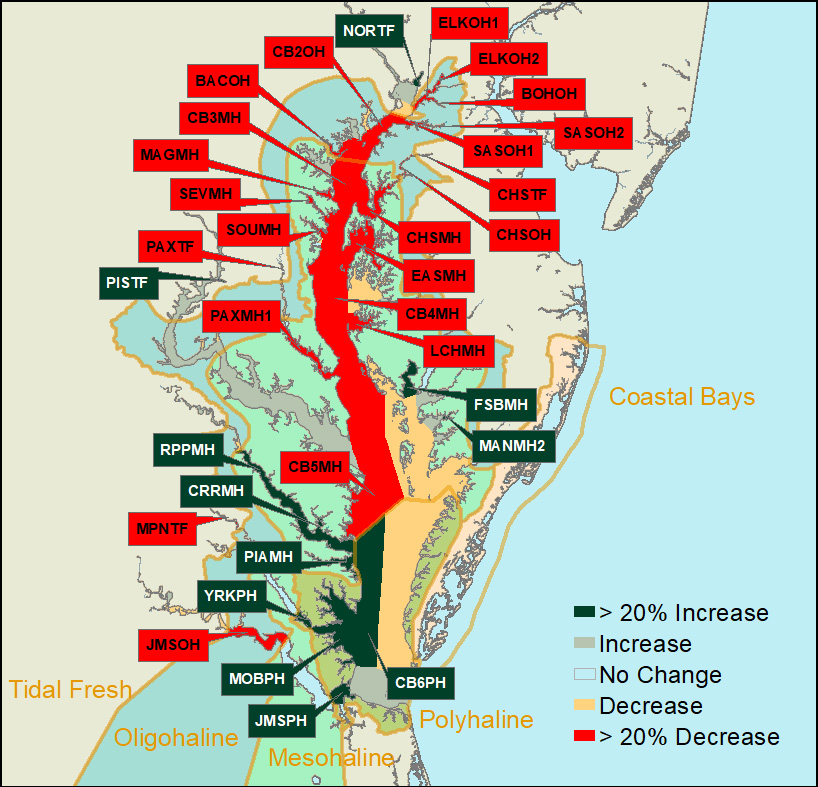
Chesapeake BayFor 2020, 25,548 hectares (63,132 acres) of SAV were mapped in Chesapeake Bay and its tributaries. SAV increased in the Tidal Fresh and Polyhaline salinity zones and decreased in the Oligohaline and Mesohaline salinity zones in the Chesapeake Bay. In 2020, SAV increased in 31, decreased in 41, and remained unvegetated in 21 of the 93 CBP segments.
In the Polyhaline zone, SAV recovered from recent declines in some areas, contributing to a 14% increase (698 hectares, 1,726 acres). The Tidal Fresh zone showed a 5% increase (362 hectares, 896 acres) whereas the Oligohaline zone showed a 9% decrease (323 hectares, 799 acres). The largest declines in terms of total area (2,175 hectares, 5,375 ac) were again observed in the Mesohaline zone including continued loss in the Tangier Sound area and new large decreases in Eastern Bay, the mouth of the Choptank River, and in the Little Choptank River. Losses are largely due to declines in widgeongrass which is prone to boom and bust cycles of expansion and retraction. In 2018, the Mesohaline and northern Polyhaline salinity zones widgeongrass increased and eelgrass was observed by the survey for the first time in an extensive region east of Tangier Island. The subsequent decline we observed in 2019 mirrors a similar rapid increase in widgeongrass in 2001 and 2002 that was followed by about a 50% decline in 2003. |
Tidal Fresh Bay Salinity ZoneIn the Tidal Fresh Bay Zone (19 CBP segments), SAV increased 5% from 7,130 hectares (17,618 ac) in 2019 to 7,492 hectares (18,514 ac) in 2020. 2 of the 19 segments increased by at least 20% and by at least 5 ha from 2019 totals:
3 of the 19 segments decreased by at least 20% and by at least 5 ha from 2019 totals:
4 of the 19 segments remained unvegetated in 2020. |
Oligohaline Bay Salinity ZoneIn the Oligohaline Bay Zone (25 CBP segments), SAV decreased 9% from 3,654 hectares (9,029 ac) in 2019 to 3,331 hectares (8,231 ac) in 2020. None of the 25 segments increased by at least 20% and by at least 5 ha from 2019 totals. 9 of the 25 segments decreased by at least 20% and by at least 5 ha from 2019 totals:
3 of the 25 segments remained unvegetated in 2020. |
Mesohaline Bay Salinity ZoneIn the Mesohaline Bay Salinity Zone (41 CBP segments), SAV decreased 19% from 11,356 hectares (28,061 ac) in 2019 to 9,180 hectares (22,686 ac) in 2020. 5 of the 41 segments increased by at least 20% and by at least 5 ha from 2019 totals:
10 of the 41 segments decreased by at least 20% and by at least 5 ha from 2019 totals:
13 of the 41 segments remained unvegetated in 2020. |
Polyhaline Bay Salinity ZoneIn the Polyhaline Bay Zone (8 CBP segments), SAV increased 14% from 4,846 ha (11,975 ac) in 2019 to 5,545 ha (13,701 ac) in 2020. 4 of the 8 segments increased by at least 20% and by at least 5 ha from 2019 totals:
None of the 8 segments decreased by at least 20% and by at least 5 ha from 2019 totals. 1 of the 8 segments remained unvegetated in 2020. |
Delmarva Peninsula Coastal Bays ZoneIn the Delmarva Peninsula Coastal Bays Zone (10 segments covering Assawoman, Isle of Wight, Sinepuxent, Chincoteague, and Southern Virginia coastal bays), 7,280 hectares (17,990 ac) of SAV were mapped for 2020. However, the northern portion of the zone, including Chincoteague Bay and Maryland coastal bays, representing 3,446 ha of SAV in 2020 (8,514 ac, 47% of the zone total) was not mapped for 2019. Comparing the same mapped regions between 2019 and 2020, SAV increased 14% from 3,358 hectares (8,297 ac) in 2019 to 3,835 hectares (9,476 ac) in 2020. 1 of the 8 segments increased by at least 20% and by at least 5 ha from 2019 totals:
1 of the 8 segments decreased by at least 20% and by at least 5 ha from 2017 totals:
Four of the 10 segments remained unvegetated in 2020. *Segment compared to 2017 areas as the area was not mapped in 2018 or 2019. |