VIMS

2019 SAV Executive Summary

The 2019 distribution of submerged aquatic vegetation (SAV) in Chesapeake Bay and its tributaries was mapped from aerial multispectral digital imagery. These were acquired between May and September 2019, with a resolution of 24 cm, encompassing 187 flight lines. WorldView 2 satellite imagery acquired from Digital Globe through the NGA NextView program was used to augment the aerial imagery for the Belmont Bay portion of the Potomac River.
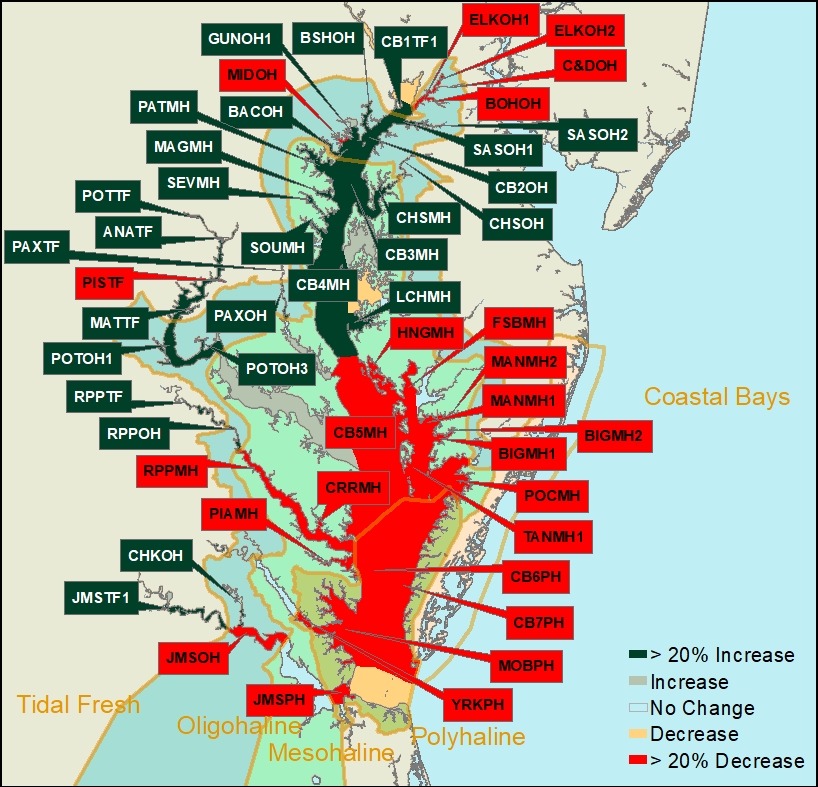
Chesapeake Bay
Chesapeake Bay

For 2019, 26,986 hectares (66,684 acres) of SAV were mapped in Chesapeake Bay and its tributaries.

Although the Chesapeake Bay and its tributaries were fully mapped for 2019, highly turbid water, weather conditions, and security restrictions in the DC area, over Patuxent Air Base and associated mid-Bay areas prevented acquisition of useable imagery in 2018 for a portion of the tidal fresh and mesohaline Potomac River; the Bohemia, Choptank, and Mattaponi rivers. In order to ensure a valid analysis of change in SAV distribution and abundance with 2018, all direct comparisons to previous years in this report are restricted to only those regions that were mapped in both years. If a region was not mapped in 2018, comparisons are given using area totals from 2017 instead. The area that was not fully mapped in 2018 supported 1,760 ha of SAV in 2019 (4,350 acres, 7% of the 2019 Bay total).

Notable changes in SAV distribution were measured between 2019 and 2018. SAV decreased 37% from 39,993 ha (98,828 ac) in 2018 to 25,225 ha (62,334 ac) in 2019 in the regions mapped for both years.

SAV modestly increased in the Tidal Fresh and Oligohaline salinity zones and sharply decreased in the Mesohaline and Polyhaline salinity zones in the Chesapeake Bay. In 2019, SAV increased in 41, decreased in 28, and remained unvegetated in 24 of the 93 CBP segments.

Segment Comparison Map

Segment Comparison by Salinity Zone

The largest declines in terms of total area (-13,269 hectares, 32,790 ac) were observed in the Mesohaline zone particularly in the Tangier Sound area (-7,446 hectares, 18,400 ac).  Losses are largely due to declines in widgeongrass which is prone to boom and bust cycles of expansion and retraction.  In 2018, the Mesohaline and northern Polyhaline salinity zones widgeongrass increased and eelgrass was observed by the survey for the first time in an extensive region east of Tangier Island.  The subsequent decline we observed in 2019 mirrors a similar rapid increase in widgeongrass in 2001 and 2002 that was followed by about a 50% decline in 2003.

Tidal Fresh Bay Salinity Zone

In the Tidal Fresh Bay Zone (19 CBP segments), 7,130 hectares (17,618 ac) of SAV were mapped for 2019. Portions of the zone, including the Mattaponi River and the portion of the Potomac River from Belmont Bay through the DC area including the Anacostia River, representing 1,124 ha of SAV in 2019 (2,777 ac, 16% of the zone total) were not mapped for 2018. Comparing the same mapped regions between 2018 and 2019, SAV increased 11% from 5,420 hectares (13,393 ac) in 2018 to 6,006 hectares (14,841 ac) in 2019.

Seven of the 19 segments increased by at least 20% and by at least 5 ha from 2018 totals
Seven of the 19 segments increased by at least 20% and by at least 5 ha from 2018 totals:
▲ 54%, Northern Chesapeake Bay Segment 1 (CB1TF1), 212 ha (2018) vs. 326 ha (2019)
▲ 176%, Upper Patuxent River (PAXTF), 15 ha (2018) vs. 41 ha (2019)
▲ 30%, Upper Potomac River (POTTF), 416 ha (2018) vs. 543 ha (2019)*
▲ 47%, Mattawoman Creek (MATTF), 195 ha (2018) vs. 287 ha (2019)
▲ 269%, Anacostia River (ANATF), 5 ha (2017) vs. 19 ha (2019)**
▲ 46%, Upper Rappahannock River (RPPTF), 339 ha (2018) vs. 496 ha (2019)
▲ 32%, Upper James River Segment 1 (JMSTF1), 163 ha (2018) vs. 216 ha (2019)
One of the 19 segments decreased by at least 20% and by at least 5 ha from 2017 totals
One of the 19 segments decreased by at least 20% and by at least 5 ha from 2017 totals:
▼ 89%, Piscataway Creek (PISTF), 140 ha (2017) vs. 15 ha (2019)**

4 of the 19 segments remained unvegetated in 2018.

*Segment comparison restricted to areas mapped in both 2018 and 2019
**Segment compared to 2017 areas as the area was not mapped in 2018

Tidal Fresh Bay Salinity Zone
Oligohaline Bay Salinity Zone

In the Oligohaline Bay Zone (25 CBP segments), 3,654 hectares (9,029 acres) of SAV were mapped for 2019. However, portions of the zone, including the Potomac, Bohemia, and Sassafras Rivers, representing 28 ha of SAV in 2019 (70 ac, 1% of the zone total) were not mapped for 2018. Comparing the same mapped regions between 2018 and 2019, SAV increased 13% from 3,195 hectares (7,895 ac) in 2018 to 3,626 hectares (8,959 ac) in 2019.

Twelve of the 25 segments increased by at least 20% and by at least 5 ha from 2018 totals
Twelve of the 25 segments increased by at least 20% and by at least 5 ha from 2018 totals:
▲ 58%, Upper Chesapeake Bay (CB2OH), 255 ha (2018) vs. 404 ha (2019)
▲ 78%, Sassafras River Segment 1 (SASOH1), 54 ha (2018) vs. 96 ha (2019)
▲ 493%, Sassafras River Segment 2 (SASOH2), 11 ha (2018) vs. 68 ha (2019)*
▲ 28%, Bush River (BSHOH), 174 ha (2018) vs. 224 ha (2019)
▲ 62%, Gunpowder River Segment 1 (GUNOH1), 245 ha (2018) vs. 396 ha (2019)
▲ 2533%, Back River (BACOH), 0 ha (2018) vs. 6 ha (2019)
▲ 68%, Middle Chester River (CHSOH), 88 ha (2018) vs. 148 ha (2019)
▲ 1355%, Middle Patuxent River (PAXOH), 1 ha (2018) vs. 9 ha (2019)
▲ 74%, Middle Potomac River Segment 1 (POTOH1), 383 ha (2018) vs. 664 ha (2019)*
▲ 48%, Middle Potomac River Segment 3 (POTOH3), 54 ha (2018) vs. 79 ha (2019)*
▲ 37%, Middle Rappahannock River (RPPOH), 69 ha (2018) vs. 94 ha (2019)
▲ 49%, Chickahominy River (CHKOH), 288 ha (2018) vs. 429 ha (2019)
Six of the 25 segments decreased by at least 20% and by at least 5 ha from 2018 totals
Six of the 25 segments decreased by at least 20% and by at least 5 ha from 2018 totals:
▼ 55%, Elk River Segment 1 (ELKOH1), 717 ha (2018) vs. 323 ha (2019)*
▼ 84%, Elk River Segment 2 (ELKOH2), 53 ha (2018) vs. 9 ha (2019)
▼ 34%, Bohemia River (BOHOH), 48 ha (2018) vs. 32 ha (2019) *
▼ 100%, Chesapeake & Delaware Canal (C&DOH), 7 ha (2018) vs. 0 ha (2019)*
▼ 47%, Middle River (MIDOH), 350 ha (2018) vs. 186 ha (2019)
▼ 24%, Middle James River (JMSOH), 30 ha (2018) vs. 23 ha (2019)
3 of the 25 segments remained unvegetated in 2018.

* Segment comparison restricted to areas mapped in both 2018 and 2019
Mesohaline Bay Salinity Zone

In the Mesohaline Bay Salinity Zone (41 CBP segments), 11,356 hectares (28,061 ac) of SAV were mapped for 2019. Portions of the zone, including the north shore of the Potomac River from Herring Creek to Smith Creek, those creeks, and the St. Marys River, and portions of the Choptank and Honga Rivers, representing 608 ha of SAV in 2019 (1,503 ac, 5% of the zone total) were not mapped for 2018. Comparing the same mapped regions between 2018 and 2019, SAV decreased 55% from 24,017 hectares (59,348 ac) in 2018 to 10,748 hectares (26,558 ac) in 2019.

Eight of the 41 segments increased by at least 20% and by at least 5 ha from 2018 totals
Eight of the 41 segments increased by at least 20% and by at least 5 ha from 2018 totals:
▲ 68%, Upper Central Chesapeake Bay (CB3MH), 189 ha (2018) vs. 318 ha (2019)
▲ 361%, Patapsco River (PATMH), 12 ha (2018) vs. 57 ha (2019)
▲ 413%, Magothy River (MAGMH), 14 ha (2018) vs. 74 ha (2019)
▲ 101%, Lower Chester River (CHSMH), 154 ha (2018) vs. 310 ha (2019)
▲ 702%, Middle Central Chesapeake Bay (CB4MH), 8 ha (2018) vs. 64 ha (2019)*
▲ 32%, Little Choptank River (LCHMH), 383 ha (2018) vs. 506 ha (2019)*
▲ 81%, Severn River (SEVMH), 91 ha (2018) vs. 164 ha (2019)
▲ 100%, South River (SOUMH), 0 ha (2018) vs. 7 ha (2019)
Twelve of the 41 segments decreased by at least 20% and by at least 5 ha from 2018 totals
Twelve of the 41 segments decreased by at least 20% and by at least 5 ha from 2018 totals:
▼ 72%, Lower Central Chesapeake Bay (CB5MH), 2,180 ha (2018) vs. 601 ha (2019)
▼ 59%, Honga River (HNGMH), 2,524 ha (2018) vs. 1,034 ha (2019)*
▼ 94%, Fishing Bay (FSBMH), 88 ha (2018) vs. 5 ha (2019)
▼ 70%, Tangier Sound Segment 1 (TANMH1), 10,664 ha (2018) vs. 3,218 ha (2019)
▼ 72%, Manokin River Segment 1 (MANMH1), 813 ha (2018) vs. 225 ha (2019)
▼ 38%, Manokin River Segment 2 (MANMH2), 19 ha (2018) vs. 12 ha (2019)
▼ 54%, Big Annemessex River Segment 1 (BIGMH1), 642 ha (2018) vs. 298 ha (2019)
▼ 34%, Big Annemessex River Segment 2 (BIGMH2), 15 ha (2018) vs. 10 ha (2019)
▼ 47%, Lower Pocomoke River (POCMH), 1,560 ha (2018) vs. 833 ha (2019)
▼ 88%, Lower Rappahannock River (RPPMH), 910 ha (2018) vs. 106 ha (2019)
▼ 90%, Corrotoman River (CRRMH), 268 ha (2018) vs. 28 ha (2019)
▼ 90%, Piankatank River (PIAMH), 513 ha (2018) vs. 54 ha (2019)

16 of the 41 segments remained unvegetated in 2019.

* Segment comparison restricted to areas mapped in both 2018 and 2019

Polyhaline Bay Salinity Zone

In the Polyhaline Bay Zone (8 CBP segments), SAV decreased 34% from 7,362 ha (18,192 ac) in 2018 to 4,846 ha (11,975 ac) in 2019.

 None of the 8 segments increased by at least 20% and by at least 5 ha from 2018 totals.

Five of the 8 segments decreased by at least 20% and by at least 5 ha from 2018 totals
Five of the 8 segments decreased by at least 20% and by at least 5 ha from 2018 totals:
▼ 57%, Western Lower Chesapeake Bay (CB6PH), 241 ha (2018) vs. 104 ha (2019)
▼ 32%, Eastern Lower Chesapeake Bay (CB7PH), 3,758 ha (2018) vs. 2,564 ha (2019)
▼ 34%, Mobjack Bay (MOBPH), 3,076 ha (2018) vs. 2,035 ha (2019)
▼ 48%, Lower York River (YRKPH), 167 ha (2018) vs. 87 ha (2019)
▼ 52%, Mouth of the James River (JMSPH), 118 ha (2018) vs. 57 ha (2019)

1 of the 8 segments remained unvegetated in 2019.

Polyhaline Bay Salinity Zone
Delmarva Peninsula Coastal Bays Zone

In the Delmarva Peninsula Coastal Bays Zone (10 segments covering Assawoman, Isle of Wight, Sinepuxent, Chincoteague, and Southern Virginia coastal bays), 3,358 hectares (8,297 ac) of SAV were mapped for 2019. However, the northern portion of the zone, including Chincoteague Bay and Maryland coastal bays, representing 3,641 ha of SAV in 2017 (8,996 ac, 55% of the zone total) was not mapped for 2019. Comparing the same mapped regions between 2018 and 2019, SAV decreased 7% from 3,613 hectares (8,927 ac) in 2018 to 3,358 hectares (8,297 ac) in 2019.

None of the 10 segments increased or decreased by at least 20% and by at least 5 ha from 2018 totals

Six of the 10 segments remained unvegetated in 2019.