2018 SAV Executive Summary
The 2018 distribution of submerged aquatic vegetation (SAV) in Chesapeake Bay and its tributaries was mapped from aerial multispectral digital imagery. These were acquired between May and October 2018, with a resolution of 24 cm, encompassing 111 flight lines. National Agricultural Imagery Program (NAIP) aerial imagery, as well as WorldView 2 and 3 satellite imagery acquired from Digital Globe through the NGA NextView program, WorldView 4 imagery purchased from Apollo Mapping, and PlanetScope satellite imagery from Planet Labs was used to augment the aerial imagery in portions of the Bay and tributaries where imagery had not been acquired because of highly turbid water, weather, and security restrictions during the acquisition phase.
Chesapeake Bay
For 2018, 40,270 hectares (99,511 acres) of SAV were mapped in Chesapeake Bay and its tributaries. However, highly turbid water, weather conditions, and security restrictions in the DC area, over Patuxent Air Base and associated mid-Bay areas prevented acquisition of useable imagery for a portion of the tidal fresh and mesohaline Potomac River; the Bohemia, Choptank, and Mattaponi rivers.. The area that was not fully mapped in 2018 supported 3,743 ha of SAV in 2017 (9,250 acres, 9% of the 2017 Bay total).
* While not fully mapped in 2018, 277 ha of SAV (683 ac) were mapped for 2018 in this area. If the 2017 area is used to generate an estimate for the full Bay for 2018, this should be subtracted from the 40,270 ha total to avoid counting this area twice.
In order to ensure a valid analysis of change in SAV distribution and abundance with 2017, all direct comparisons to previous years in this report are restricted to only those regions that were mapped in both 2017 and 2018.
Notable changes in SAV distribution were measured between 2018 and 2017. SAV increased 3% from 38,705 ha (95,643 ac) in 2017 to 39,993 ha (98,828 ac) in 2018 in the regions mapped for both years.
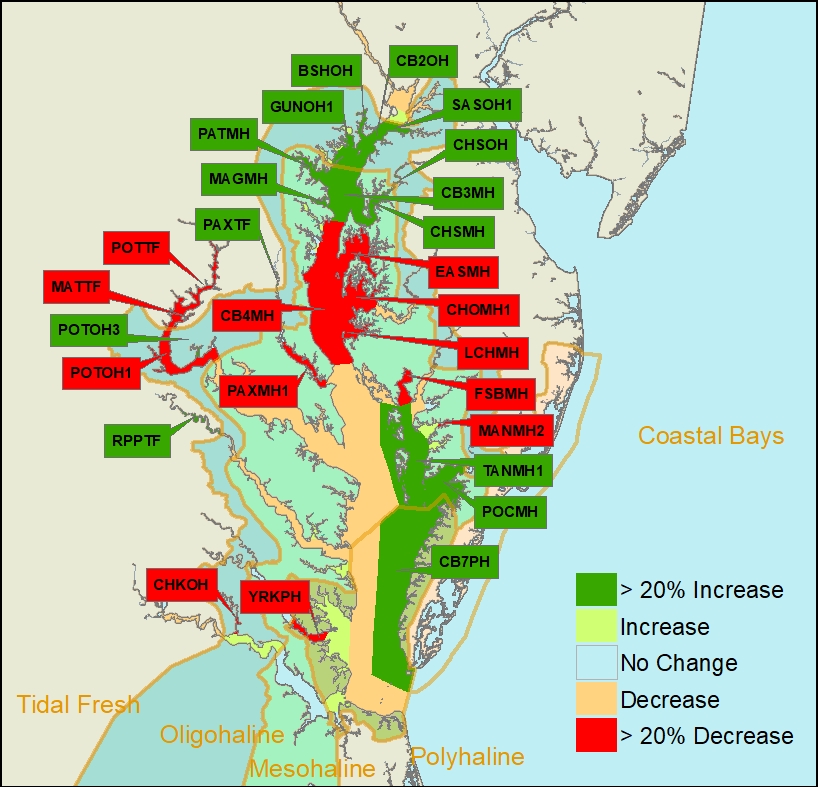
SAV decreased in the Tidal Fresh and Oligohaline salinity zones and increased in the Mesohaline and Polyhaline salinity zones in the Chesapeake Bay. In 2018, SAV increased in 33, decreased in 32, and remained unvegetated in 28 of the 93 CBP segments.
Segment Comparison Map
|
Due to the significant area that was not fully mapped for 2018, caution should be used when extrapolating the 3% (1,289 ha) increase to the full Bay. It is clear from the segments that were fully mapped that this increase was not uniform and SAV was lost in some regions. This is also likely the case in areas that were not fully mapped. In addition, where turbidity prevented the acquisition of usable aerial imagery, those conditions likely also negatively affected SAV populations in 2018. However, the persistence of substantial SAV coverage in 2018 that is close to 2017 levels, given these challenging water quality conditions, suggest a continuing resilience of SAV to strong environmental perturbations.
In the Mesohaline and northern Polyhaline salinity zones widgeongrass continued to increase and eelgrass was observed by the survey for the first time in an extensive region east of Tangier Island, contributing strongly to increases in those zones. However, widgeongrass has had boom and bust cycles throughout the history of this survey. A similar rapid increase in widgeongrass in 2001 and 2002 was followed by an approximately 50% loss the following year.
Tidal Fresh Bay Salinity Zone
In the Tidal Fresh Bay Zone (19 CBP segments), 5,420 hectares (13,394 ac) of SAV were mapped for 2018. However, portions of the zone, including the portion of the Potomac River from Belmont Bay through the DC area including the Anacostia River, and the Mattaponi River, representing 2,290 ha of SAV in 2017 (5,658 ac, 28% of the zone total) were not mapped for 2018. Comparing the same mapped regions between 2017 and 2018, SAV decreased 6% from 5,765 hectares (14,245 ac) in 2017 to 5,420 hectares (13,393 ac) in 2018.
| Two of the 19 segments increased by at least 20% and by at least 5 ha from 2017 totals: |
|---|
| ▲ 100%, Upper Patuxent River (PAXTF), 0 ha (2017) vs. 15 ha (2018) |
| ▲ 49%, Upper Rappahannock River (RPPTF), 228 ha (2017) vs. 339 ha (2018) |
| Two of the 19 segments decreased by at least 20% and by at least 5 ha from 2017 totals: |
|---|
| ▼ 29%, Upper Potomac River (POTTF), 583 ha (2017) vs. 416 ha (2018)* |
| ▼ 27%, Mattawoman Creek (MATTF), 269 ha (2017) vs. 195 ha (2018) |
8 of the 19 segments remained unvegetated in 2018.
*Segment comparison restricted to areas mapped in both 2017 and 2018
Oligohaline Bay Salinity Zone
In the Oligohaline Bay Zone (25 CBP segments), 3,198 hectares (7,902 acres) of SAV were mapped for 2018. However, portions of the zone, including the Potomac, Bohemia, and Sassafras Rivers, representing 3 ha of SAV in 2017 (6 ac, 0.1% of the zone total) were not mapped for 2018. Comparing the same mapped regions between 2017 and 2018, SAV decreased 6% from 3,392 hectares (8,382 ac) in 2017 to 3,195 hectares (7,895 ac) in 2018.
Six of the 25 segments increased by at least 20% and by at least 5 ha from 2017 totals: |
|---|
| ▲ 33%, Upper Chesapeake Bay (CB2OH), 192 ha (2017) vs. 255 ha (2018)* |
| ▲ 512%, Sassafras River Segment 1 (SASOH1), 9 ha (2017) vs. 54 ha (2018) |
| ▲ 241%, Bush River (BSHOH), 51 ha (2017) vs. 174 ha (2018) |
| ▲ 45%, Gunpowder River Segment 1 (GUNOH1), 169 ha (2017) vs. 245 ha (2018) |
| ▲ 213%, Middle Chester River (CHSOH), 28 ha (2017) vs. 88 ha (2018) |
| ▲ 53%, Middle Potomac River Segment 3 (POTOH3), 35 ha (2017) vs. 54 ha (2018) |
| Two of the 25 segments decreased by at least 20% and by at least 5 ha from 2017 totals: |
|---|
| ▼ 44%, Middle Potomac River Segment 1 (POTOH1), 681 ha (2017) vs. 383 ha (2018)* |
| ▼ 41%, Chickahominy River (CHKOH), 489 ha (2017) vs. 288 ha (2018) |
Five of the 25 segments remained unvegetated in 2018.
* Segment comparison restricted to areas mapped in both 2017 and 2018
Mesohaline Bay Salinity Zone
In the Mesohaline Bay Salinity Zone (41 CBP segments), 24,290 hectares (60,024 ac) of SAV were mapped for 2018. However, portions of the zone, including the north shore of the Potomac River from Herring Creek to Smith Creek, those creeks, and the St. Marys River, and portions of the Choptank and Honga Rivers, representing 1,451 ha of SAV in 2017 (3,585 ac, 6% of the zone total) were not mapped for 2018. Comparing the same mapped regions between 2017 and 2018, SAV increased 3% from 23,376 hectares (57,765 ac) in 2017 to 24,017 hectares (59,348 ac) in 2018.
| Six of the 41 segments increased by at least 20% and by at least 5 ha from 2017 totals: |
|---|
| ▲ 71%, Upper Central Chesapeake Bay (CB3MH), 110 ha (2017) vs. 189 ha (2018) |
| ▲ 114%, Patapsco River (PATMH), 6 ha (2017) vs. 12 ha (2018) |
| ▲ 53%, Magothy River (MAGMH), 9 ha (2017) vs. 14 ha (2018) |
| ▲ 63%, Lower Chester River (CHSMH), 95 ha (2017) vs. 154 ha (2018) |
| ▲ 23%, Tangier Sound Segment 1 (TANMH1), 8,700 ha (2017) vs. 10,664 ha (2018) |
| ▲ 56%, Lower Pocomoke River (POCMH), 1,001 ha (2017) vs. 1,560 ha (2018) |
| Seven of the 41 segments decreased by at least 20% and by at least 5 ha from 2017 totals: |
|---|
| ▼ 55%, Middle Central Chesapeake Bay (CB4MH), 18 ha (2017) vs. 8 ha (2018) |
| ▼ 25%, Eastern Bay (EASMH), 987 ha (2017) vs. 743 ha (2018) |
| ▼ 25%, Mouth of the Choptank River (CHOMH1), 2612 ha (2017) vs. 1949 ha (2018) |
| ▼ 30%, Little Choptank River (LCHMH), 546 ha (2017) vs. 383 ha (2018) |
| ▼ 40%, Fishing Bay (FSBMH), 148 ha (2017) vs. 88 ha (2018)* |
| ▼ 54%, Manokin River Segment 2 (MANMH2), 40 ha (2017) vs. 19 ha (2018) |
| ▼ 74%, Lower Patuxent River Segment 1 (PAXMH1), 53 ha (2017) vs. 14 ha (2018) |
Thirteen of the 41 segments remained unvegetated in 2018.
* Segment comparison restricted to areas mapped in both 2017 and 2018
Polyhaline Bay Salinity Zone
In the Polyhaline Bay Zone (8 CBP segments), SAV increased 19% from 6,172 ha (15,251 ac) in 2017 to 7,362 ha (18,192 ac) in 2018.
| One of the 8 segments increased by at least 20% and by at least 5 ha from 2017 totals: |
|---|
| ▲ 48%, Eastern Lower Chesapeake Bay (CB7PH), 2533 ha (2017) vs. 3758 ha (2018) |
| One of the 8 segments decreased by at least 20% and by at least 5 ha from 2017 totals: |
|---|
| ▼ 33%, Lower York River (YRKPH), 249 ha (2017) vs. 167 ha (2018) |
Two of the 8 segments remained unvegetated in 2018.
Delmarva Peninsula Coastal Bays Zone
In the Delmarva Peninsula Coastal Bays Zone (10 segments covering Assawoman, Isle of Wight, Sinepuxent, Chincoteague, and Southern Virginia coastal bays), 3,613 hectares (8,927 ac) of SAV were mapped for 2018. However, the northern portion of the zone, including Chincoteague Bay and Maryland coastal bays, representing 3,641 ha of SAV in 2017 (8,996 ac, 55% of the zone total) was not mapped for 2018. Comparing the same mapped regions between 2017 and 2018, SAV increased 23% from 2,929 hectares (7,238 ac) in 2017 to 3,613 hectares (8,927 ac) in 2018.
| Three of the 10 segments increased by at least 20% and by at least 5 ha from 2017 totals: |
|---|
| ▲ 29%, Hog Island Bay (SVCPH2), 256 ha (2017) vs. 329 ha (2018) |
| ▲ 28%, Spidercrab Bay (SVCPH3), 485 ha (2017) vs. 621 ha (2018) |
| ▲ 26%, South Bay (SVCPH5), 1605 ha (2017) vs. 2028 ha (2018) |
Two of the 10 segments remained unvegetated in 2018.