2017 SAV Executive Summary
The 2017 distribution of submerged aquatic vegetation (SAV) in Chesapeake Bay and its tributaries was mapped from multispectral digital imagery. These were acquired between May and November 2017, with a resolution of 24 cm, encompassing 189 flight lines. National Agricultural Imagery Program (NAIP) imagery was used to augment the multispectral imagery in a portion of the Choptank and Potomac Rivers, as well as Bloodsworth Island and Eastern Bay.
Chesapeake Bay
For 2017, 42,448 hectares (104,893 acres) of SAV were mapped in Chesapeake Bay and its tributaries.
Although the Chesapeake Bay and its tributaries were fully mapped for 2017, weather conditions and security restrictions in the DC area, over Patuxent Air Base and associated mid-Bay areas prevented acquisition of useable imagery in 2016 for a portion of the tidal fresh and mesohaline Potomac River, including Piscataway Creek and St. Marys River, preventing those regions from being fully mapped for 2016. In order to ensure a valid analysis of change in SAV distribution and abundance with 2016, all direct comparisons to previous years in this report are restricted to only those regions that were mapped in both years. If a region was not mapped in 2016, comparisons are given using area totals from 2015 instead. The area that was not fully mapped in 2016 supported 822 ha of SAV in 2017 (2031 acres, 2% of the 2017 Bay total).
Notable changes in SAV distribution were measured between 2017 and 2016. SAV increased 5% from 39,512 ha (97,638 ac) to 41,616 ha (102,837 ac) in the regions mapped for both years.
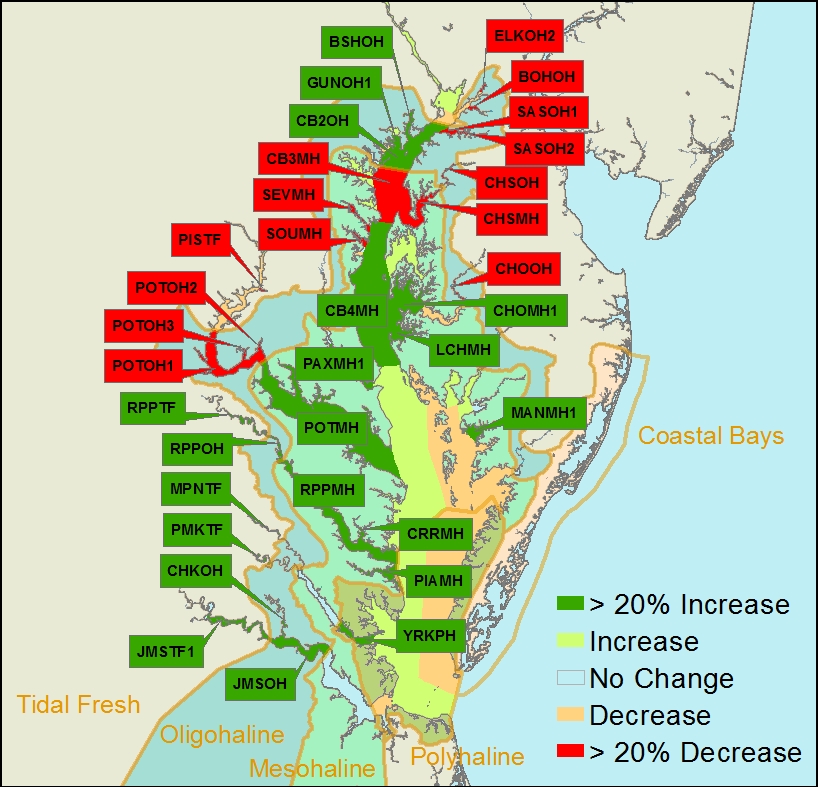
SAV increased in the Tidal Fresh, Mesohaline, and Polyhaline salinity zones and decreased in the Oligohaline salinity zone in the Chesapeake Bay. In 2017, SAV increased in 37, decreased in 30, and remained unvegetated in 26 of the 93 CBP segments.
Segment Comparison Map
|
The 2,104 ha increase in Baywide SAV coverage within the area that was fully mapped makes 2017 the third consecutive year with more area of SAV reported for the Bay than at any prior year in the history of the Baywide annual aerial survey (1984 - 2017). This represents a continued recovery from strong declines in 2011 and 2012 that reduced SAV abundance to a level last reported for the Bay in 1986. In the Mesohaline salinity zone widgeongrass continued to increase. However, this species has had boom and bust cycles throughout the history of this survey. A similar rapid increase in widgeongrass in 2001 and 2002 was followed by an approximately 50% loss the following year. After a decrease in 2016, SAV increased in the Polyhaline salinity zone following several years of recovery of eelgrass from the loss that occurred during the hot summers of 2005 and 2010.
Recent research using advanced statistical modeling has strongly tied the resurgence of SAV in Chesapeake Bay through 2015 to reductions in nitrogen and phosphorus loading into the Bay (Lefcheck et al, 2018). The continued recovery of SAV in the Bay the following two years, including 2017, are additional evidence that nutrient reductions from EPA’s Total Maximum Daily Load (TMDL) along with conservation incentives are resulting in a healthier Chesapeake Bay.
Tidal Fresh Bay Salinity Zone
In the Tidal Fresh Bay Zone (19 CBP segments), 8,054 hectares (19,903 ac) of SAV were mapped for 2017. However, portions of the zone, including the portion of the Potomac River from Broad Creek to Pomoney Creek, those creeks, and Piscataway Creek, representing 529 ha of SAV in 2017 (1,307 ac, 7% of the zone total) were not mapped for 2016. Comparing the same mapped regions between 2016 and 2017, SAV increased 7% from 7,039 hectares (17,393 ac) in 2016 to 7,516 hectares (18,572 ac) in 2017.
| Four of the 19 segments increased by at least 20% and by at least 5 ha from 2016 totals: |
|---|
| ▲ 89%, Upper Rappahannock River (RPPTF), 121 ha (2016) vs. 228 ha (2017) |
| ▲ 100%, Upper Mattaponi River (MPNTF), 0 ha (2016) vs. 62 ha (2017) |
| ▲ 22%, Upper Pamunkey River (PMKTF), 332 ha (2016) vs. 405 ha (2017) |
| ▲ 390%, Upper James River Segment 1 (JMSTF1), 37 ha (2016) vs. 181 ha (2017) |
| One of the 19 segments decreased by at least 20% and by at least 5 ha from 2016 totals: |
|---|
| ▼ 36%, Piscataway Creek (PISTF), 219 ha (2015) vs. 140 ha (2017)** |
Seven of the 19 segments remained unvegetated in 2017.
**Segment comparison restricted to areas mapped in both 2015 and 2017
Oligohaline Bay Salinity Zone
In the Oligohaline Bay Zone (25 CBP segments), SAV decreased 2% from 3,475 hectares (8,588 ac) in 2016 to 3,395 hectares (8,389 ac) in 2017.
Six of the 25 segments increased by at least 20% and by at least 5 ha from 2016 totals: |
|---|
| ▲ 55%, Upper Chesapeake Bay (CB2OH), 124 ha (2016) vs. 192 ha (2017) |
| ▲ 103%, Bush River (BSHOH), 25 ha (2016) vs. 51 ha (2017) |
| ▲ 131%, Gunpowder River Segment 1 (GUNOH1), 73 ha (2016) vs. 169 ha (2017) |
| ▲ 35%, Middle Rappahannock River (RPPOH), 53 ha (2016) vs. 71 ha (2017) |
| ▲ 149%, Chickahominy River (CHKOH), 196 ha (2016) vs. 489 ha (2017) |
| ▲ 37%, Middle James River (JMSOH), 21 ha (2016) vs. 29 ha (2017) |
| Nine of the 25 segments decreased by at least 20% and by at least 5 ha from 2016 totals: |
|---|
| ▼ 21%, Elk River Segment 2 (ELKOH2), 70 ha (2016) vs. 55 ha (2017) |
| ▼ 54%, Bohemia River (BOHOH), 129 ha (2016) vs. 59 ha (2017) |
| ▼ 87%, Sassafras River Segment 1 (SASOH1), 69 ha (2016) vs. 9 ha (2017) |
| ▼ 69%, Sassafras River Segment 2 (SASOH2), 26 ha (2016) vs. 8 ha (2017) |
| ▼ 29%, Middle Chester River (CHSOH), 40 ha (2016) vs. 28 ha (2017) |
| ▼ 100%, Middle Choptank River (CHOOH), 11 ha (2016) vs. 0 ha (2017) |
| ▼ 26%, Middle Potomac River Segment 1 (POTOH1), 924 ha (2016) vs. 681 ha (2017) |
| ▼ 100%, Middle Potomac River Segment 2 (POTOH2), 39 ha (2016) vs. 0 ha (2017) |
| ▼ 61%, Middle Potomac River Segment 3 (POTOH3), 95 ha (2016) vs. 37 ha (2017) |
Five of the 25 segments remained unvegetated in 2017.
Mesohaline Bay Salinity Zone
In the Mesohaline Bay Salinity Zone (41 CBP segments), 24,827 hectares (61,350 ac) of SAV were mapped for 2017. However, portions of the zone, including the north shore of the Potomac River from Herring Creek to Smith Creek, those creeks, and the St. Marys River, representing 293 ha of SAV in 2017 (724 ac, 1% of the zone total) were not mapped for 2016. Comparing the same mapped regions between 2016 and 2017, SAV increased 6% from 23,142 hectares (57,185 ac) in 2016 to 24,534 hectares (60,626 ac) in 2017.
| Nine of the 41 segments increased by at least 20% and by at least 5 ha from 2016 totals: |
|---|
| ▲ 36%, Middle Central Chesapeake Bay (CB4MH), 14 ha (2016) vs. 19 ha (2017) |
| ▲ 20%, Mouth of the Choptank River (CHOMH1), 2933 ha (2016) vs. 3527 ha (2017) |
| ▲ 33%, Little Choptank River (LCHMH), 744 ha (2016) vs. 988 ha (2017) |
| ▲ 24%, Manokin River Segment 1 (MANMH1), 588 ha (2016) vs. 728 ha (2017) |
| ▲ 301%, Lower Patuxent River Segment 1 (PAXMH1), 13 ha (2016) vs. 53 ha (2017) |
| ▲ 40%, Lower Potomac River (POTMH), 14 ha (2016) vs. 20 ha (2017)* |
| ▲ 71%, Lower Rappahannock River (RPPMH), 659 ha (2016) vs. 1128 ha (2017) |
| ▲ 68%, Corrotoman River (CRRMH), 155 ha (2016) vs. 259 ha (2017) |
| ▲ 65%, Piankatank River (PIAMH), 309 ha (2016) vs. 509 ha (2017) |
| Four of the 41 segments decreased by at least 20% and by at least 5 ha from 2016 totals: |
|---|
| ▼ 56%, Upper Central Chesapeake Bay (CB3MH), 253 ha (2016) vs. 110 ha (2017) |
| ▼ 49%, Lower Chester River (CHSMH), 187 ha (2016) vs. 95 ha (2017) |
| ▼ 31%, Severn River (SEVMH), 114 ha (2016) vs. 79 ha (2017) |
| ▼ 100%, South River (SOUMH), 6 ha (2016) vs. 0 ha (2017) |
Twelve of the 41 segments remained unvegetated in 2017.
* Segment comparison restricted to areas mapped in both 2016 and 2017
Polyhaline Bay Salinity Zone
In the Polyhaline Bay Zone (8 CBP segments), SAV increased 5% from 5,856 ha (14,471 ac) in 2016 to 6,172 ha (15,251 ac) in 2017.
| One of the 8 segments increased by at least 20% and by at least 5 ha from 2016 totals: |
|---|
| ▲ 27%, Lower York River (YRKPH), 196 ha (2016) vs. 249 ha (2017) |
None of the 8 segments decreased by at least 20% and by at least 5 ha from 2016 totals.
Two of the 8 segments remained unvegetated in 2017.
Delmarva Peninsula Coastal Bays Zone
For 2017, 6,570 hectares (16,234 ac) were mapped in the Delmarva Peninsula Coastal Bays Zone (Assawoman, Isle of Wight, Sinepuxent, Chincoteague, and Southern Virginia coastal bays).
Conditions in 2016 prevented us from mapping the Delmarva Peninsula coastal bays. Therefore all comparisons are made to 2015, the most recent year that this area was fully mapped.
In the Delmarva Coastal Bays Zone (10 CBP segments), SAV increased 9% from 6,039 ha (14,924 ac) in 2015 to 6,570 ha (16,234 ac) in 2017.
| Two of the 10 segments increased by at least 20% and by at least 5 ha from 2015 totals: |
|---|
| ▲ 76%, Hog Island Bay (SVCPH2), 146 ha (2015) vs. 256 ha (2017)** |
| ▲ 108%, Spidercrab Bay (SVCPH3), 233 ha (2015) vs. 485 ha (2017)** |
None of the 10 segments decreased by at least 20% or by at least 5 ha from 2015 totals.
Four of the 10 segments remained unvegetated in 2017.
**Segment comparison restricted to areas mapped in both 2015 and 2017
---
Lefcheck, Jonathan S., Orth, Robert J., Dennison, William C., Wilcox, David J., Murphy, Rebecca R., Keisman, Jennifer, Gurbisz, Cassie, Hannam, Michael, Landry, J. B., Moore, Kenneth A., Patrick, Christopher J., Testa, Jeremy, Weller, Donald E. and Batiuk, Richard A. (2018). Long-term nutrient reductions lead to the unprecedented recovery of a temperate coastal region. Proceedings of the National Academy of Sciences of the United States of America, http://dx.doi.org/10.1073/pnas.1715798115.