2016 SAV Executive Summary
The 2016 distribution of submerged aquatic vegetation (SAV) in Chesapeake Bay and its tributaries was mapped from multispectral digital imagery. These were acquired between May and November 2016, with a resolution of 24 cm, encompassing 171 flight lines. National Agricultural Imagery Program (NAIP) imagery was used to augment the multispectral imagery in a portion of the Potomac, James, and Pamunkey rivers; Pungoteague Creek; and Mobjack Bay. Turbid conditions and poor weather conditions in 2016 prevented us from mapping the Delmarva Peninsula Coastal Bays.
Chesapeake Bay
For 2016, 39,524 hectares (97,668 acres) of SAV were mapped in Chesapeake Bay and its tributaries. However, weather conditions and security restrictions in the DC area, over Patuxent Air Base and associated mid-Bay areas prevented acquisition of useable imagery for a portion of the tidal fresh and mesohaline Potomac River, including Piscataway Creek and St. Marys River. A small portion of this area was covered by NAIP imagery under conditions that were appropriate for mapping SAV. The area that was not fully mapped in 2016 supported 801.75 ha of SAV in 2015 (1981.20 acres, 2% of the 2015 Bay total).
In order to ensure a valid analysis of change in SAV distribution and abundance given the reduced region mapped in 2016, all direct comparisons to previous years in this report are restricted to only those regions that were mapped in both years. Partial totals for 2015 have been computed for CBP segments, Bay zones, and the entire Bay using only those regions mapped for both years.
Notable changes in SAV distribution were measured between 2016 and 2015. SAV increased 8% from 36,556 ha (90,334 ac) to 39,512 ha (97,638 ac) in the regions mapped for both years.
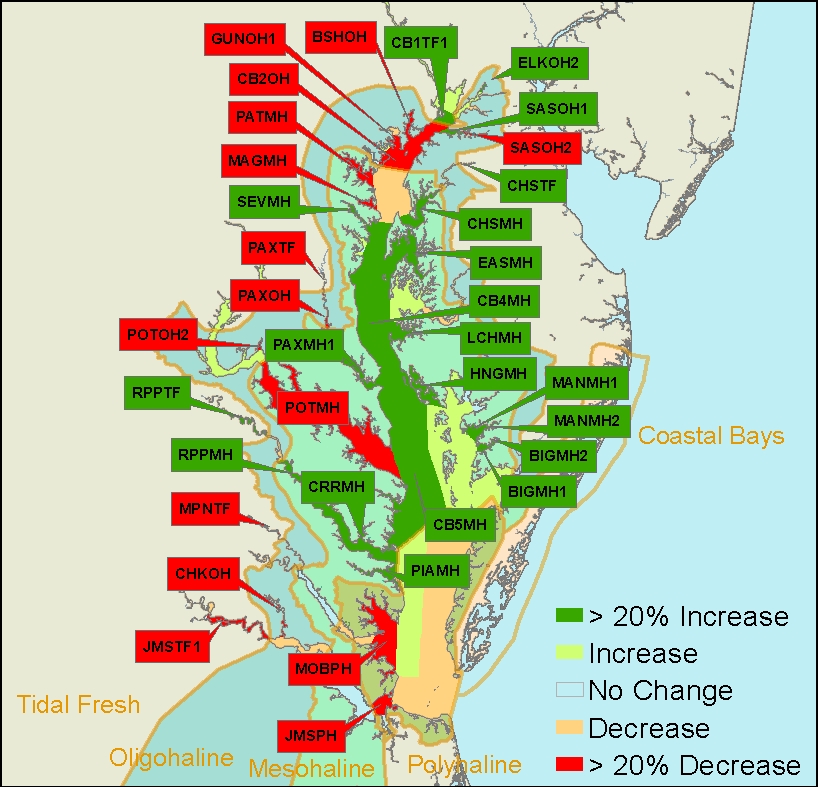
SAV increased in the Tidal Fresh and Mesohaline salinity zones and decreased in the Oligohaline and Polyhaline salinity zones in the Chesapeake Bay. In 2016, SAV increased in 40, decreased in 27, and remained unvegetated in 26 of the 93 CBP segments.
Segment Comparison Map
|
The 2,956 ha increase in Baywide SAV coverage within the area that was fully mapped makes 2016 the second consecutive year with more area of SAV reported for the Bay than at any prior year in the history of the Baywide annual aerial survey (1984 - 2016). Given the trends in the areas mapped, the SAV in the unmapped areas likely would put the complete Bay area total close to 40,000 ha. This represents a continued recovery from strong declines in 2011 and 2012 that reduced SAV abundance to a level last reported for the Bay in 1986. The 2016 increase was the result of a strong increase in the Tidal Fresh and Mesohaline salinity zones (609 ha and 3,851 ha in fully mapped areas, respectively). In the Mesohaline salinity zone widgeongrass continued to increase. However, this species has had boom and bust cycles throughout the history of this survey. A similar rapid increase in widgeongrass in 2001 and 2002 was followed by an approximately 50% loss the following year. SAV decreased in the Polyhaline salinity zone following several years of recovery of eelgrass from the loss that occurred during the hot summers of 2005 and 2010.
Tidal Fresh Bay Salinity Zone
In the Tidal Fresh Bay Zone (19 CBP segments), 7,039 hectares (17,393 ac) of SAV were mapped for 2016. However, portions of the zone, including the portion of the Potomac River from Broad Creek to Pomoney Creek, those creeks, and Piscataway Creek, representing 643 ha of SAV in 2015 (1,588 ac, 9% of the zone total) were not mapped for 2016. Comparing the same mapped regions between 2015 and 2016, SAV increased 9% from 6,430 hectares (15,889 ac) in 2015 to 7,039 hectares (17,393 ac) in 2016.
| Three of the 19 segments increased by at least 20% and by at least 5 ha from 2015 totals: |
|---|
| ▲ 25%, Northern Chesapeake Bay Segment 1 (CB1TF1), 193 ha (2015) vs. 242 ha (2016) |
| ▲ 75%, Upper Rappahannock River (RPPTF), 69 ha (2015) vs. 121 ha (2016) |
| ▲ 2380%, Upper Chester River (CHSTF), 6 ha (2015) vs. 146 ha (2016) |
In addition, the Upper Potomac River, though not fully mapped, increased by 19% in the area mapped, adding 377 ha (932 ac) to the Tidal Fresh Bay Zone total for 2016.
| Three of the 19 segments decreased by at least 20% and by at least 5 ha from 2015 totals: |
|---|
| ▼ 100%, Upper Patuxent River (PAXTF), 38 ha (2015) vs. 0 ha (2016) |
| ▼ 100%, Upper Mattaponi River (MPNTF), 164 ha (2015) vs. 0 ha (2016) |
| ▼ 84%, Upper James River Segment 1 (JMSTF1), 229 ha (2015) vs. 37 ha (2016) |
Six of the 19 segments remained unvegetated in 2016.
Oligohaline Bay Salinity Zone
In the Oligohaline Bay Zone (25 CBP segments), SAV decreased 15% from 4,091 hectares (10,109 ac) in 2015 to 3,475 hectares (8,588 ac) in 2015.
| Two of the 25 segments increased by at least 20% and by at least 5 ha from 2015 totals: |
|---|
| ▲ 39%, Sassafras River Segment 1 (SASOH1), 49 ha (2015) vs. 69 ha (2016) |
| ▲ 43%, Elk River Segment 2 (ELKOH2), 49 ha (2015) vs. 70 ha (2016) |
| Seven of the 25 segments decreased by at least 20% and by at least 5 ha from 2015 totals: |
|---|
| ▼ 28%, Upper Chesapeake Bay (CB2OH), 172 ha (2015) vs. 124 ha (2016) |
| ▼ 38%, Sassafras River Segment 2 (SASOH2), 42 ha (2015) vs. 26 ha (2016) |
| ▼ 83%, Bush River (BSHOH), 148 ha (2015) vs. 25 ha (2016) |
| ▼ 48%, Gunpowder River Segment 1 (GUNOH1), 139 ha (2015) vs. 73 ha (2016) |
| ▼ 100%, Middle Patuxent River (PAXOH), 13 ha (2015) vs. 0 ha (2016) |
| ▼ 67%, Middle Potomac River Segment 2 (POTOH2), 116 ha (2015) vs. 39 ha (2016) |
| ▼ 63%, Chickahominy River (CHKOH), 527 ha (2015) vs. 196 ha (2016) |
Five of the 25 segments remained unvegetated in 2016.
Mesohaline Bay Salinity Zone
In the Mesohaline Bay Salinity Zone (41 CBP segments), 23,144 hectares (57,191 ac) of SAV were mapped for 2016. However, portions of the zone, including the north shore of the Potomac River from Herring Creek to Smith Creek, those creeks, and the St. Marys River, representing 159 ha of SAV in 2015 (393 ac, 1% of the zone total) were not mapped for 2016. Comparing the same mapped regions between 2015 and 2016, SAV increased 20% from 19,290 hectares (47,668 ac) in 2015 to 23,142 hectares (57,185 ac) in 2016.
| Fifteen of the 41 segments increased by at least 20% and by at least 5 ha from 2015 totals: |
|---|
| ▲ 21%, Lower Chester River (CHSMH), 155 ha (2015) vs. 187 ha (2016) |
| ▲ 100%, Middle Central Chesapeake Bay (CB4MH), 0 ha (2015) vs. 14 ha (2016) |
| ▲ 55%, Eastern Bay (EASMH), 609 ha (2015) vs. 947 ha (2016) |
| ▲ 117%, Little Choptank River (LCHMH), 343 ha (2015) vs. 744 ha (2016) |
| ▲ 22%, Severn River (SEVMH), 94 ha (2015) vs. 114 ha (2016) |
| ▲ 40%, Lower Central Chesapeake Bay (CB5MH), 1497 ha (2015) vs. 2094 ha (2016) |
| ▲ 27%, Honga River (HNGMH), 2516 ha (2015) vs. 3184 ha (2016) |
| ▲ 22%, Manokin River Segment 1 (MANMH1), 483 ha (2015) vs. 588 ha (2016) |
| ▲ 155%, Manokin River Segment 2 (MANMH2), 16 ha (2015) vs. 41 ha (2016) |
| ▲ 25%, Big Annemessex River Segment 1 (BIGMH1), 490 ha (2015) vs. 614 ha (2016) |
| ▲ 253%, Big Annemessex River Segment 2 (BIGMH2), 4 ha (2015) vs. 15 ha (2016) |
| ▲ 84%, Lower Patuxent River Segment 1 (PAXMH1), 7 ha (2015) vs. 13 ha (2016) |
| ▲ 38%, Lower Rappahannock River (RPPMH), 477 ha (2015) vs. 659 ha (2016) |
| ▲ 40%, Corrotoman River (CRRMH), 110 ha (2015) vs. 155 ha (2016) |
| ▲ 51%, Piankatank River (PIAMH), 205 ha (2015) vs. 309 ha (2016) |
| Three of the 41 segments decreased by at least 20% and by at least 5 ha from 2015 totals: |
|---|
| ▼ 91%, Patapsco River (PATMH), 16 ha (2015) vs. 1 ha (2016) |
| ▼ 53%, Magothy River (MAGMH), 13 ha (2015) vs. 6 ha (2016) |
| ▼ 88%, Lower Potomac River (POTMH), 114 ha (2015) vs. 14 ha (2016)* |
Fourteen of the 41 segments remained unvegetated in 2016.
* Segment comparison restricted to areas mapped in both 2015 and 2016
Polyhaline Bay Salinity Zone
In the Polyhaline Bay Zone (8 CBP segments), SAV decreased 13% from 6,745 ha (16,667 ac) in 2015 to 5,856 ha (14,471 ac) in 2016.
None of the 8 segments increased by at least 20% and by at least 5 ha from 2015 totals.
| Two of the 8 segments decreased by at least 20% and by at least 5 ha from 2015 totals: |
|---|
| ▼ 24%, Mobjack Bay (MOBPH), 3319 ha (2015) vs. 2528 ha (2016) |
| ▼ 24%, Mouth of the James River (JMSPH), 149 ha (2015) vs. 113 ha (2016) |