2015 SAV Executive Summary
The 2015 distribution of submerged aquatic vegetation (SAV) in Chesapeake Bay and its tributaries was mapped primarily from multispectral digital imagery and supplemented with black and white aerial photographs for a small set of areas. These were acquired between May and November 2015, with a resolution of 24 cm, encompassing 186 flight lines.
Chesapeake Bay
For 2015, 37,358 hectares (92,315 acres) of SAV were mapped in Chesapeake Bay and its tributaries.
Notable changes in SAV distribution were measured between 2015 and 2014. SAV increased 22% from 30,528 ha (75,438 ac) to 37,358 ha (92,315 ac).
SAV increased in all four (Tidal Fresh, Oligohaline, Mesohaline, and Polyhaline) salinity zones in the Chesapeake Bay. In 2015, SAV increased in 54, decreased in 13, and remained unvegetated in 26 of the 93 CBP segments.
Segment Comparison Map
|
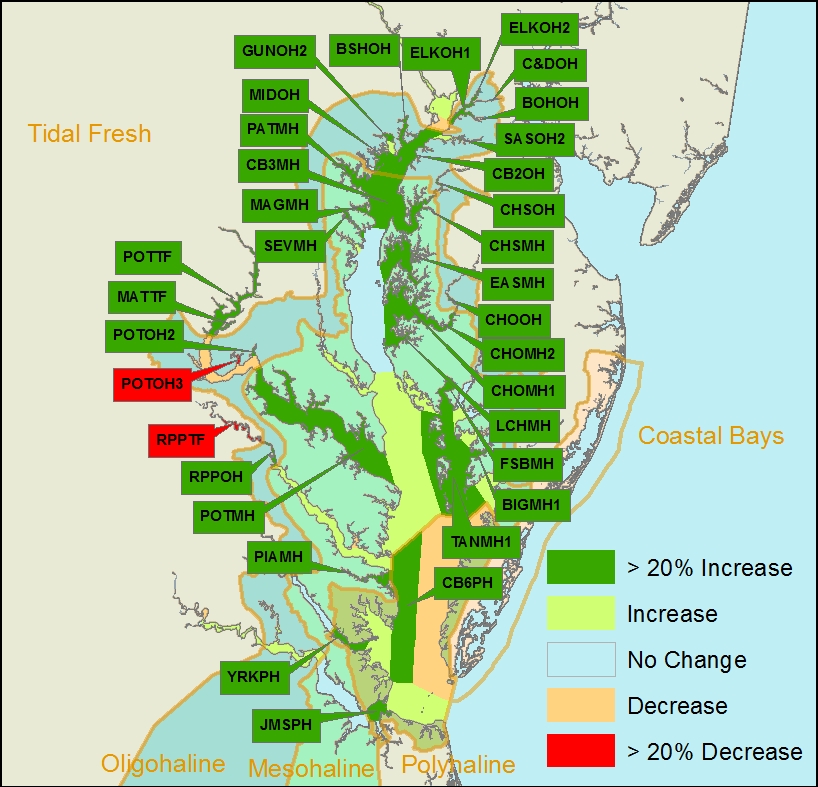
The 6,830 ha increase in baywide SAV coverage in 2015 resulted in the most area of SAV reported for the Bay in the history of the Baywide annual areal survey (1984 - 2015). This represents a continued recovery from strong declines in 2011 and 2012 that reduced SAV abundance to a level last reported for the Bay in 1986. The 2015 increase was the result of a strong increase in the Mesohaline (4,457 ha), and Oligohaline (1,177 ha) salinity zones and smaller relative increases in the Tidal Fresh (802 ha) and Polyhaline (393 ha) salinity zones. In 2015, the increase in the Mesohaline salinity zone is due primarily to a continuing rapid expansion of widgeongrass, including in areas where SAV had not been mapped by previous surveys. However this species has had boom and bust cycles throughout the history of this survey. A similar rapid increase in widgeongrass in 2001 and 2002 was followed by an approximately 50% loss the following year. There has been a modest recovery of eelgrass in the polyhaline areas where the hot summers of 2005 and 2010 resulted in dramatic diebacks. The largest SAV bed in the bay, on the Susquehanna Flats in segment CB1TF1, persisted through 2012 and continues to increase in coverage, returning to areas impacted by Hurricane Irene and Tropical Storm Lee in 2011.
Tidal Fresh Bay Salinity Zone
In the Tidal Fresh Bay Zone (19 CBP segments), SAV increased 13% from 6,270 ha (15,495 ac) in 2014 to 7,073 ha (17,477 ac) in 2015.
| Two of the 19 segments increased by at least 20% and by at least 5 ha from 2014 totals: |
|---|
| ▲ 27%, Upper Potomac River (POTTF), 1878 ha (2014) vs. 2391 ha (2015) |
| ▲ 39%, Mattawoman Creek (MATTF), 194 ha (2014) vs. 270 ha (2015) |
| One of the 19 segments decreased by at least 20% and by at least 5 ha from 2014 totals. |
|---|
| ▼ 58%, Upper Rappahannock River (RPPTF), 165 ha (2014) vs. 69 ha (2015) |
Four of the 19 segments remained unvegetated in 2015.
Oligohaline Bay Salinity Zone
In the Oligohaline Bay Zone (25 CBP segments), SAV increased 40% from 2,914 hectares (7,200 ac) in 2014 to 4,091 hectares (10,109 ac) in 2015.
| Thirteen of the 25 segments increased by at least 20% and by at least 5 ha from 2014 totals: |
|---|
| ▲ 407%, Elk River Segment 1 (ELKOH1), 170 ha (2014) vs. 862 ha (2015) |
| ▲ 945%, Elk River Segment 2 (ELKOH2), 5 ha (2014) vs. 49 ha (2015) |
| ▲ 491%, Bohemia River (BOHOH), 26 ha (2014) vs. 151 ha (2015) |
| ▲ 2824%, Chesapeake & Delaware Canal (C&DOH), 0 ha (2014) vs. 7 ha (2015) |
| ▲ 41%, Upper Chesapeake Bay (CB2OH), 122 ha (2014) vs. 172 ha (2015) |
| ▲ 5193%, Sassafras River Segment 2 (SASOH2), 14 ha (2014) vs. 42 ha (2015) |
| ▲ 65%, Bush River (BSHOH), 90 ha (2014) vs. 148 ha (2015) |
| ▲ 52%, Gunpowder River Segment 2 (GUNOH2), 238 ha (2014) vs. 361 ha (2015) |
| ▲ 62%, Middle River (MIDOH), 210 ha (2014) vs. 340 ha (2015) |
| ▲ 376%, Middle Chester River (CHSOH), 8 ha (2014) vs. 38 ha (2015) |
| ▲ 1000%, Middle Choptank River (CHOOH), 0 ha (2014) vs. 8 ha (2015) |
| ▲ 53%, Middle Potomac River Segment 2 (POTOH2), 76 ha (2014) vs. 116 ha (2015) |
| ▲ 38%, Middle Rappahannock River (RPPOH), 43 ha (2014) vs. 59 ha (2015) |
| One of the 25 segments decreased by at least 20% and by at least 5 ha from 2014 totals: |
|---|
| 47%, Middle Potomac River Segment 3 (POTOH3), 151 ha (2014) vs. 81 ha (2015) |
Five of the 25 segments remained unvegetated in 2015.
Mesohaline Bay Salinity Zone
In the Mesohaline Bay Zone (41 CBP segments), SAV increased 30% from (14,992 hectares (37,048 ac) in 2014 to 19,450 hectares (37,048 ac) in 2015.
| Fourteen of the 41 segments increased by at least 20% and by at least 5 ha from 2014 totals: |
|---|
| ▲ 74%, Upper Central Chesapeake Bay (CB3MH), 147 ha (2014) vs. 255 ha (2015) |
| ▲ 136%, Patapsco River (PATMH), 7 ha (2014) vs. 16 ha (2015) |
| ▲ 67%, Magothy River (MAGMH), 8 ha (2014) vs. 13 ha (2015) |
| ▲ 167%, Lower Chester River (CHSMH), 58 ha (2014) vs. 155 ha (2015) |
| ▲ 596%, Eastern Bay (EASMH), 87 ha (2014) vs. 609 ha (2015) |
| ▲ 59%, Mouth of the Choptank River (CHOMH1), 1535 ha (2014) vs. 2447 ha (2015) |
| ▲ 66%, Lower Choptank River (CHOMH2), 8 ha (2014) vs. 13 ha (2015) |
| ▲ 252%, Little Choptank River (LCHMH), 98 ha (2014) vs. 343 ha (2015) |
| ▲ 61%, Severn River (SEVMH), 58 ha (2014) vs. 94 ha (2015) |
| ▲ 49%, Fishing Bay (FSBMH), 77 ha (2014) vs. 115 ha (2015) |
| ▲ 22%, Tangier Sound Segment 1 (TANMH1), 6850 ha (2014) vs. 8332 ha (2015) |
| ▲ 25%, Big Annemessex River Segment 1 (BIGMH1), 391 ha (2014) vs. 490 ha (2015) |
| ▲ 65%, Lower Potomac River (POTMH), 165 ha (2014) vs. 273 ha (2015) |
| ▲ 54%, Piankatank River (PIAMH), 133 ha (2014) vs. 205 ha (2015) |
None of the 41 segments decreased by at least 20% and by at least 5 ha from 2014 totals.
Sixteen of the 41 segments remained unvegetated in 2015.
Polyhaline Bay Salinity Zone
In the Polyhaline Bay Zone (8 CBP segments), SAV increased 6% from 6,352 ha (15,696 ac) in 2014 to 6,745 ha (16,667 ac) in 2015.
| Three of the 8 segments increased by at least 20% and by at least 5 ha from 2014 totals: |
|---|
| ▲ 51%, Western Lower Chesapeake Bay (CB6PH), 140 ha (2014) vs. 210 ha (2015) |
| ▲ 34%, Lower York River (YRKPH), 182 ha (2014) vs. 244 ha (2015) |
| ▲ 35%, Mouth of the James River (JMSPH), 110 ha (2014) vs. 149 ha (2015) |
Delmarva Peninsula Coastal Bays Zone
For 2015, 6,039 hectares (14,924 ac) were mapped in the Delmarva Peninsula Coastal Bays Zone (Assawoman, Isle of Wight, Sinepuxent, Chincoteague, and Southern Virginia coastal bays).
Turbid conditions in 2014 prevented us from mapping the Southern Virginia coastal bays. Therefore comparisons are made to 2012, the most recent year that this area was fully mapped.
| Two of the 10 segments increased by at least 20% and by at least 5 ha from 2012 or 2014 totals: |
|---|
| ▲ 63%, Cobb Bay (SVCPH4), 360 ha (2012) vs. 588 ha (2015) |
| ▲ 44%, South Bay (SVCPH5), 1,067 ha (2012) vs. 1,541 ha (2015) |
| Two of the 10 segments decreased by at least 20% and by at least 5 ha from 2012 or 2014 totals: |
|---|
| ▼ 100%, Isle of Wight Bay (IOWPH), 7 ha (2014) vs. 0 ha (2015) |
| ▼ 20%, Hog Island Bay (SVCPH2), 183 ha (2012) vs. 146 ha (2015) |