2014 SAV Executive Summary
The 2014 distribution of submerged aquatic vegetation (SAV) in Chesapeake Bay and its tributaries was mapped from black and white aerial photographs and multispectral digital imagery. These were acquired between May and November 2014, at a scale of 1:24,000, encompassing 160 flight lines. Weather conditions and security restrictions in the DC area prevented acquisition of six lines. Luckily this area happened to be covered by the National Agricultural Imagery Program under conditions that were appropriate for mapping SAV, permitting the compilation of a complete Bay SAV dataset for 2014.
Turbid conditions in 2014 prevented the acquisition of imagery suitable to map the Southern Virginia Coastal Bays.
Chesapeake Bay
For 2014, 30,528 hectares (75,438 acres) of SAV were mapped in Chesapeake Bay and its tributaries.
Notable changes in SAV distribution were measured between 2014 and 2013. SAV increased 26% from 24,164 ha (59,711 ac) to 30,528 ha (75,438 ac).
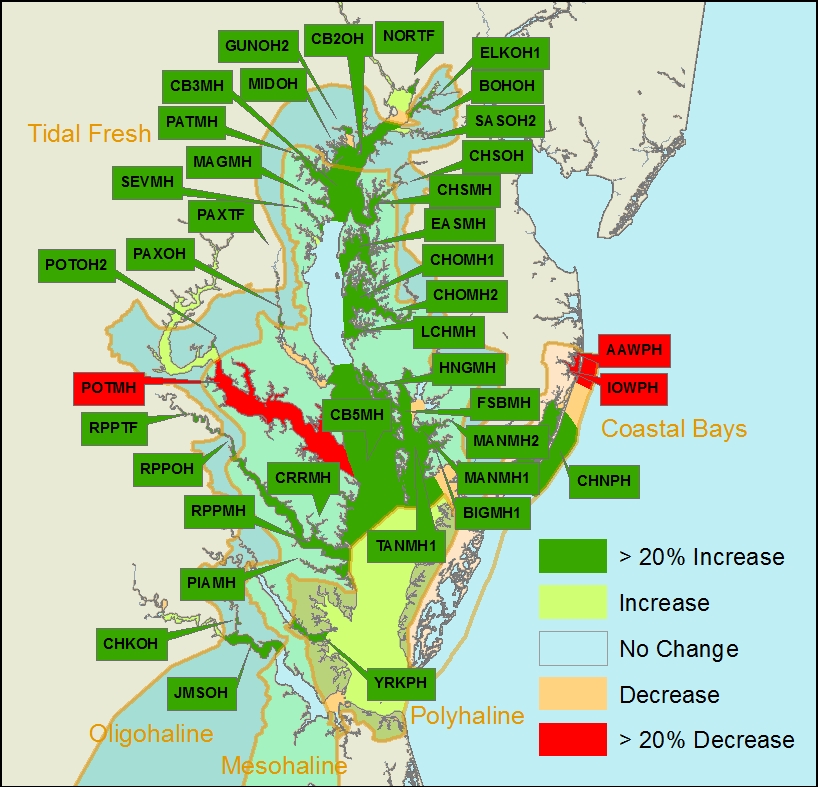
SAV increased in all four (Tidal Fresh, Oligohaline, Mesohaline, and Polyhaline) salinity zones in the Chesapeake Bay. In 2014, SAV increased in 54, decreased in 12, and remained unvegetated in 27 of the 93 CBP segments.
Segment Comparison Map
|
The 6,525 ha increase in baywide SAV coverage in 2014 represents a continued recovery from strong declines in 2011 and 2012 that reduced SAV abundance to a level last reported for the Bay in 1986. The 2014 increase was the result of a strong increase in the Mesohaline (4,710 ha), and Oligohaline (642 ha) salinity zones and smaller relative increases in the Tidal Fresh (611 ha) and Polyhaline (402 ha) salinity zones. In 2014, the increase in the Mesohaline salinity zone is due primarily to a continuing rapid expansion of widgeongrass, including in areas where SAV had not been mapped by previous surveys. However this species has had boom and bust cycles throughout the history of this survey. In addition, we are noting a modest recovery of eelgrass in the polyhaline areas where the hot summers of 2005 and 2010 resulted in dramatic diebacks. The largest SAV bed in the bay, on the Susquehanna Flats in segment CB1TF1, persisted through 2012 and continues to increase in coverage, returning to areas impacted by Hurricane Irene and Tropical Storm Lee in 2011.
Tidal Fresh Bay Salinity Zone
In the Tidal Fresh Bay Zone (19 CBP segments), SAV increased 11% from 5,659 ha (13,985 ac) in 2013 to 6,270 ha (15,495 ac) in 2014.
| Three of the 19 segments increased by at least 20% and by at least 5 ha from 2013 totals: |
|---|
| ▲ 36%, Northeast River (NORTF), 21 ha (2013) vs. 29 ha (2014) |
| ▲ 584%, Upper Patuxent River (PAXTF), 6 ha (2013) vs. 41 ha (2014) |
| ▲ 408%, Upper Rappahannock River (RPPTF), 32 ha (2013) vs. 165 ha (2014) |
Four of the 19 segments remained unvegetated in 2014.
Oligohaline Bay Salinity Zone
In the Oligohaline Bay Zone (25 CBP segments), SAV increased 328% from 2,272 hectares (5,613 ac) in 2013 to 2,914 hectares (7,200 ac) in 2014.
| Twelve of the 25 segments increased by at least 20% and by at least 5 ha from 2013 totals: |
|---|
| ▲ 268%, Elk River Segment 1 (ELKOH1), 46 ha (2013) vs. 170 ha (2014) |
| ▲ 77%, Bohemia River (BOHOH), 14 ha (2013) vs. 26 ha (2014) |
| ▲ 221%, Upper Chesapeake Bay (CB2OH), 38 ha (2013) vs. 122 ha (2014) |
| ▲ 100%, Sassafras River Segment 2 (SASOH2), 0 ha (2013) vs. 14 ha (2014) |
| ▲ 26%, Gunpowder River Segment 2 (GUNOH2), 189 ha (2013) vs. 238 ha (2014) |
| ▲ 42%, Middle River (MIDOH), 148 ha (2013) vs. 210 ha (2014) |
| ▲ 100%, Middle Chester River (CHSOH), 0 ha (2013) vs. 8 ha (2014) |
| ▲ 117%, Middle Patuxent River (PAXOH), 7 ha (2013) vs. 15 ha (2014) |
| ▲ 22%, Middle Potomac River Segment 2 (POTOH2), 62 ha (2013) vs. 76 ha (2014) |
| ▲ 1124%, Middle Rappahannock River (RPPOH), 3 ha (2013) vs. 43 ha (2014) |
| ▲ 33%, Chickahominy River (CHKOH), 349 ha (2013) vs. 463 ha (2014) |
| ▲ 123%, Middle James River (JMSOH), 10 ha (2013) vs. 22 ha (2014) |
None of the 25 segments decreased by at least 20% and by at least 5 ha from 2013 totals.
Six of the 25 segments remained unvegetated in 2014.
Mesohaline Bay Salinity Zone
In the Mesohaline Bay Zone (41 CBP segments), SAV increased 46% from 10,283 hectares (25,410 ac) in 2013 to 14,992 hectares (37,048 ac) in 2014.
| Nineteen of the 41 segments increased by at least 20% and by at least 5 ha from 2013 totals: |
|---|
| ▲ 193%, Upper Central Chesapeake Bay (CB3MH), 50 ha (2013) vs. 147 ha (2014) |
| ▲ 100%, Patapsco River (PATMH), 0 ha (2013) vs. 7 ha (2014) |
| ▲ 100%, Magothy River (MAGMH), 0 ha (2013) vs. 8 ha (2014) |
| ▲ 291%, Lower Chester River (CHSMH), 15 ha (2013) vs. 58 ha (2014) |
| ▲ 346%, Eastern Bay (EASMH), 20 ha (2013) vs. 87 ha (2014) |
| ▲ 201%, Mouth of the Choptank River (CHOMH1), 511 ha (2013) vs. 1535 ha (2014) |
| ▲ 100%, Lower Choptank River (CHOMH2), 0 ha (2013) vs. 8 ha (2014) |
| ▲ 388%, Little Choptank River (LCHMH), 20 ha (2013) vs. 98 ha (2014) |
| ▲ 91%, Severn River (SEVMH), 30 ha (2013) vs. 58 ha (2014) |
| ▲ 194%, Lower Central Chesapeake Bay (CB5MH), 452 ha (2013) vs. 1328 ha (2014) |
| ▲ 77%, Honga River (HNGMH), 1195 ha (2013) vs. 2110 ha (2014) |
| ▲ 56%, Fishing Bay (FSBMH), 50 ha (2013) vs. 77 ha (2014) |
| ▲ 23%, Tangier Sound Segment 1 (TANMH1), 5562 ha (2013) vs. 6850 ha (2014) |
| ▲ 41%, Manokin River Segment 1 (MANMH1), 315 ha (2013) vs. 445 ha (2014) |
| ▲ 93%, Manokin River Segment 2 (MANMH2), 8 ha (2013) vs. 16 ha (2014) |
| One of the 41 segments decreased by at least 20% and by at least 5 ha from 2013 totals: |
|---|
| ▼ 63%, Lower Potomac River (POTMH), 450 ha (2013) vs. 165 ha (2014) |
Sixteen of the 41 segments remained unvegetated in 2014.
Polyhaline Bay Salinity Zone
In the Polyhaline Bay Zone (8 CBP segments), SAV increased 7% from 5,950 ha (14,703 ac) in 2013 to 6,352 ha (15,696 ac) in 2014.
| One of the 8 segments increased by at least 20% and by at least 5 ha from 2013 totals: |
|---|
| ▲ 21%, Lower York River (YRKPH), 150 ha (2013) vs. 182 ha (2014) |
None of the 8 segments decreased by at least 20% and by at least 5 ha from 2013 totals.
One of the 8 segments remained unvegetated in 2014.
Delmarva Peninsula Coastal Bays Zone
For 2014, 3,978 hectares (9,831 ac) were mapped in the Delmarva Peninsula Coastal Bays Zone (Assawoman, Isle of Wight, Sinepuxent, Chincoteague, and Southern Virginia coastal bays).
Turbid conditions in 2014 prevented us from mapping the Southern Virginia coastal bays. In addition, a small area of turbidity obscured a portion of Chincoteague Bay in 2013.
In order to ensure a valid analysis of change in SAV distribution and abundance given the reduced region mapped in 2013, all direct comparisons to 2013 in the report are restricted to only those regions that were mapped in both years. For comparison purposes, partial totals for 2014 have been computed for the Coastal Bays Zone and the CHNPH segment using only those regions mapped for both years.
| One of the 10 segments increased by at least 20% and by at least 5 ha from 2013 totals: |
|---|
| ▲ 39%, Chincoteague Bay (CHNPH), 2436 ha (2013) vs. 3390 ha (2014)* |
| Two of the 10 segments decreased by at least 20% and by at least 5 ha from 2013 totals: |
|---|
| ▼ 100%, Assawoman Bay (AAWPH), 31 ha (2013) vs. 0 ha (2014) |
| ▼ 86%, Isle of Wight Bay (IOWPH), 48 ha (2013) vs. 7 ha (2014) |
* Segment comparison restricted to areas mapped in both 2013 and 2014