2013 SAV Executive Summary
The 2013 distribution of submerged aquatic vegetation (SAV) in Chesapeake Bay and its tributaries was mapped from black and white aerial photographs. These were taken between May and November 2013, at a scale of 1:24,000, encompassing 168 flight lines.
Chesapeake Bay
For 2013, 24,164 hectares (59,711 acres) of SAV were mapped in Chesapeake Bay and its tributaries.
Notable changes in SAV distribution were measured between 2013 and 2012. SAV increased 24% from 19,503 ha (48,195 ac) to 24,164 ha (59,711 ac).
Until this year, grasses were mapped by geographic zone. This year the geographic zones have been replaced by four salinity zones to reflect the communities of SAV species found in the Chesapeake Bay: Tidal Fresh, Oligohaline, Mesohaline, and Polyhaline.
SAV increased in all four salinity zones in the Chesapeake Bay. In 2013, SAV increased in 34, decreased in 27, and remained unvegetated in 32 of the 93 CBP segments.
Segment Comparison Map
|
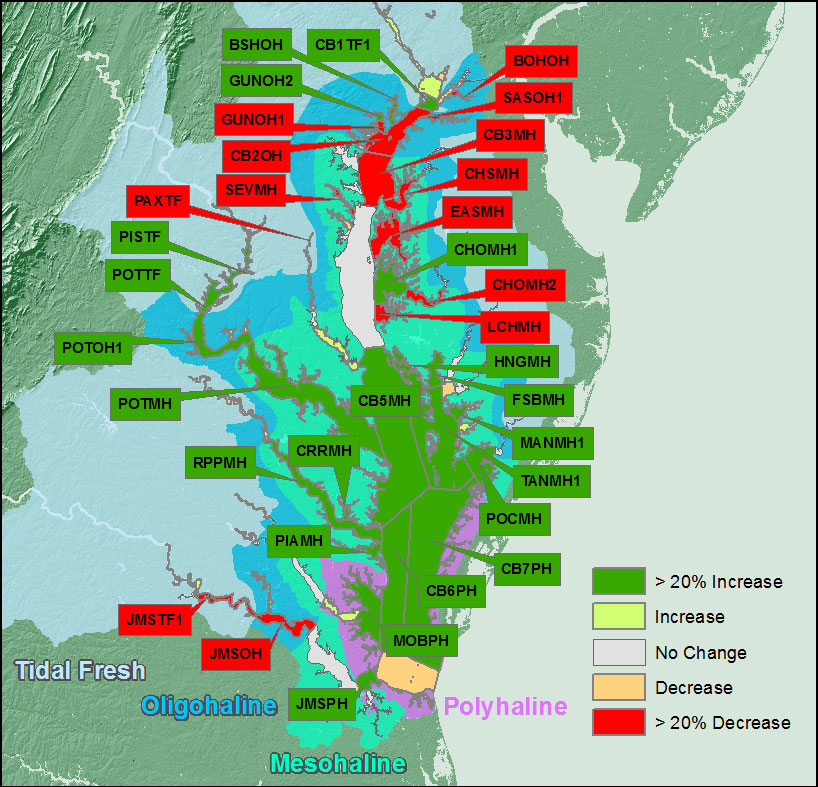
The 4,660 ha increase in baywide SAV coverage in 2013 represents a recovery from strong declines in 2011 and 2012 that reduced SAV abundance to a level last reported for the Bay in 1986. The 2013 increase was the result of a strong increase in the Tidal Fresh (743 ha), Mesohaline (2,344 ha), and Polyhaline (1,532 ha) salinity zones and almost no change in the Oligohaline salinity zone (41 ha increase). In 2013, the increases in the Mesohaline and Polyhaline salinity zones are due primarily to a rapid expansion of widgeongrass, including areas where SAV had not been mapped by previous surveys. However this species has had boom and bust cycles throughout the history of this survey. In addition, we are noting a modest recovery of eelgrass in the polyhaline areas where the hot summers of 2005 and 2010 resulted in dramatic diebacks. The largest SAV bed in the bay, on the Susquehanna Flats in segment CB1TF1, persisted through 2012 and shows an increase in coverage in 2013 despite the impacts from Hurricane Irene and Tropical Storm Lee in 2011.
Tidal Fresh Bay Salinity Zone
In the Tidal Fresh Bay Zone (19 CBP segments), SAV increased 15% from 4,916 ha (12,148 ac) in 2012 to 5,659 ha (13,985 ac) in 2013.
| Three of the 19 segments increased by at least 20% and by at least 5 ha from 2012 totals: |
|---|
| ▲ 23%, Northern Chesapeake Bay Segment 1 (CB1TF1), 187 ha (2012) vs. 229 ha (2013) |
| ▲ 50%, Upper Potomac River (POTTF), 1092 ha (2012) vs. 1641 ha (2013) |
| ▲ 71%, Piscataway Creek (PISTF), 102 ha (2012) vs. 175 ha (2013) |
| Two of the 19 segments decreased by at least 20% and by at least 5 ha from 2012 totals: |
|---|
| ▲ 51%, Upper Patuxent River (PAXTF), 12 ha (2012) vs. 6 ha (2013) |
| ▲ 23%, Upper James River Segment 1 (JMSTF1), 254 ha (2012) vs. 196 ha (2013) |
Oligohaline Bay Salinity Zone
In the Oligohaline Bay Zone (25 CBP segments), SAV increased 2% from 2,230 hectares (5,511 ac) in 2012 to 2,272 hectares (5,613 ac) in 2013.
| Three of the 25 segments increased by at least 20% and by at least 5 ha from 2012 totals: |
|---|
| ▲ 107%, Bush River (BSHOH), 48 ha (2012) vs. 100 ha (2013) |
| ▲ 35%, Gunpowder River Segment 2 (GUNOH2), 140 ha (2012) vs. 189 ha (2013) |
| ▲ 21%, Middle Potomac River Segment 1 (POTOH1), 819 ha (2012) vs. 992 ha (2013) |
| Five of the 25 segments (decreased by at least 20% and by at least 5 ha from 2012 totals: |
|---|
| ▼ 41%, Bohemia River (BOHOH), 25 ha (2012) vs. 14 ha (2013) |
| ▼ 68%, Upper Chesapeake Bay (CB2OH), 119 ha (2012) vs. 38 ha (2013) |
| ▼ 59%, Sassafras River Segment 1 (SASOH1), 107 ha (2012) vs. 44 ha (2013) |
| ▼ 22%, Gunpowder River Segment 1 (GUNOH1), 172 ha (2012) vs. 134 ha (2013) |
| ▼ 64%, Middle James River (JMSOH), 27 ha (2012) vs. 10 ha (2013) |
Ten of the 25 segments remained unvegetated in 2013.
Mesohaline Bay Salinity Zone
In the Mesohaline Bay Zone (41 CBP segments), SAV increased 30% from 7,939 hectares (19,619 ac) in 2012 to 10,283 hectares (25,410 ac) in 2013.
| Eleven of the 41 segments increased by at least 20% and by at least 5 ha from 2012 totals: |
|---|
| ▲ 67%, Mouth of the Choptank River (CHOMH1), 306 ha (2012) vs. 511 ha (2013) |
| ▲ 47%, Lower Central Chesapeake Bay (CB5MH), 307 ha (2012) vs. 452 ha (2013) |
| ▲ 23%, Honga River (HNGMH), 973 ha (2012) vs. 1195 ha (2013) |
| ▲ 90%, Fishing Bay (FSBMH), 26 ha (2012) vs. 50 ha (2013) |
| ▲ 32%, Tangier Sound Segment 1 (TANMH1), 4214 ha (2012) vs. 5562 ha (2013) |
| ▲ 33%, Manokin River Segment 1 (MANMH1), 236 ha (2012) vs. 315 ha (2013) |
| ▲ 65%, Lower Pocomoke River (POCMH), 559 ha (2012) vs. 921 ha (2013) |
| ▲ 57%, Lower Potomac River (POTMH), 287 ha (2012) vs. 450 ha (2013) |
| ▲ 39%, Lower Rappahannock River (RPPMH), 165 ha (2012) vs. 229 ha (2013) |
| ▲ 30%, Corrotoman River (CRRMH), 41 ha (2012) vs. 53 ha (2013) |
| ▲75%, Piankatank River (PIAMH), 41 ha (2012) vs. 72 ha (2013) |
| Six of the 41 segments (decreased by at least 20% and by at least 5 ha from 2012 totals: |
|---|
| ▼ 71%, Upper Central Chesapeake Bay (CB3MH), 176 ha (2012) vs. 50 ha (2013) |
| ▼ 79%, Lower Chester River (CHSMH), 70 ha (2012) vs. 15 ha (2013) |
| ▼ 79%, Eastern Bay (EASMH), 92 ha (2012) vs. 20 ha (2013) |
| ▼ 100%, Lower Choptank River (CHOMH2), 7 ha (2012) vs. 0 ha (2013) |
| ▼ 57%, Little Choptank River (LCHMH), 46 ha (2012) vs. 20 ha (2013) |
| ▼ 59%, Severn River (SEVMH), 73 ha (2012) vs. 30 ha (2013) |
Eighteen of the 41 segments remained unvegetated in 2013.
Polyhaline Bay Salinity Zone
In the Polyhaline Bay Zone (8 CBP segments), SAV increased 35% from 4,418 ha (10,917 ac) in 2012 to 5,950 ha (14,703 ac) in 2013.
| Four of the 8 segments increased by at least 20% and by at least 5 ha from 2012 totals: |
|---|
| ▲ 69%, Western Lower Chesapeake Bay (CB6PH), 81 ha (2012) vs. 136 ha (2013) |
| ▲ 65%, Lower Pocomoke River (POCMH), 559 ha (2012) vs. 921 ha (2013) |
| ▲ 34%, Mobjack Bay (MOBPH), 2133 ha (2012) vs. 2857 ha (2013) |
| ▲ 27%, Mouth of the James River (JMSPH), 105 ha (2012) vs. 134 ha (2013) |
None of the 8 segments decreased by at least 20% and by at least 5 ha from 2012 totals:
One of the 8 segments remained unvegetated in 2013.
Delmarva Peninsula Coastal Bays Zone
For 2014, 3,978 hectares (9,831 ac) were mapped in the Delmarva Peninsula Coastal Bays Zone (Assawoman, Isle of Wight, Sinepuxent, Chincoteague, and Southern Virginia coastal bays).
Turbid conditions in 2014 prevented us from mapping the Southern Virginia coastal bays. In addition, a small area of turbidity obscured a portion of Chincoteague Bay in 2013.
In order to ensure a valid analysis of change in SAV distribution and abundance given the reduced region mapped in 2013, all direct comparisons to 2013 in the report are restricted to only those regions that were mapped in both years. For comparison purposes, partial totals for 2014 have been computed for the Coastal Bays Zone and the CHNPH segment using only those regions mapped for both years.
| One of the 10 segments increased by at least 20% and by at least 5 ha from 2012 totals: |
|---|
| ▲ 34%, South Bay (SVCPH5), 1067 ha (2012) vs. 1428 ha (2013) |
None of the 10 segments decreased by at least 20% and by at least 5 ha from 2012 totals:
Two of the 10 segments remained unvegetated in 2013.