2010 SAV Executive Summary
The 2010 distribution of submerged aquatic vegetation (SAV) in Chesapeake Bay and its tributaries was mapped from black and white aerial photographs. These were taken between May and October 2010, at a scale of 1:24,000, encompassing 173 flight lines.
Chesapeake Bay
For 2010, 32,243 hectares (79,675 acres) of SAV were mapped in Chesapeake Bay and its tributaries.
Notable changes in SAV distribution were measured between 2009 and 2010. SAV decreased 7% from 34,768 ha (85,914 ac) to 32,243 ha (79,675 ac).
SAV decreased in two (Upper and Middle) and increased in one (Lower) geographic zones delineated for Chesapeake Bay. In 2010, SAV increased in 23, decreased in 38, and remained unvegetated in 32 of the 93 CBP segments.
Segment Comparison Map
|
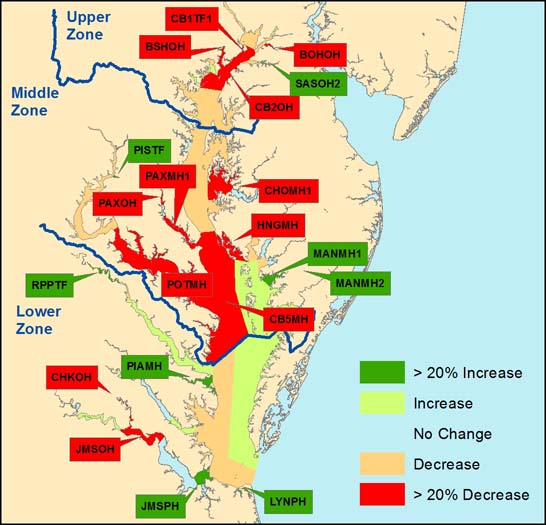
The 2,525 ha decrease in baywide SAV coverage in 2010 follows three successive years of increase (2007-2009). This decline occurred primarily in the Middle (1,686 ha) and Upper (908 ha) Bay zones, with the largest losses in two segments in the Middle Bay Zone (Lower Central Chesapeake Bay and Honga River). Widgeongrass, noted for its interannual variability, dominates these segments and much of the Middle Bay Zone. The extremely high summertime temperatures in 2010, one of the warmest years on record, likely killed widgeongrass early in the growing season prior to monitoring. In the Upper Bay Zone, the SAV bed in the Susquehanna Flats, one of the largest SAV beds in the Bay, supports a diverse community of freshwater SAV species and continues to be a major success story for SAV recovery. Surprisingly, despite the very hot temperatures, this bed declined only slightly in 2010. Total SAV coverage in the Lower Bay Zone remained essentially the same following the 2007-2009 increases that were attributed to the recovery of eelgrass after the 2005 dieback.
Upper Bay Zone
In the Upper Bay Zone (21 CBP segments extending south from the Susquehanna River to the Chester and Magothy rivers), SAV decreased 10% from 9,549 ha (23,597 ac) in 2009 to 8,641 ha (21,353 ac) in 2010.
| One of the 21 segments increased by at least 20% and by at least 5 ha from 2009 totals: |
|---|
| ▲ 139%, Sassafras River Segment 2 (SASOH2), 22 ha (2009) vs. 51 ha (2010) |
| Four of the 21 segments decreased by at least 20% and by at least 5 ha from 2009 totals: |
|---|
| ▼ 22%, Northern Chesapeake Bay Segment 1 (CB1TF1), 437 ha (2009) vs. 342 ha (2010) |
| ▼ 62%, Bohemia River (BOHOH), 221 ha (2009) vs. 85 ha (2010) |
| ▼ 22%, Upper Chesapeake Bay (CB2OH), 302 ha (2009) vs. 235 ha (2010) |
| ▼ 38%, Bush River (BSHOH), 154 ha (2009) vs. 96 ha (2010) |
Middle Bay Zone
In the Middle Bay Zone (44 CBP segments extending south from the Bay Bridge to the Rappahannock River and Pocomoke Sound, and including the Potomac River), SAV decreased 11% from 16,030 ha (39,612 ac) in 2009 to 14,344 ha (35,446 ac) in 2010.
| Three of the 44 segments increased by at least 20% and by at least 5 ha from 2009 totals: |
|---|
| ▲ 49%, Manokin River Segment 1 (MANMH1), 237 ha (2009) vs. 353 ha (2010) |
| ▲ 100%, Manokin River Segment 2 (MANMH2), 0 ha (2009) vs. 5 ha (2010) |
| ▲ 91%, Piscataway Creek (PISTF), 111 ha (2009) vs. 212 ha (2010) |
| Six of the 44 segments decreased by at least 20% and by at least 5 ha from 2009 totals: |
|---|
| ▼ 38%, Mouth of the Choptank River (CHOMH1), 263 ha (2009) vs. 164 ha (2010) |
| ▼ 38%, Lower Central Chesapeake Bay (CB5MH), 1,853 ha (2009) vs. 1,145 ha (2010) |
| ▼ 56%, Honga River (HNGMH), 1,992 ha (2009) vs. 880 ha (2010) |
| ▼ 55%, Lower Patuxent River Segment 1 (PAXMH1), 16 ha (2009) vs. 7 ha (2010) |
| ▼ 28%, Middle Patuxent River (PAXOH), 37 ha (2009) vs. 27 ha (2010) |
| ▼ 38%, Lower Potomac River (POTMH), 136 ha (2009) vs. 84 ha (2010) |
Nineteen of the 44 segments remained unvegetated in 2010.
Lower Bay Zone
In the Lower Bay Zone (28 CBP segments covering the region south from the Rappahannock River and Pocomoke Sound regions to the mouth of the Bay), SAV increased 1% from 9,189 ha (22,706 ac) in 2009 to 9,257 ha (22,876 ac) in 2010.
| Four of the 28 segments increased by at least 20% and by at least 5 ha from 2009 totals: |
|---|
|
▲ 158%, Upper Rappahannock River (RPPTF), 71 ha (2009) vs. 184 ha (2010) |
|
▲ 42%, Piankatank River (PIAMH), 139 ha (2009) vs. 198 ha (2010) |
|
▲ 42%, Mouth of the James River (JMSPH), 136 ha (2009) vs. 193 ha (2010) |
|
▲ 100%,Lynnhaven & Broad Bays (LYNPH), 0 ha (2009) vs. 6 ha (2010) |
| Two of the 28 segments decreased by at least 20% and by at least 5 ha from 2009 totals: |
|---|
| ▼ 20%, Chickahominy River (CHKOH), 389 ha (2009) vs. 309 ha (2010) |
| ▼ 56%, Middle James River (JMSOH), 17 ha (2009) vs. 8 ha (2010) |
Eleven of the 28 segments remained unvegetated in 2010.
Delmarva Peninsula Coastal Bays Zone
In the Delmarva Peninsula Coastal Bays Zone (Assawoman, Isle of Wight, Sinepuxent, Chincoteague, and Southern Virginia coastal bays), SAV increased 7% from 6,862 ha in 2009 to 7,326 ha in 2010.
| All of the five segments increased since 2009: |
|---|
| ▲ 7%, Assawoman Bay (AAWPH), 354 ha (2009) vs. 379 ha (2010) |
| ▲ 16%, Isle of Wight bay (IOWPH), 180 ha (2009) vs. 210 ha (2010) |
| ▲ 1%, Sinepuxent Bay (SPXPH), 745 ha (2009) vs. 754 ha (2010) |
| ▲ 1%, Chincoteague Bay (CHNPH), 4,232 ha (2009) vs.4,269 ha (2010) |
| ▲ 27%, Southern Virginia Coastal Bays (SVCPH) 1,352 ha (2009), vs. 1,715 ha (2010) |
None of the five segments decreased since 2009.