Survey Methods
Area Sampled
Starting in the spring of 1955, the survey sampled a series of stations in the mid-river channel at approximately 5-mile intervals from the mouth of the York River to West Point, Virginia. These stations were sampled irregularly for the rest of that year. Since April 1956, these now called historical stations were sampled almost continuously (April through November). A few stations in lower Chesapeake Bay and in the Pamunkey River were also regularly sampled for several years.
Link to historical photos of VIMS trawling.
In 1962, sampling on the Rappahannock River commenced; stations on the James River were added in 1964. Occasional samples were taken from the Potomac River, Mobjack Bay, and several smaller tributaries. Semi-annual sampling of Chesapeake Bay occurred sporadically until 1988 when regular sampling of the entire Virginia portion of the Chesapeake Bay began. Mobjack Bay was sampled again from March 2010-March 2012.
As the survey currently operates, 22 stations in the James, York, and Rappahannock River are sampled each month, year-round. Sampling in the Bay varies between 39 and 45 stations per month (depending on season) and does not occur in January or March. This current iteration of the survey has been underway for over 30 years.
Gear
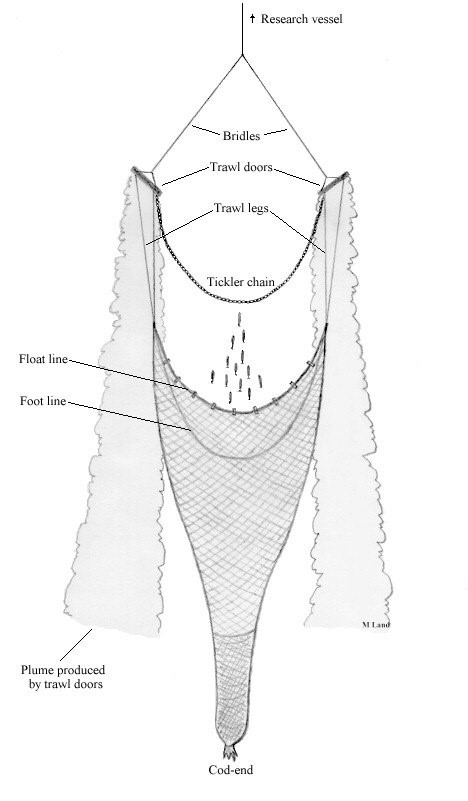
The survey uses a 5.8-meter head line, 4-seam, semi-balloon otter trawl with a 40-millimeter stretch-mesh body and a 6.4-millimeter mesh cod liner. Each side of the net is attached to a heavy steel door via two rope "legs". The doors provide horizontal spread of the net. Bridles made of steel aircraft cable connect the doors and net to the research vessel. A tickler chain, which stirs up the seafloor and increases the catch of bottom-dwelling species such as Blue Crabs and flatfish, was added in 1973.
Vessel
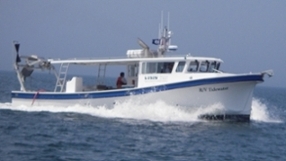
There have been a number of vessel changes throughout the history of the survey. Recently, the R/V Fish Hawk (top) was retired. The R/V Fish Hawk was used from 1990-2015 and sampled 28,569 stations during that time. The R/V Tidewater (bottom) is now being used. 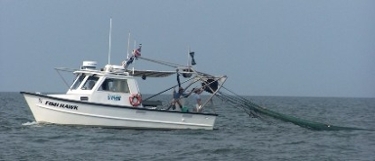
Catch
After each 5-minute tow, the catch is sorted and fishes are identified and measured, then quickly returned to the water. (Subsets of large catches are measured and the rest are counted.) Invertebrates are identified and some are measured*. Approximately 70 species are commonly caught, although more than 200 species have been identified during the last 50 years.
*As of March 2012, Horseshoe Crabs, Blue Crabs, and penaeid shrimp are the only invertebrates identified and measured by the VIMS Juvenile Finfish Trawl Survey.
From Field to Database
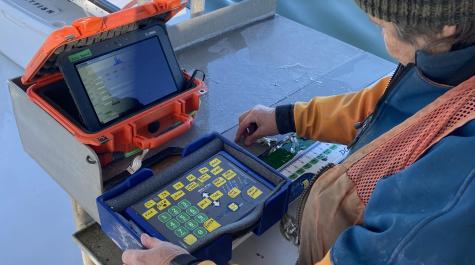
Until 1987, most fish were preserved in the field and brought back to the lab to be measured and recorded. In 1988, the survey began using electronic measuring boards connected to a computer running a database program; this allowed the survey to work more efficiently. The operator places a fish or crab on the board and touches a magnetic wand to the board at the end of the fish's tail/edge of shell; the length is electronically recorded. This process speeds measuring and eliminates the need for manual recording and entry of fish/crab lengths. Animals are returned to the water quickly and data are available for analysis within a couple of days of the field work.
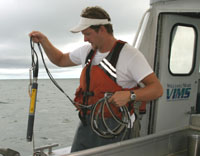
In addition to animal lengths, hydrographic and station data are also collected. These data include latitude and longitude, depth, tidal current stage, secchi depth, air temperature, weather conditions, sea state, water temperature, salinity and dissolved oxygen. Hydrographic data is collected using a YSI meter.