Charleston, SC Model
Interactive Map of Hydrodynamic Model Grid for Charleston, SC
 | View Map in New Window
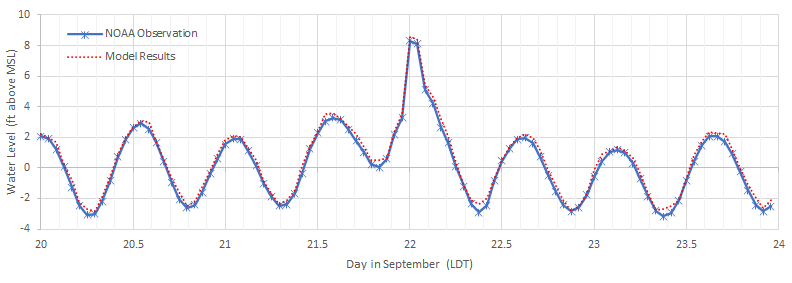
The street level hydrodynamic model grid above was utilized to create a historic reconstruction simulation of 1989 Hurricane Hugo. You can click on the red sensor icon in the map above to view a time series comparison with the NOAA Tide Gauge adjacent to the Port of Charleston.
The simulation leveraged sub-grid techniques to incorporate partially wetting and drying grid cells surrounding the Charleston peninsula at 1m resolution by embedding a lidar-derived digital elevation model (depicted with varying colors shown above) into the hydrodynamic model. The model's base grid (featured in the interactive map above), is aligned with a proposed 12 ft sea wall currently under consideration for construction by the City of Charleston, SC, in collaboration with the US Army Corps of Engineers.
Animation of Historic Reconstruction of Hurricane Hugo in Charleston, SC
You can view video animations of the hourly street-level model simulation results on September 21-22 from 7:00 pm to 7:00 am LDT (23:00 to 11:00 UTC) surrounding the peak of 8.52 ft above MSL92 (11.45 ft above MLLW92; 8.31 ft above NAVD88) observed at 12:00 am LDT (04:00 UTC). The simulation animation below represents a base case for Hurricane Hugo in 1989 without the mitigating presence of the proposed storm surge barrier depicted in red (for reference). Results are geospatially represented corresponding to the noted time indices highlighted in the time series comparison shown in the bottom right inset on the video.
Animation of Sea Wall Mitigation of Hurricane Hugo in Charleston, SC
This simulation includes a 12 ft tall sea wall and 4 wave breaking structures to the south end of the peninsula, which were included in this simulation to determine if the planned storm surge barrier would effectively mitigate the disastrous flood impacts of this historic storm of note in the Charleston peninsula during the original storm (which it does). The surge impacts of 1989 Hurricane Hugo outside the walled-in region are virtually the same for areas more than 300 ft from the barrier. However, water levels were noted to increase by as much as 1.5 feet in areas directly adjacent to the wall (relative to the historic reconstruction scenario without the wall). This was noted in the time series plot of the present location of the NOAA Tide Gauge near the Port of Charleston) due to the local volume displacement imposed by the proposed wall included in this simulation.