VIMS research helps improve estimates of “dead zone” size
New methodology has important implications for Bay management
Gauging the size of the low-oxygen “dead zone” that afflicts Chesapeake Bay each summer is both difficult and important—difficult due to the extent and variability of the problem, and important as a bellwether of Bay health.
Now, a study led by researchers at the Virginia Institute of Marine Science offers an improved method for estimating the dead zone’s magnitude and duration, one in which fewer field observations could provide a more accurate and efficient means to measure the long-term progress of Bay restoration efforts.
The study is authored by VIMS post-doctoral research associate Aaron Bever, VIMS professors Marjy Friedrichs and Carl Friedrichs, Malcolm Scully of the Woods Hole Oceanographic Institution, and Lyon Lanerolle of NOAA. It appeared online on October 3 in the Journal of Geophysical Research: Oceans.
Dead zones form when excess nutrients from human activities enter coastal waters and help fertilize blooms of algae. When these algae die and sink to the bottom, they provide a rich food source for bacteria, which in the act of decomposition consume dissolved oxygen from surrounding waters. Reducing nutrient inputs through improved farming practices, sewage upgrades, and other means is a main focus of Bay restoration efforts.
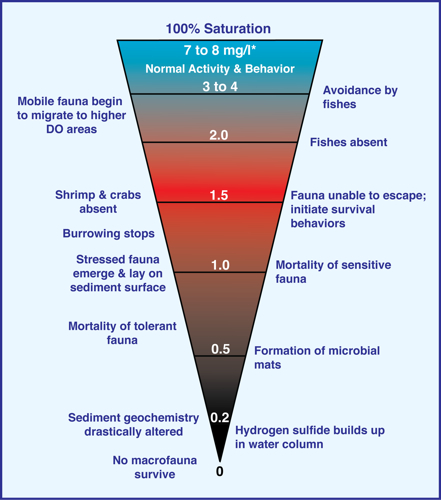 Scientists with the Chesapeake Bay Program currently determine the extent of the Bay’s dead zone by lowering oxygen sensors from two research vessels at 30 to 60 sampling stations that are distributed around the Bay. They do so every two weeks during the summer and on a monthly basis during the rest of the year. They then estimate Baywide oxygen levels by using a computer model to fill-in or “interpolate” values between sampling sites, and to “extrapolate” values into un-sampled areas. The scientists define the dead zone’s overall size as the volume of Bay water with levels of dissolved oxygen below two milligrams per liter. Fully oxygenated ocean water holds 7 to 8 mg/L, with concentrations below 4 mg/L considered unhealthy for fishes and other mobile marine life. Waters with dissolved oxygen levels below 2 mg/L are said to suffer from “hypoxia.”
Bever and his co-authors note that the Bay Program’s current sampling strategy provides good spatial coverage, and represents “an invaluable long-term dataset for characterizing dissolved oxygen and other water-quality parameters.” Their concern is the time the sampling requires, with oxygen levels in the Bay changing more rapidly than the 7 to 14 days needed to collect data from all the widely dispersed stations.
“The current observations aren’t a real-time representation of the system,” says Bever. “Our study shows that collecting data over a 2-week period could lead to a 25 to 50% uncertainty in estimating the instantaneous volume of summertime hypoxia. That could be larger than the uncertainty due to sampling at discrete stations and interpolating and extrapolating to the entire Bay.”
Less is more
To reduce the uncertainty generated by protracted sampling, Bever and his colleagues suggest that Bay scientists use a subset of only 13 stations during each research cruise to estimate hypoxic volume.
“We found that sampling fewer stations can actually provide a better estimate of the extent of hypoxia within the Bay,” says Marjy Friedrichs. “Fewer stations means quicker sampling, which is important because oxygen levels in the Bay vary markedly with time as influenced by tides, winds, and other factors.”
Fellow VIMS Professor Carl Friedrichs adds, “Sampling fewer stations more quickly is likely a more efficient strategy for capturing this temporal variability in hypoxic volume.“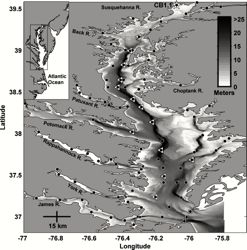
The researchers note that their suggested approach could also save funds, particularly important given recent cuts to the Chesapeake Bay Program’s monitoring efforts.
The team conducted their study by using several different 3-dimensional computer models to simulate the seasonal progression of low-oxygen conditions in the Bay, initiating the models with actual measurements of river runoff, nutrient inputs, wind speed and direction, tides, and other factors known to affect oxygen levels in coastal waters. They then sampled the models’ output virtually, noting oxygen levels within the model at the sites actually visited by field crews in Chesapeake Bay during 2004 and 2005.
“We used two different core hydrodynamic models and three different dissolved oxygen formulations, each sampled for hypoxic volume in 10 different ways,” says Marjy Friedrichs. “Determining the results that were consistent among all these models allowed us to better understand the uncertainty in the field data, and to develop methods for improving the interpolated observations.”
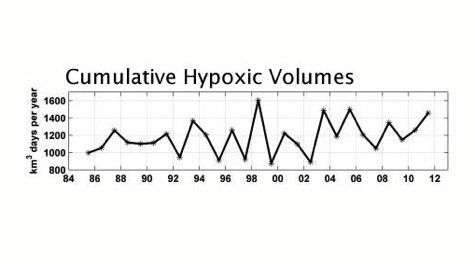
The team’s research also leads them to suggest a different reporting metric for low-oxygen conditions. Says Friedrichs, “There are lots of different ways to measure the extent of Bay hypoxia—its area, thickness, duration, peak volume, and cumulative hypoxic volume. Our study shows that cumulative hypoxic volume is a particularly useful metric for the Bay, as it’s less sensitive to rapid changes in oxygen levels, and takes into account seasonal changes in the onset and persistence of hypoxia due to climate change.”
A final product of the team’s analysis is a nearly three-decade record of improved estimates of hypoxic volume for Chesapeake Bay. This provides a useful baseline for measuring restoration progress and climate-change impacts.
Major funding for this study was provided by the IOOS COMT Program through NOAA with additional funding through NSF Grant OCE-1061564.