VIMS modeler joins in ensemble forecast of 2019 Gulf dead zone
High spring rainfall and river discharge major contributors to sizable prediction
Dr. David Forrest of William & Mary’s Virginia Institute of Marine Science has again added his contribution to the multi-model “ensemble forecast” that the National Oceanic and Atmospheric Administration uses to predict the size of the low-oxygen “dead zone” that forms off the Mississippi Delta each summer.
NOAA’s ensemble forecast for the 2019 Gulf of Mexico ‘dead zone’ is 7,829 square miles, 1.7 times the size of the Chesapeake Bay. The annual prediction is based on river flow and nutrient data from the U.S. Geological Survey. The 2019 forecast is close to the record size of 8,776 square miles set in 2017 and larger than the 5-year average measured size of 5,770 square miles.
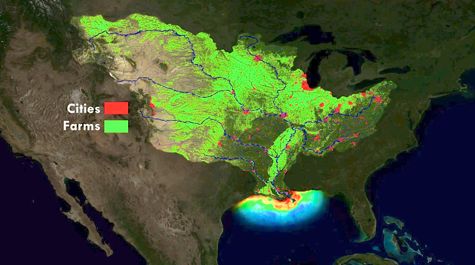
Fueled by human activities that release excess nutrients into rivers, streams, and groundwater, dead zones are a growing threat to marine life in coastal areas worldwide, including the Chesapeake Bay. The dead zone in the Gulf of Mexico affects nationally important commercial and recreational fisheries.
A major contributor to the large dead zone this year is the abnormally high amount of spring rainfall in many parts of the Mississippi River watershed, which led to record high river flows and much larger nutrient loading to the Gulf of Mexico. This past May, discharge in the Mississippi and Atchafalaya rivers was about 67% above the long-term average between 1980 and 2018. USGS estimates that this larger-than-average river discharge carried 156,000 metric tons of nitrate and 25,300 metric tons of phosphorus into the Gulf of Mexico in May alone. These nitrate loads were about 18% above the long-term average, and phosphorus loads were about 49% above the long-term average.
VIMS prediction
Forrest's prediction—based on a statistical correlation between the area of the Gulf dead zone and the average measured discharge and nitrogen concentration in the Mississippi River during May—provides the low end of the forecast range at 6,714 square miles (17,389 km2). His forecast itself incorporates a range of between 4,207 and 9,221 square miles, with 90% confidence that actual values will fall within those bounds.
Forrest says his prediction is “again the lowest of the partner's predictions, due to my inclusion of some years with tropical storms that some of the other modelers exclude.” High waves from these storms can reduce dead-zone conditions by mixing surface oxygen into deeper waters.
Forrest's 2018 prediction—a dead zone of 5,076 square miles with a range of between 2,694 and 7,457 square miles—was the most accurate of the NOAA ensemble.
“Last year, my estimate was the low end of the partner's predictions,” says Forrest, “but since the observation was lower than all the predictions due to winds and weather, mine was the closest.”
Ensemble forecast
NOAA issues a dead zone forecast each year, and refines the models used by the Hypoxia Task Force to set nutrient-reduction targets and better understand the link between hypoxia and nutrients. The forecast assumes typical coastal weather conditions, but the measured dead zone size could be disrupted and its size changed by major wind events, hurricanes, and tropical storms, which mix ocean waters, as occurred in 2018. A NOAA-supported monitoring survey will confirm the size of the 2019 Gulf dead zone in early August, a key test of the accuracy of the models.
This is the second year NOAA is producing its own independent forecast product, the culmination of a multi-year academic-federal partnership to develop a suite of NOAA-supported hypoxia forecast models. In addition to VIMS, the partnership includes teams of researchers at the University of Michigan, Louisiana State University, North Carolina State University, Dalhousie University, and the United States Geological Survey.
The NOAA forecast integrates the results of these multiple independent models into a separate average forecast and is released in coordination with these external groups, some of which are also developing independent forecasts.
“The models help predict how hypoxia in the Gulf of Mexico is linked to nutrient inputs coming from throughout the Mississippi River Basin,” said Dr. Steve Thur, director of NOAA’s National Centers for Coastal Ocean Science. “This year's historic and sustained river flows will test the accuracy of these models in extreme conditions, which are likely to occur more frequently in the future according to the latest National Climate Assessment. The assessment predicts an increase in the frequency of very heavy precipitation events in the Midwest, Great Plains, and Southeast regions, which would impact nutrient input to the northern Gulf of Mexico and the size of the hypoxic zone.”
Long-term target
The Mississippi River/Gulf of Mexico Watershed Nutrient Task Force, a group working to reduce the Gulf dead zone through nutrient reductions within the Mississippi River watershed, has set a 5-year average measured size target of 1,900 square miles.
While nutrient inputs to the Gulf of Mexico vary from year to year because of natural swings in precipitation and discharge, USGS also tracks longer-term gradual changes in nitrate and phosphorus loading into the Gulf of Mexico from the Mississippi River.
“Long-term monitoring of the country's streams and rivers by the USGS has shown that while nitrogen loading into some other coastal estuaries has been decreasing, nitrogen loading into the Gulf of Mexico from the Mississippi River Basin has been relatively stable in recent years," said Don Cline, associate director for the USGS Water Resources Mission Area. "USGS monitoring and real-time sensors, coupled with watershed modeling, will continue to improve our understanding of the causes of these changes and the role they play in the Gulf and other coastal areas.”
NOAA and its partners continue to develop additional hypoxia forecast capabilities to understand impacts on living marine resources, better evaluate the role of phosphorus on the dead zone size, and understand the relationship between hypoxia volume and area.