Climate Change Impacts in Virginia: Climate Cascades
Climate change cascades occur when a species or process not directly affected by changes in temperature or precipitation responds to climate change due to a change in a related species or process that is strongly affected by changes in temperature or precipitation. An example would be a change in the mouse population size, which is indirectly related to changes in precipitation. Although precipitation does not appear to directly affect the mouse population size, it does affect mast production by a number of tree species. The mast is a source of food for the mouse population and when more food is available, a larger population can be sustained.
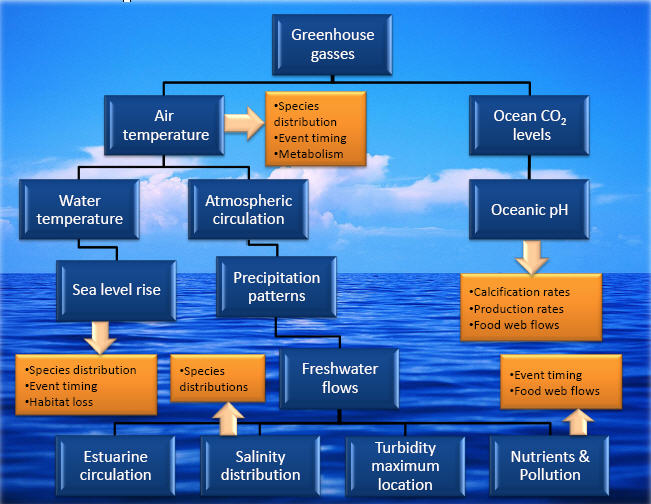
This diagram shows links in abiotic factors that can propagate climate changes. The orange boxes are examples of the types of metabolic and temporal changes that can result from shifts in the abiotic factors. These shifts affect both individual species population dynamics and ecological community make-up and function.
This diagram illustrates ecological connections and how climate changes can resonate through an ecological web.
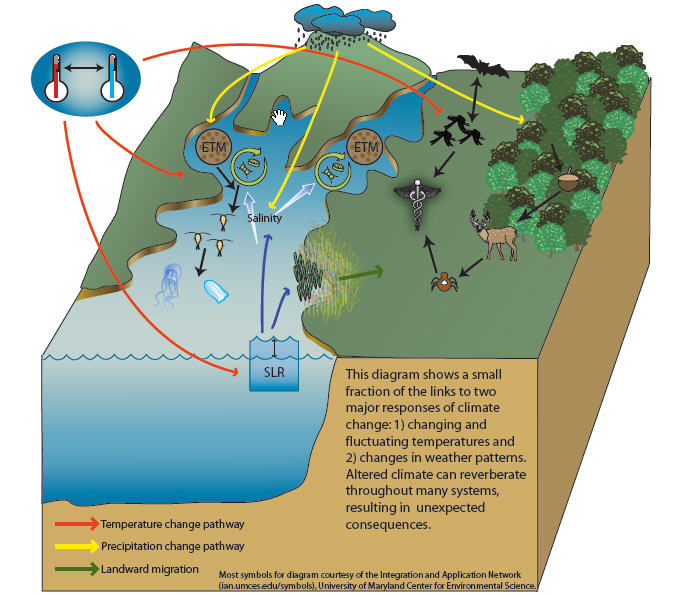
The pathways for the ecological connections include temperature and precipitation changes. The ![]() means 'affects' or 'leads to'.
means 'affects' or 'leads to'.
Temperature Changes Affect:
-
Sea level rise (SLR)
 change salinity distribution Estuarine turbidity maximum (ETM) location location of phytoplankton bloom availability of food for zooplankton population availability of food for jellyfish and ctenophore populations
 -
Phytoplankton bloom timing
availability of food for zooplankton population availability of food for jellyfish and ctenophore populations -
SLR
marsh location and composition and other landscape features -
Mosquito populations
human health and safety through disease transmission
Precipitation Changes Affect:
-
Salinity and freshwater flows
ETM location location of phytoplankton bloom availability of food for zooplankton population availability of food for jellyfish and ctenophore populations -
Tree growth and production
Mast (e.g., acorn) production food availability for deer population tick population size human health and safety through disease transmission -
Bat population
mosquito population size human health and safety through disease transmission