
Salinity
Forecasts for the Chesapeake Bay
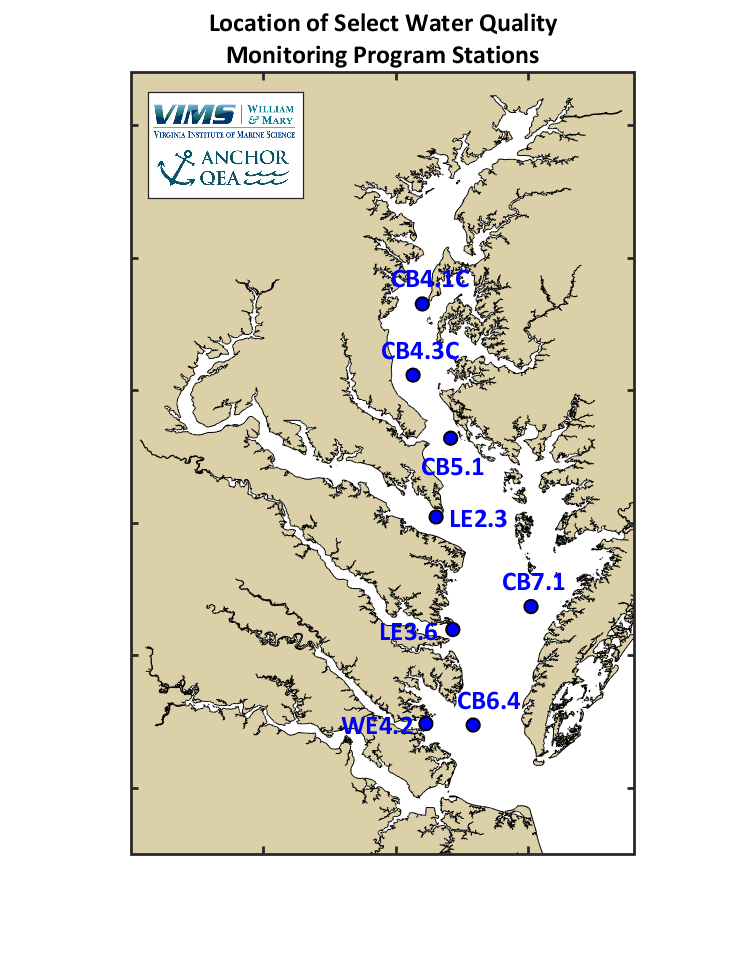
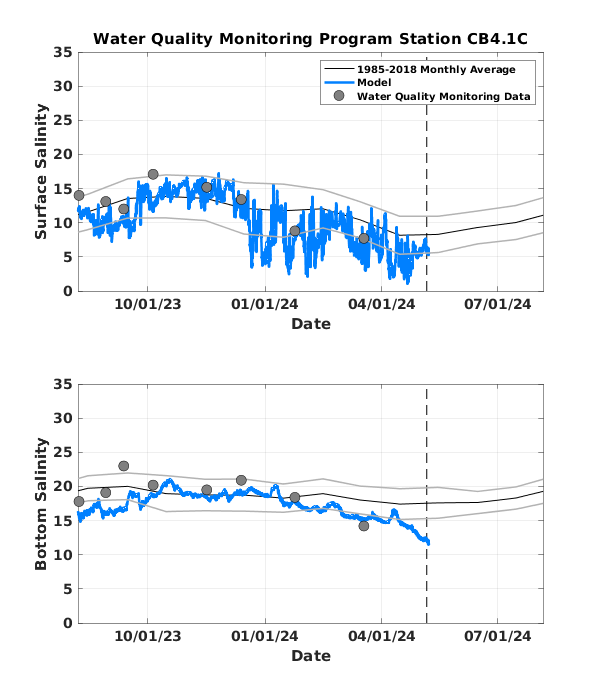
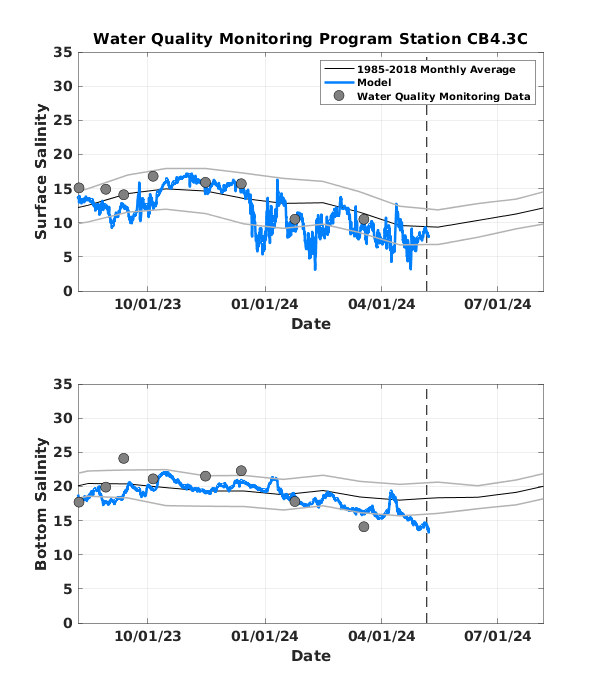
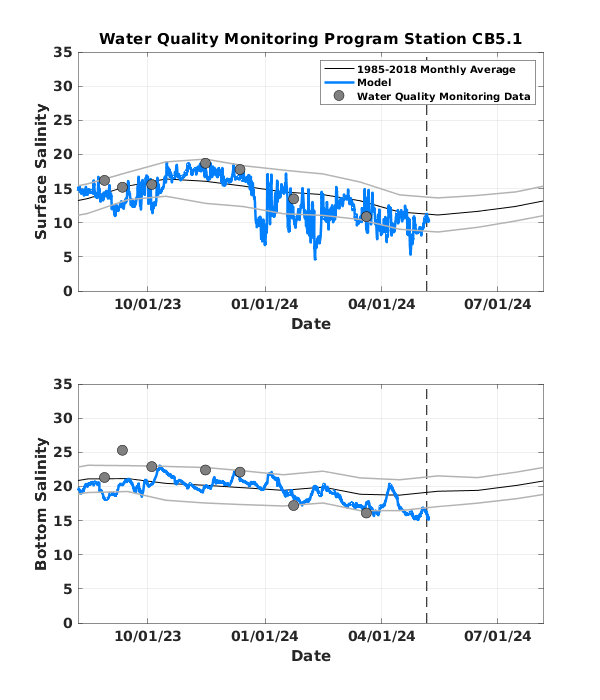
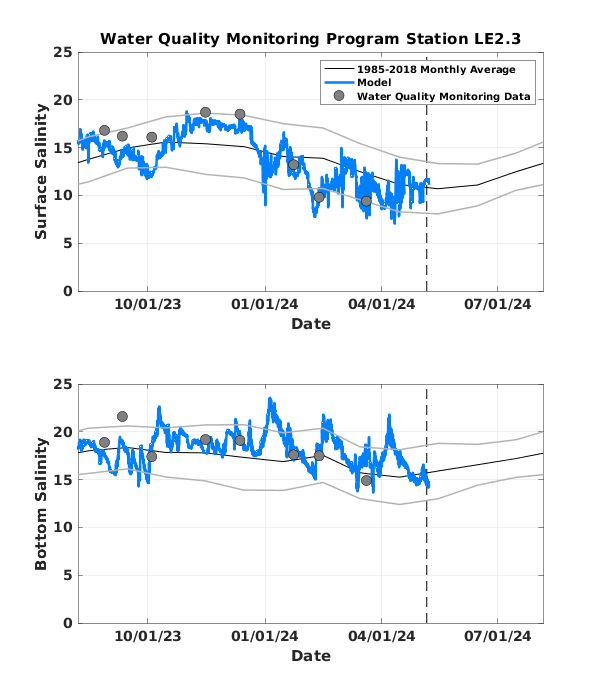
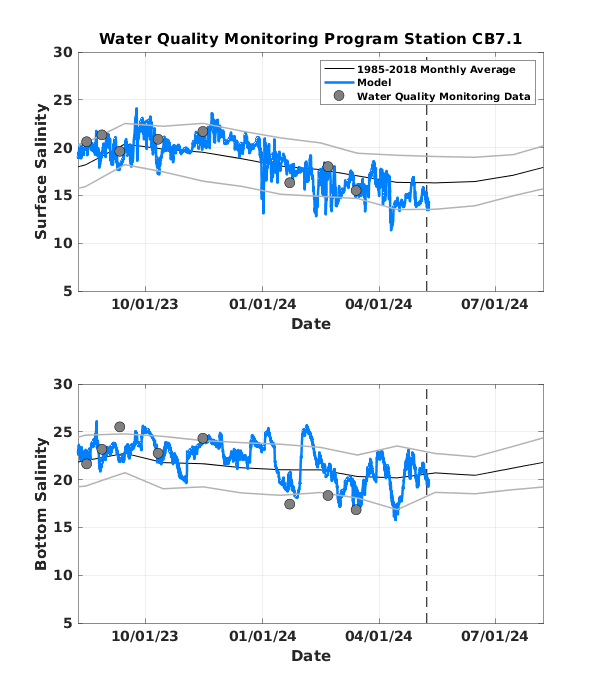
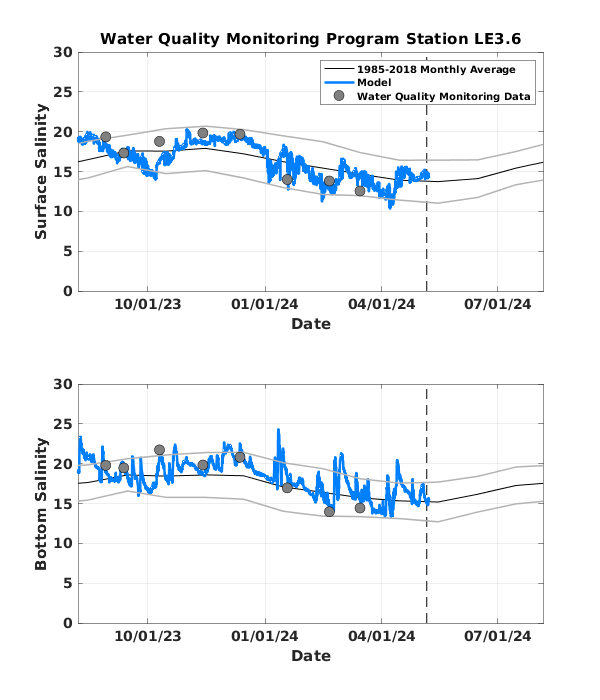
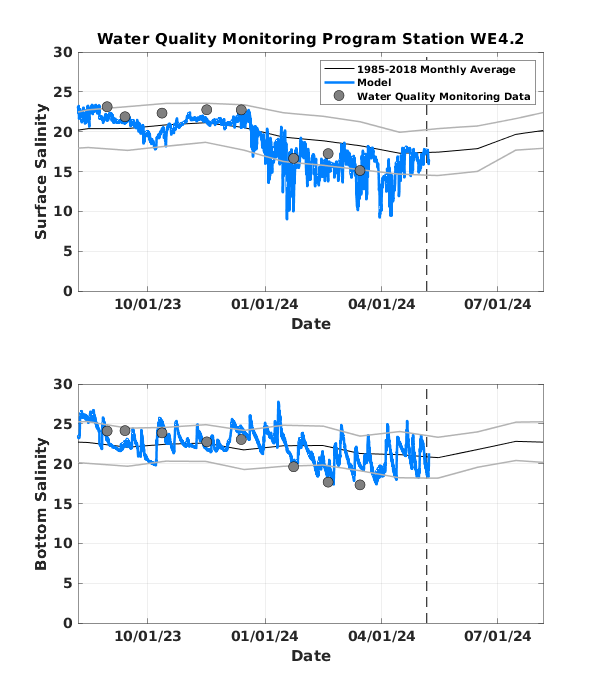
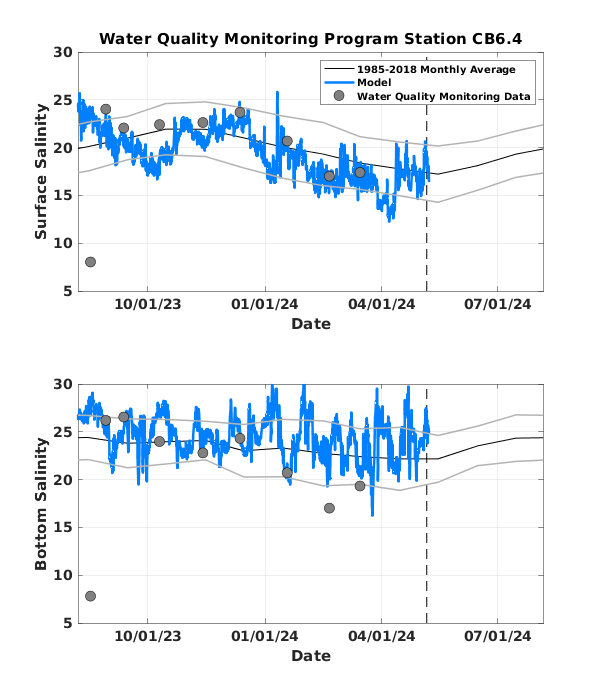
Salinity Line PlotsSalinity can be viewed through time at select locations to understand the seasonal and weekly changes in salinity in the Chesapeake Bay. Overlaying the modeled salinity on top of long-term averages from observed data shows how the forecasted salinity compares to the historical average. Grey lines show one standard deviation above and below the average.
|
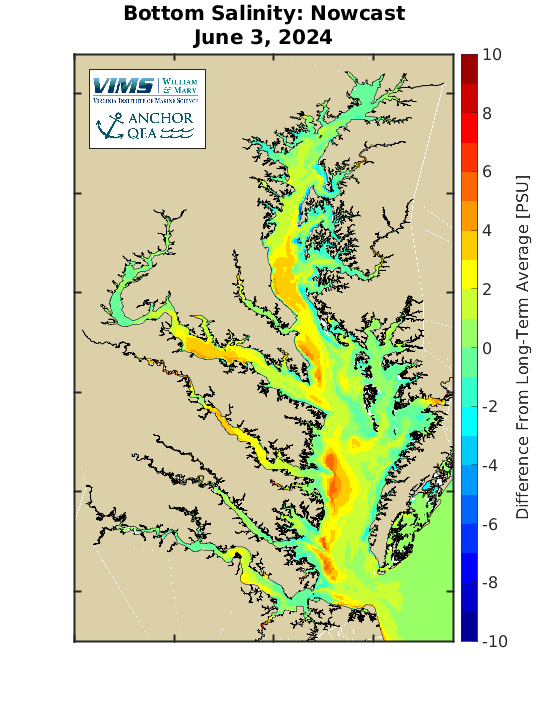
Salinity Maps

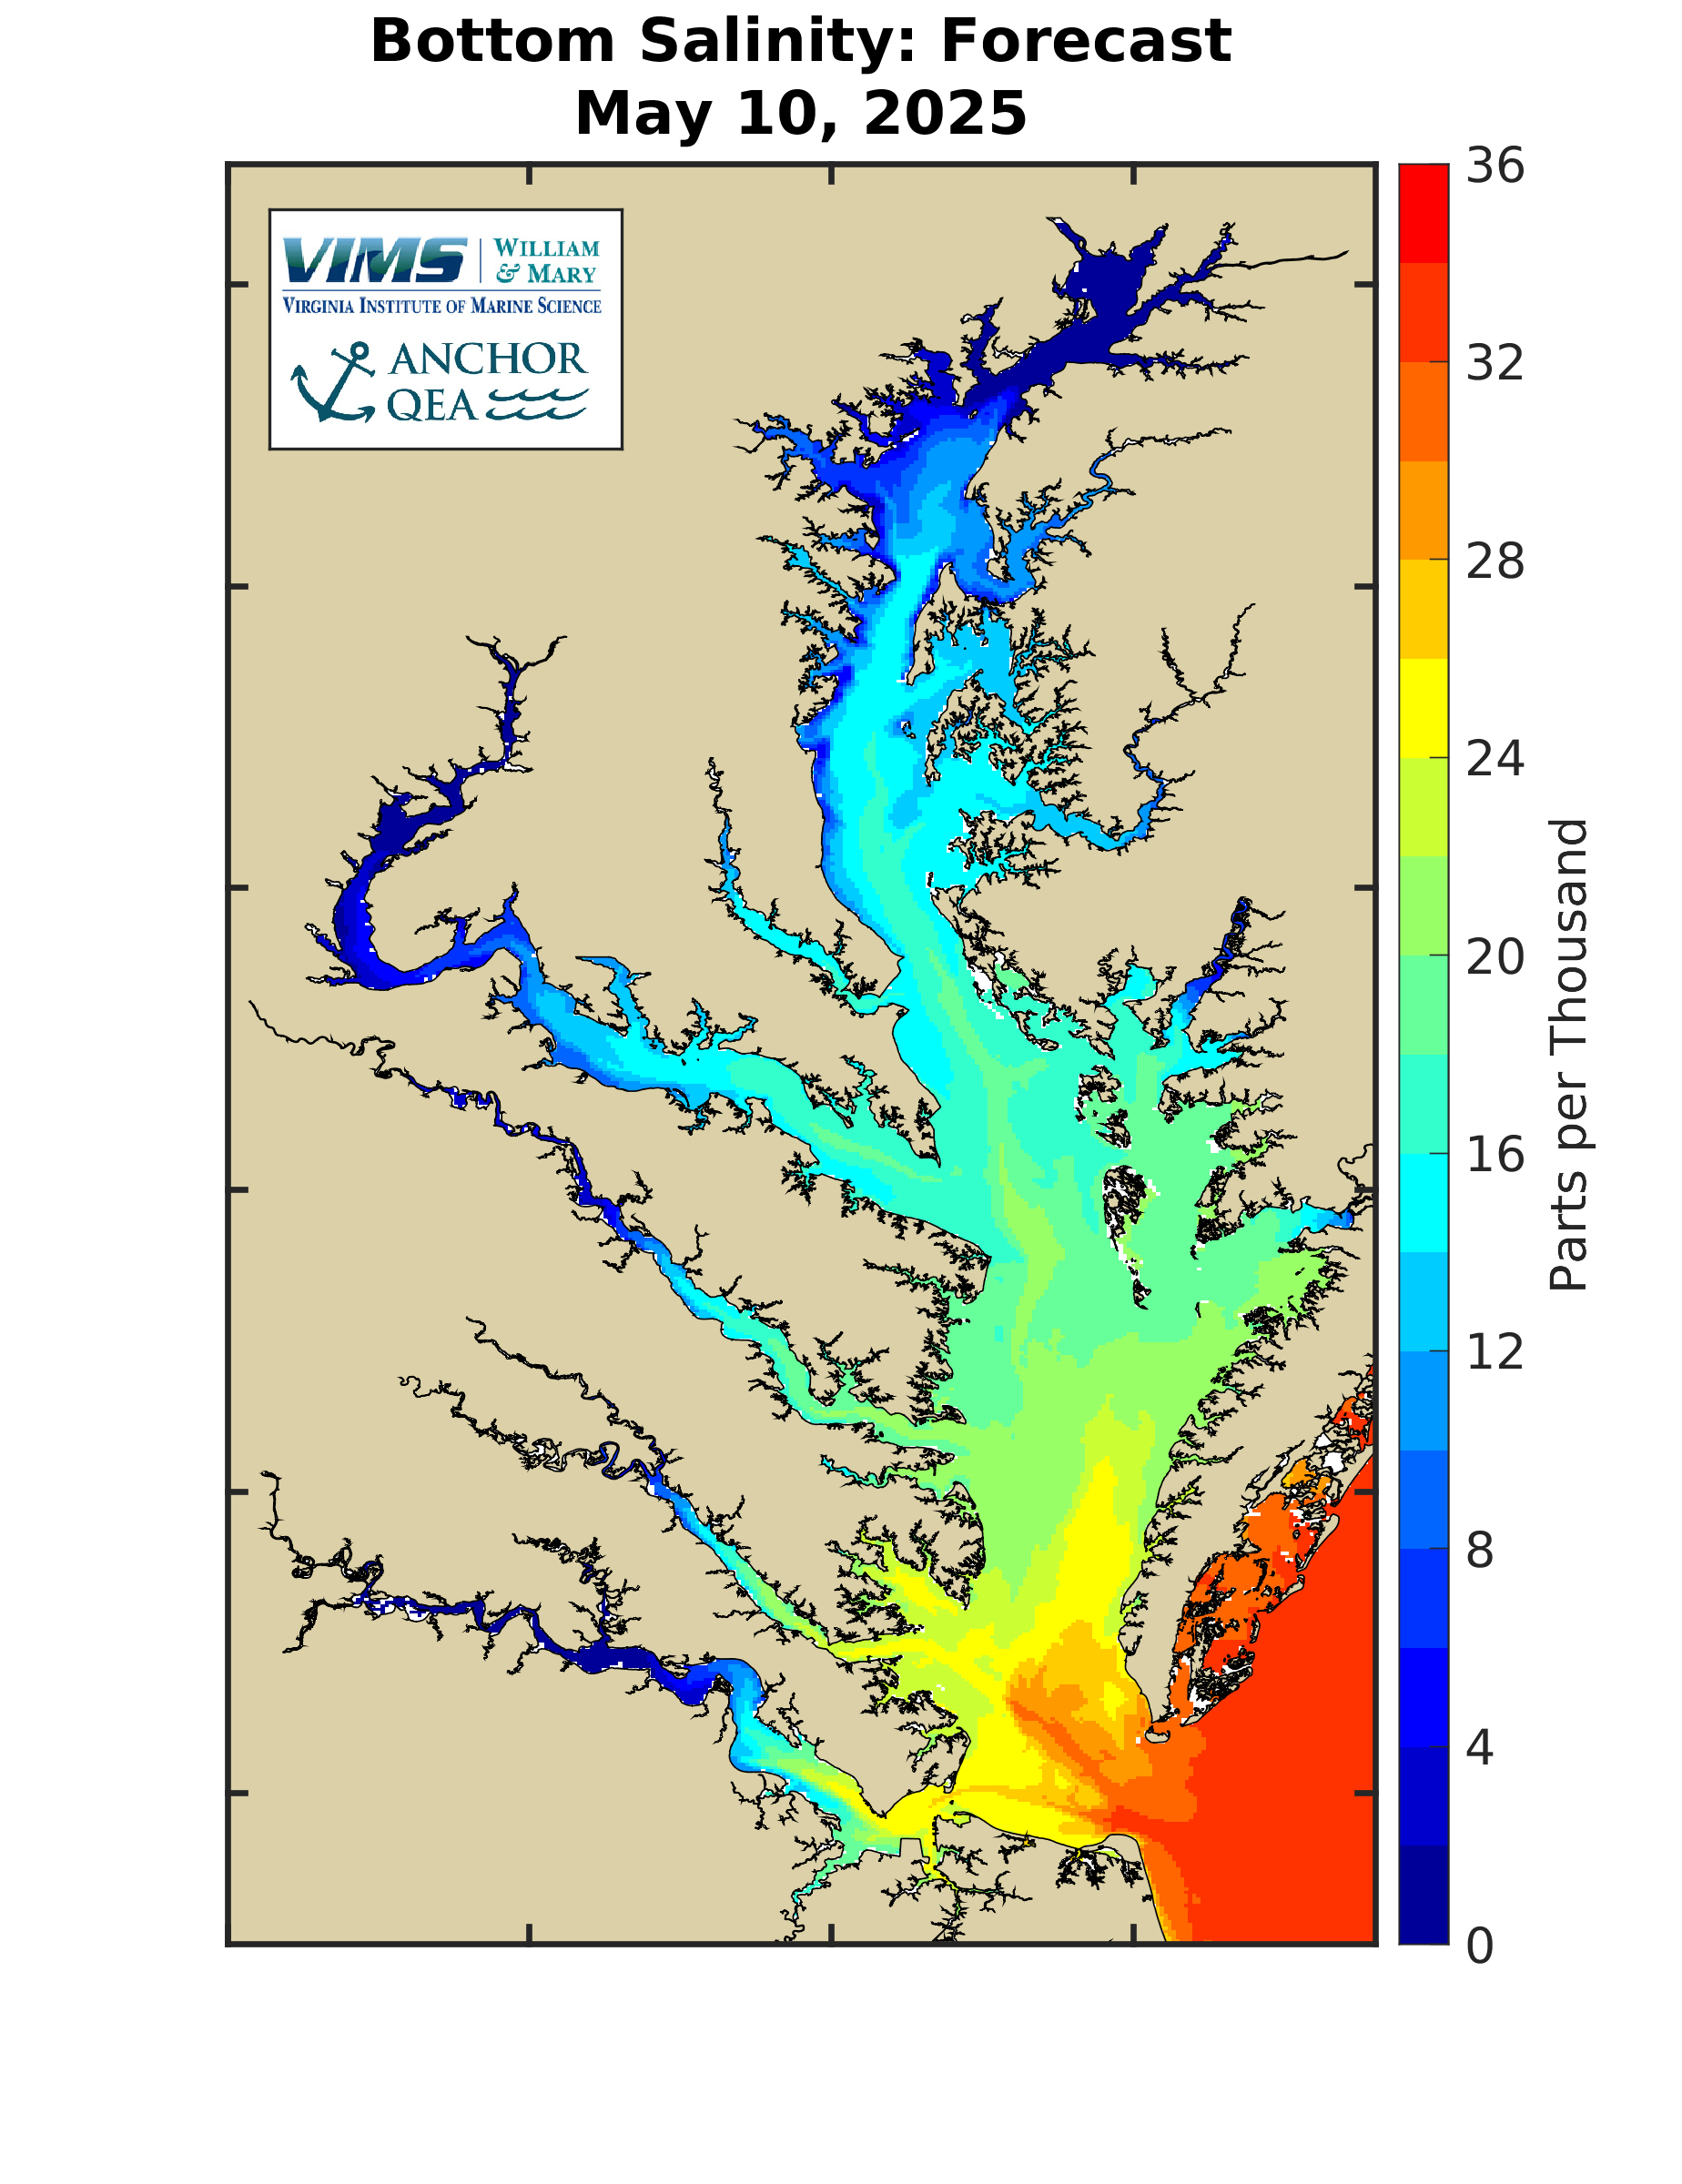
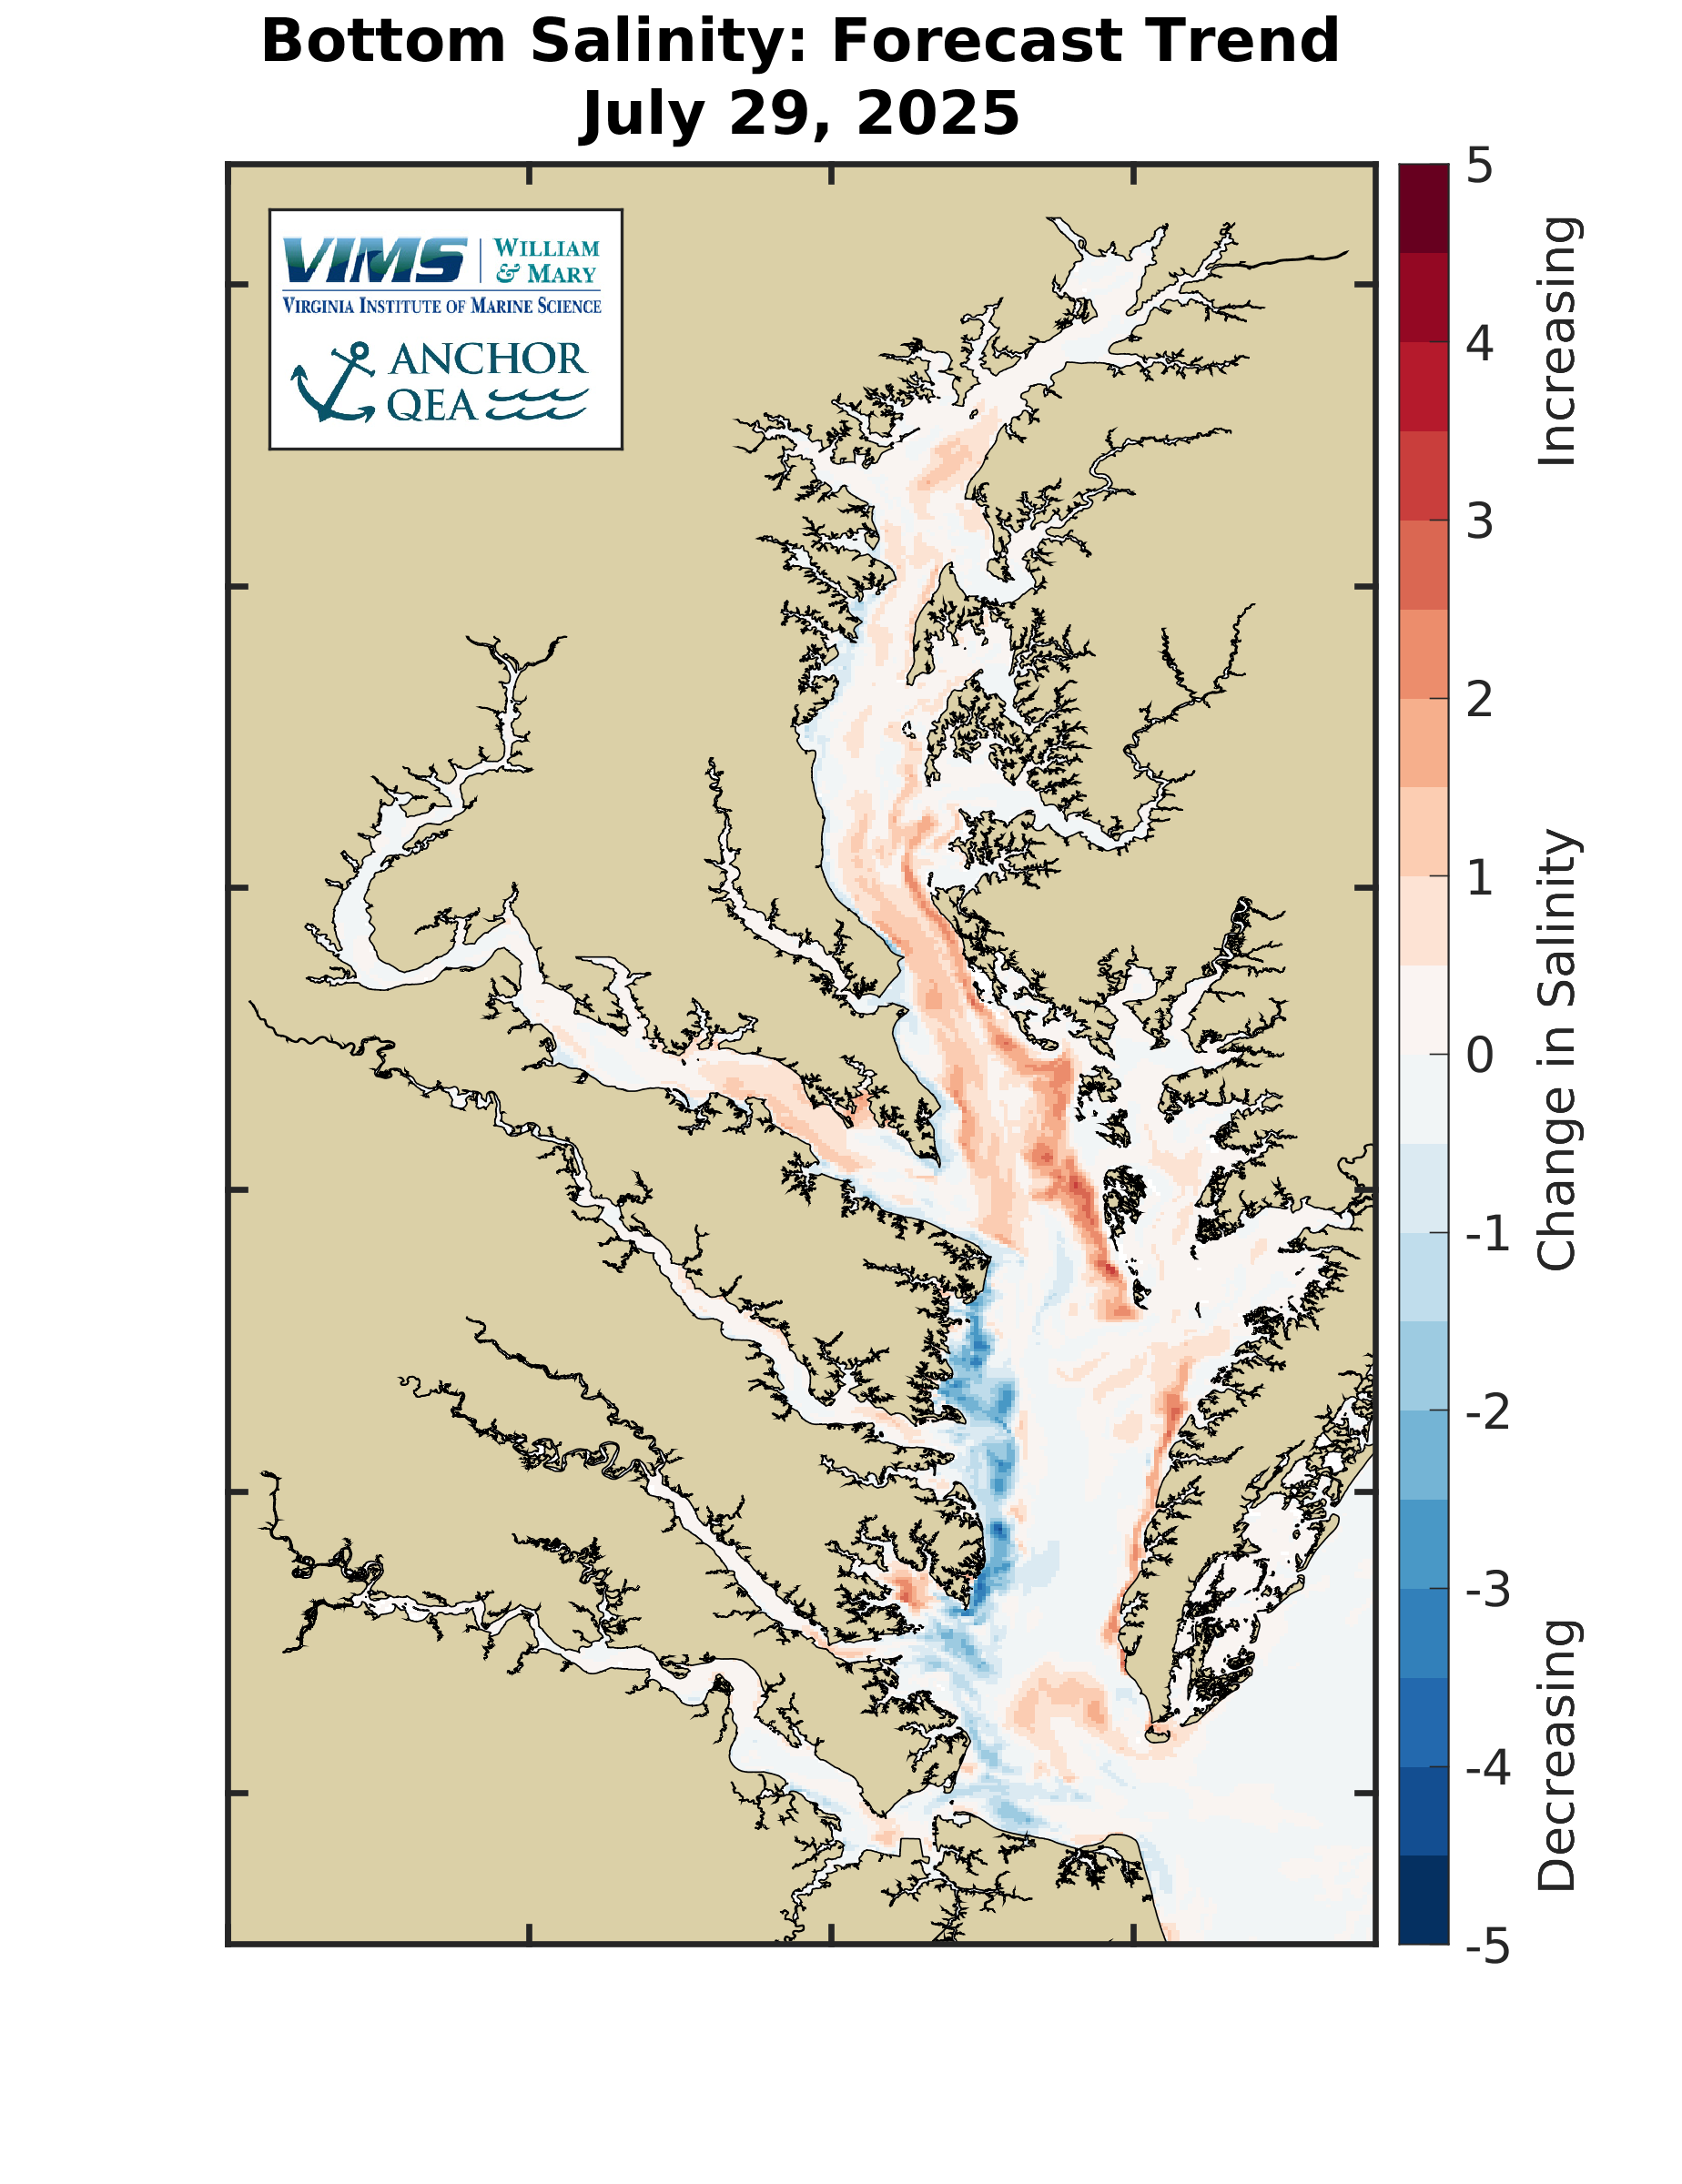
Difference From Long-Term Average
Current conditions are compared to the long-term average conditions to put current conditions in perspective relative to average conditions. Long-term average conditions were calculated using a computer model simulation spanning 1985 through 2023. The below map shows the difference between current conditions and the long-term average conditions on the day noted.For more information on the long-term averages please see the Chesapeake Atlas.