HRVA Persistent Flood Data
Hampton Roads, VA, has played host to numerous recurrent flooding studies over the past seven years. Each new study tends to reveal new information related to which places are vulnerable to tidal/nuisance flooding. Through technological advancement, it is becoming increasingly common to employ crowdsourcing or remote sensing monitoring methods to directly and indirectly detect and identify these flood-prone areas that will inevitably impact the daily lives of citizens who live, work, and visit the Hampton Roads region.
Following years of leadership, collaboration, and demonstrated expertise in a wide array of resilience and water-related disciplines, and recognizing that flooding effects the entire Commonwealth, the Virginia Institute of Marine Science, the College of William & Mary, and Old Dominion University, have established the Commonwealth Center for Recurrent Flooding Resiliency (CCRFR). The CCRFR provides a one-stop shop for supporting the Commonwealth, state agencies, localities, and other entities with scientific and technical support in furtherance of recurrent flooding resiliency, a challenge that affects all of Virginia.
Some of the advisement provided by the CCRFR involves modeling future flooding scenarios. These scenarios are founded upon researching local subsidence and careful analysis of local and global sea-level trends. The long-standing record of expertise the Center for Coastal Resources Management (CCRM) has exemplified in flood-related advisory services through their development the Adapt VA portal, CCRMP’s, and VFRIS in service to the Commonwealth since the CCRM’s inception in 1992.
The CCRFR enables short- and long-term decision making by assisting with the integration and coordination of federal, state, local, and nongovernmental data, evaluating best practices, developing and testing innovative interventions, engaging stakeholders throughout Virginia, and providing outreach, training, technical and non-technical services as requested. As such, the virtual center is well positioned to maintain liaisons with appropriate agencies of the federal government for purposes of leveraging data and funding opportunities, and will have the capacity to lead specific federal funding applications on behalf of the Commonwealth.
A list of the applied uses of recent recurrent flooding studies and related data are populated below with accompanying interactive maps, data citations, and download links to their related metadata below:
Click the collapsible arrows below for more information on each recurrent flood observation data source including an embedded map, attributions, publications featuring the data set, and data download links:
1. 'Sea Level Rise' Mobile App King Tide 2017 Flood Extent Data
Description: "Catch the King" was a citizen science GPS data collection effort centered in Hampton Roads, VA, that sought to map the King Tide's maximum inundation extents with the goal of validating and improving predictive models for future forecasting of increasingly pervasive "nuisance" flooding. GPS data points were collected by volunteers to effectively breadcrumb/trace the high water line by pressing the 'Save Data' button in the Sea Level Rise App every few steps along the water's edge during the high tide on the morning of Nov. 5th, 2017. Response from the event's dedicated volunteers, fueled by the local media partners' coverage leading up to the event, and over 35 separate volunteer training events held all over Hampton Roads resulted in 510 known participants collecting 53,006 time-stamped GPS maximum flooding extent measurements and 1,126 geotagged photographs of the King Tide flooding during the event. In the months following the event, 187 people emailed Dr. Loftis with additional GPS data points missing from the original event as a few volunteers noticed their data missing from the map as he presented it and as it was published in the Daily Press and Virginian-Pilot among other media sources. These data were collected through separate, concomitant, private events established with the Sea Level Rise app on November 5th, 2017 and are included to total 59,008 data points and over 1500 photographs from nearly 700 volunteers. This data set constitutes a large list of GPS locations at the edge of the volunteer-observed maximum flooding extent at the time noted for each data point where tidal inundation occurred on Nov. 5, 2017. Many of the noted areas include notes where tidal flooding data were collected.Data Map: Attributions: Volunteers of 'Catch the King' Tide 2017 collected these data using the Sea Level Rise mobile application developed by Wetlands Watch and Concursive, Inc. Catch the King 2017 was sponsored and supported by The Virginian-Pilot, the Daily Press, WHRO Public Media, and WVEC News 13, and the CCRFR and orchestrated/managed by Qaren Jacklich and a dedicated team of tide captains. GPS Volunteer data were shared with VIMS for public dissemination via Concursive, Inc. and many volunteers directly. To download a copy of all of these GIS data, click one of the designated areas to download a ALL or a subset of the dataset from that city/county/region (updated 11/14/2019):
Data archive in Hampton Roads from other years via the Sea Level Rise Mobile App may be accessed here.
Suggested citation for this viewer and these data:Loftis, Jon Derek. 2017. “Catch the King” Tide Thank You and Review". CCRFR Thank you and Review Community Event at ODU, Dec. 13, 2017. Presentations. 41. DOI: https://doi.org/10.21220/V5Z14X
|
||||||||||||
2. 'Sea Level Rise' Mobile App Trouble Spots
Description: This data set constitutes a list of locations where frequent inundation is known to occur. Many of the noted areas are at roadways and indicate the type of event that causes flooding (tidal, rainfall, or both). Data Map: Attributions: Volunteers using the Sea Level Rise mobile application developed by Wetlands Watch and Concursive, Inc., collected these frequent flooding locations throughout coastal Virginia. Many are noted with the conditions that cause flooding to occur in their region. Data were shared with VIMS for public dissemination via Concursive, Inc. To download a copy of these GIS data, click below: Suggested citation for this viewer and these data:Loftis, Jon Derek. 2017. “Catch the King” Tide Thank You and Review". CCRFR Thank you and Review Community Event at ODU, Dec. 13, 2017. Presentations. 41. DOI: https://doi.org/10.21220/V5Z14X
|
||||||||||||
3. Action-Oriented Stakeholder Engagement for a Resilient Tomorrow Data
Description: This data set was collected by Old Dominion University as part of the Action-Oriented Stakeholder Engagement for a Resilient Tomorrow (ASERT) community initiative and was designed to facilitate collaboration between residents, businesses and local governments to discover appropriate adaptation strategies that can be put into action. The data set shared here constitutes a list of locations where frequent inundation is known to occur and was self-reported by citizens in their local communities in outside Hampton Roads. Many of the noted areas are at roadways or near community assets known to the volunteers adding them to the map and many indicate the type of event that causes flooding (tidal, rainfall, or both). Please view the original story map if you would like more information or have flood data you would like to contribute: https://arcg.is/0XminP.Data Map: Attributions: Volunteers in the outside cities of Hampton Roads collected and documented these flooding locations at community events in 2017-2018. The ASERT project was supported by the CCRFR, the City of Virginia Beach, and Virginia Sea Grant with data collection using Participatory GIS methods. Data were shared by ODU with VIMS, in partnership through the CCRFR for public dissemination. These data include all flood locations entered before: 08/14/2018. To download a copy of these GIS data, click below: Suggested citation for the ASERT story map/viewer, and these data: Yusuf, J.E.W., Rawat, P., Considine, C., Covi, M., St John, B., Nicula, J.G. and Anuar, K.A., 2018. Participatory GIS as a Tool for Stakeholder Engagement in Building Resilience to Sea Level Rise: A Demonstration Project. Marine Technology Society Journal, 52(2), pp.45-55. https://doi.org/10.4031/MTSJ.52.2.12.
|
||||||||||||
4. StormSense Suitable Sensor Location Analysis using SCHISM Modeling
Description: This data set was developed by identifying a list of known bridges over open waterways where bridge deck heights over the underlying river channel were detected via Lidar to be high enough to not flood during a category 2 hurricane. 85 such bridges were identified and extracted as locations for further review using VIMS' SCHISM hydrodynamic model under storm surge and regular tidal conditions. Upon comparison, 22 sites were identified as locations that were ideal and suitable for future water level sensor installation through StormSense. VIMS then sought partnerships to aid in deployment of more sensors to validate and improve their models in more places as the resolution of their models increased. Data Map: Attributions: The SCHISM hydrodynamic model used to evaluate the 85 bridges and identify 22 suitable sensor install sites is open-source and actively developed by Dr. Joseph Zhang at VIMS' CCRM. NIST, VDEM, and NRDC so far have aided the region's cities in installing 28 new water level sensors in Hampton Roads, VA, in 2017 and 2018. The new city-maintained StormSense gauges are in addition to the tireless continuing efforts of USGS and NOAA to monitor and predict (respectively) water levels in the region. Real-time sensor data were are shared with VIMS through a triumvarate of cloud platforms including AGOL, AWS, and Valarm (sensor vendor) and publicly-streaming data links for each site, including a map of all regional water level sensors may be found at this page. To download a copy of these GIS data, click below: Suggested citation for this viewer and these data: Loftis, Jon Derek; Forrest, David R.; and Spencer, Kyle. "StormSense Project: Forecasting Flooding from Storm Surge, Rain, and Tide". 3-24-2017. Hampton Roads Planning District Commission, Regional Resilience Council Meeting. https://doi.org/10.21220/V5GM9B.Loftis, J.D., Forrest, D., Katragadda, K., Spencer, K., Organski, T., Nguyen, C. & Rhee, S. (2018). StormSense: A New Integrated Network of IoT Water Level Sensors in the Smart Cities of Hampton Roads, VA. Marine Technology Society Journal, 52(2): 56-67. URLLoftis, J.D. , Katragadda, K., Rhee, S. & Nguyen, C. (2018). StormSense: A Blueprint for Coastal Flood Forecast Information & Automated Alert Messaging Systems. SCOPE '18 Proceedings of the 3rd International Workshop on Science of Smart City Operations and Platforms Engineering , 3(1). URL
|
||||||||||||
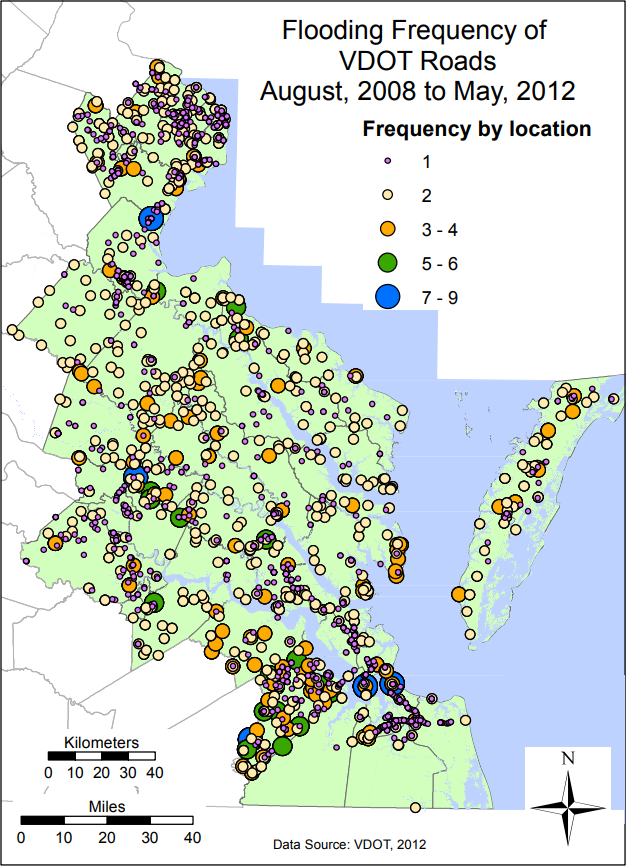
5. Tidewater Virginia Recurrent Flood Study
Description: This data report was published in 2013 and includes a map list of locations in Hampton Roads where frequent inundation is known to occur in roadways in Figure 9, pg. 71, of the cited report below showing VDOT flooded roadways (by frequency).
To download a copy of the report, click below: Suggested citation for these data:Mitchell, M., Hershner, C. H., Herman, J. D., Schatt, D. E., Eggington, E., & Center for Coastal Resources Management, Virginia Institute of Marine Science. (2013) Recurrent flooding study for Tidewater Virginia. Virginia Institute of Marine Science, College of William and Mary. https://doi.org/10.21220/V5TG79.
|
||||||||||||
6. Locality-Identified Potential Sensor Locations
Description: In 2019, the Hampton Roads Planning District Commission (HRPDC) sent out a Request for Information (RFI) to sensor vendors to explore installing sensors on roadways frequently impacted by tidal or rainfall-induced inundation. Persistent flooding issues with urban mobility in Hampton Roads is an increasingly difficult issue to address. Thus, communities responded via an interactive web map the HRPDC created and shared via an ArcGIS Online URL to provide data on high and low priority areas that are known to flood in their respective communities. These areas were labeled associated with the cause of flooding ('tidal', 'rainfall', or both) and are color-coded based upon whether roadway sensors are of 'high' or 'low' priority for future installation, and whether the locality already has 'planned' contracts in place to install sensors there themselves. The resulting data map retrieved after the polling closed in June 2019 is shown below. Data Map: Attributions: City planners and emergency managers in the respective localities where the prospective roadway sensor locations are suggested provided these data to the HRPDC. The HRPDC's map product is intended to inform the future eventual placement of roadway sensors in Hampton Roads, VA. To download a copy of these GIS data, click the download link below (updated 11/05/2019): HRPDC. 2019. |