

Virginia Beach Inundation Model
(Use the Bottom Slider Bar to Temporally Navigate Through the Flood Event)
Description:
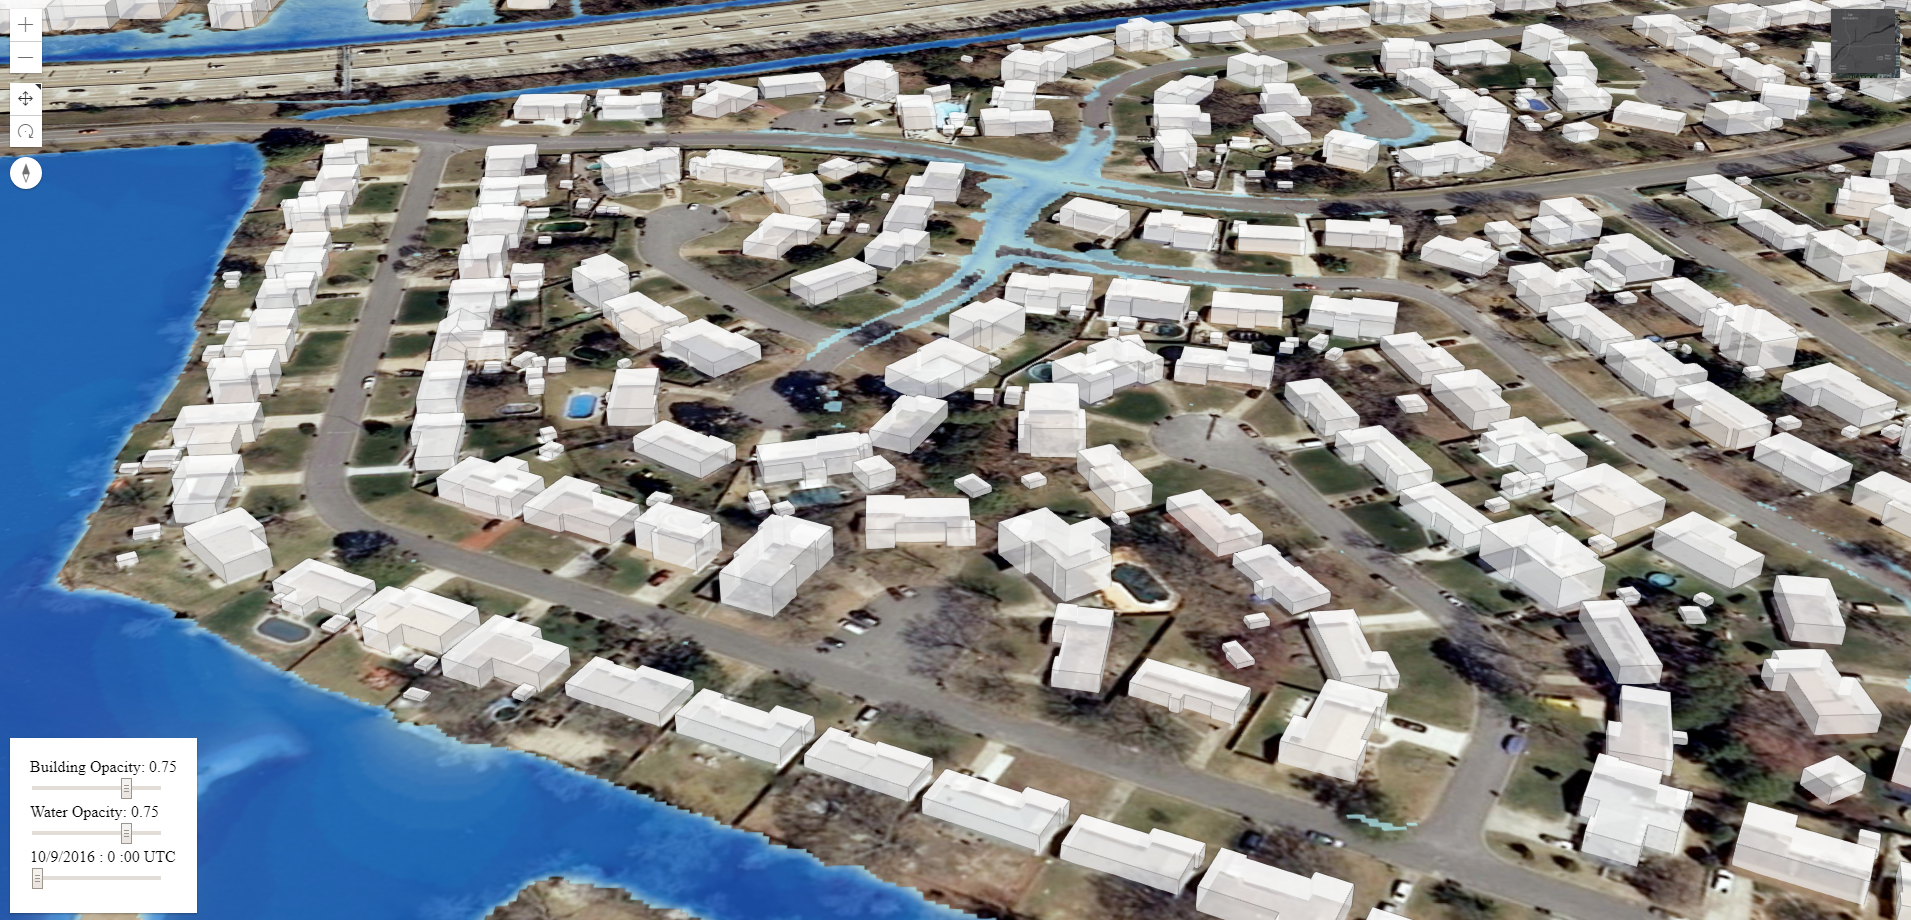
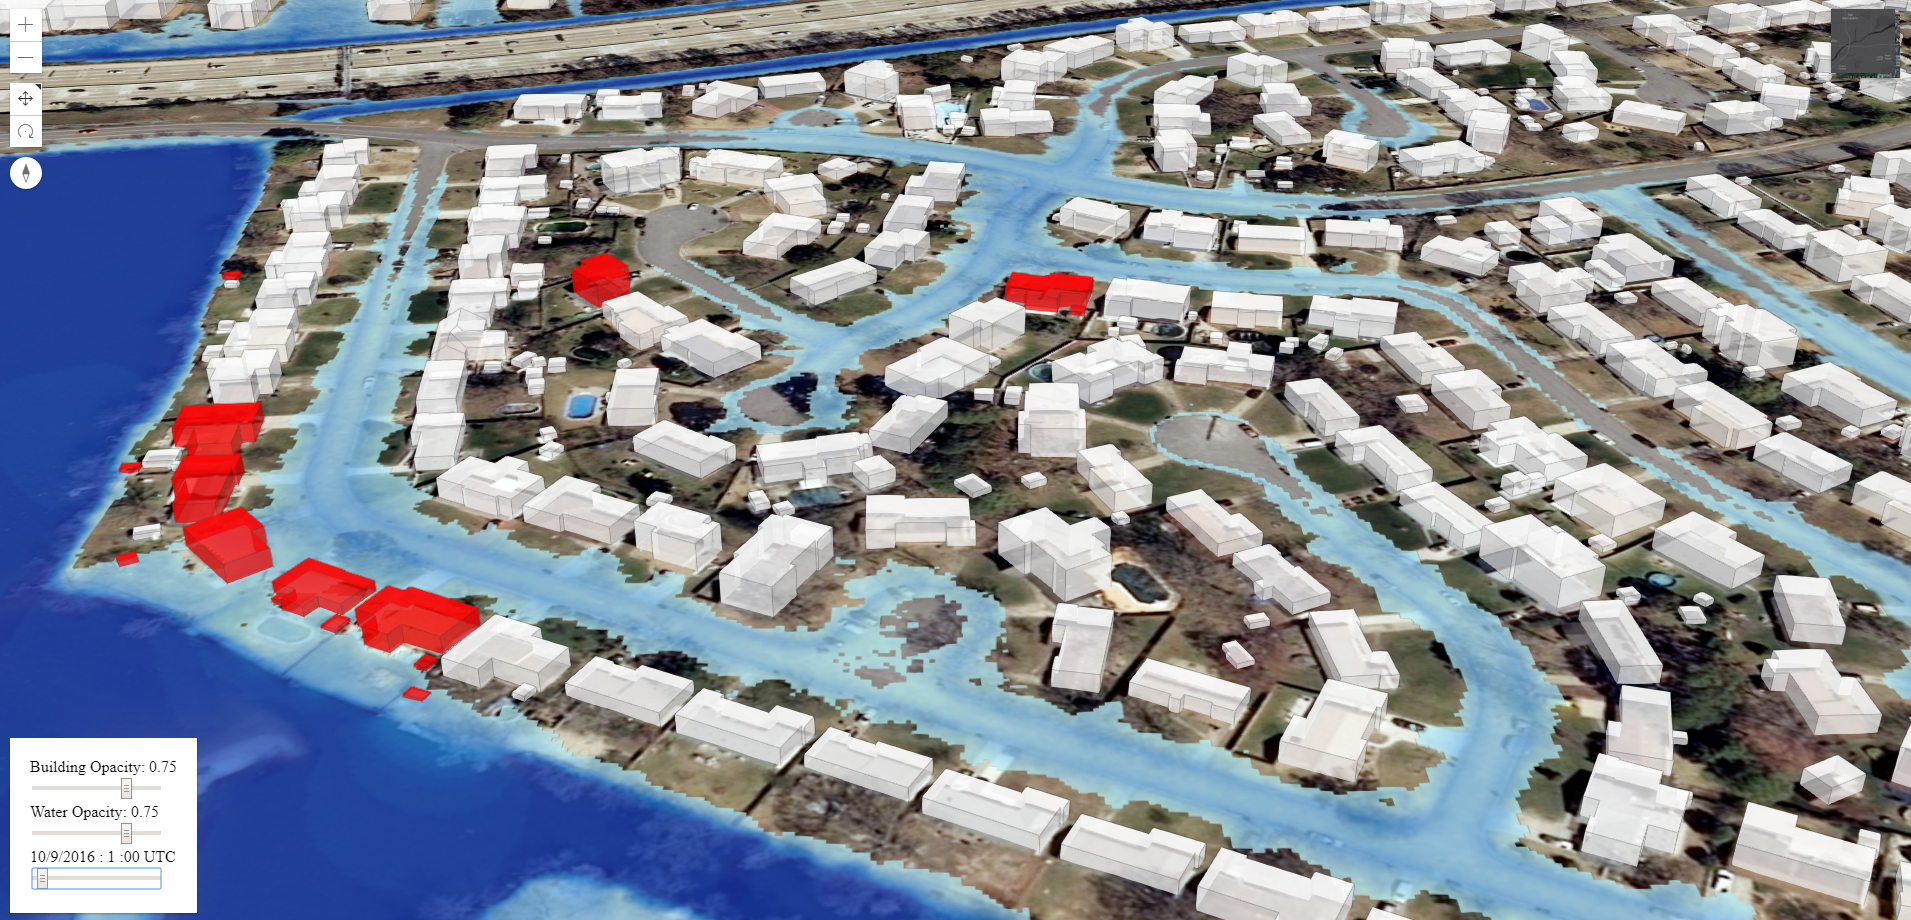
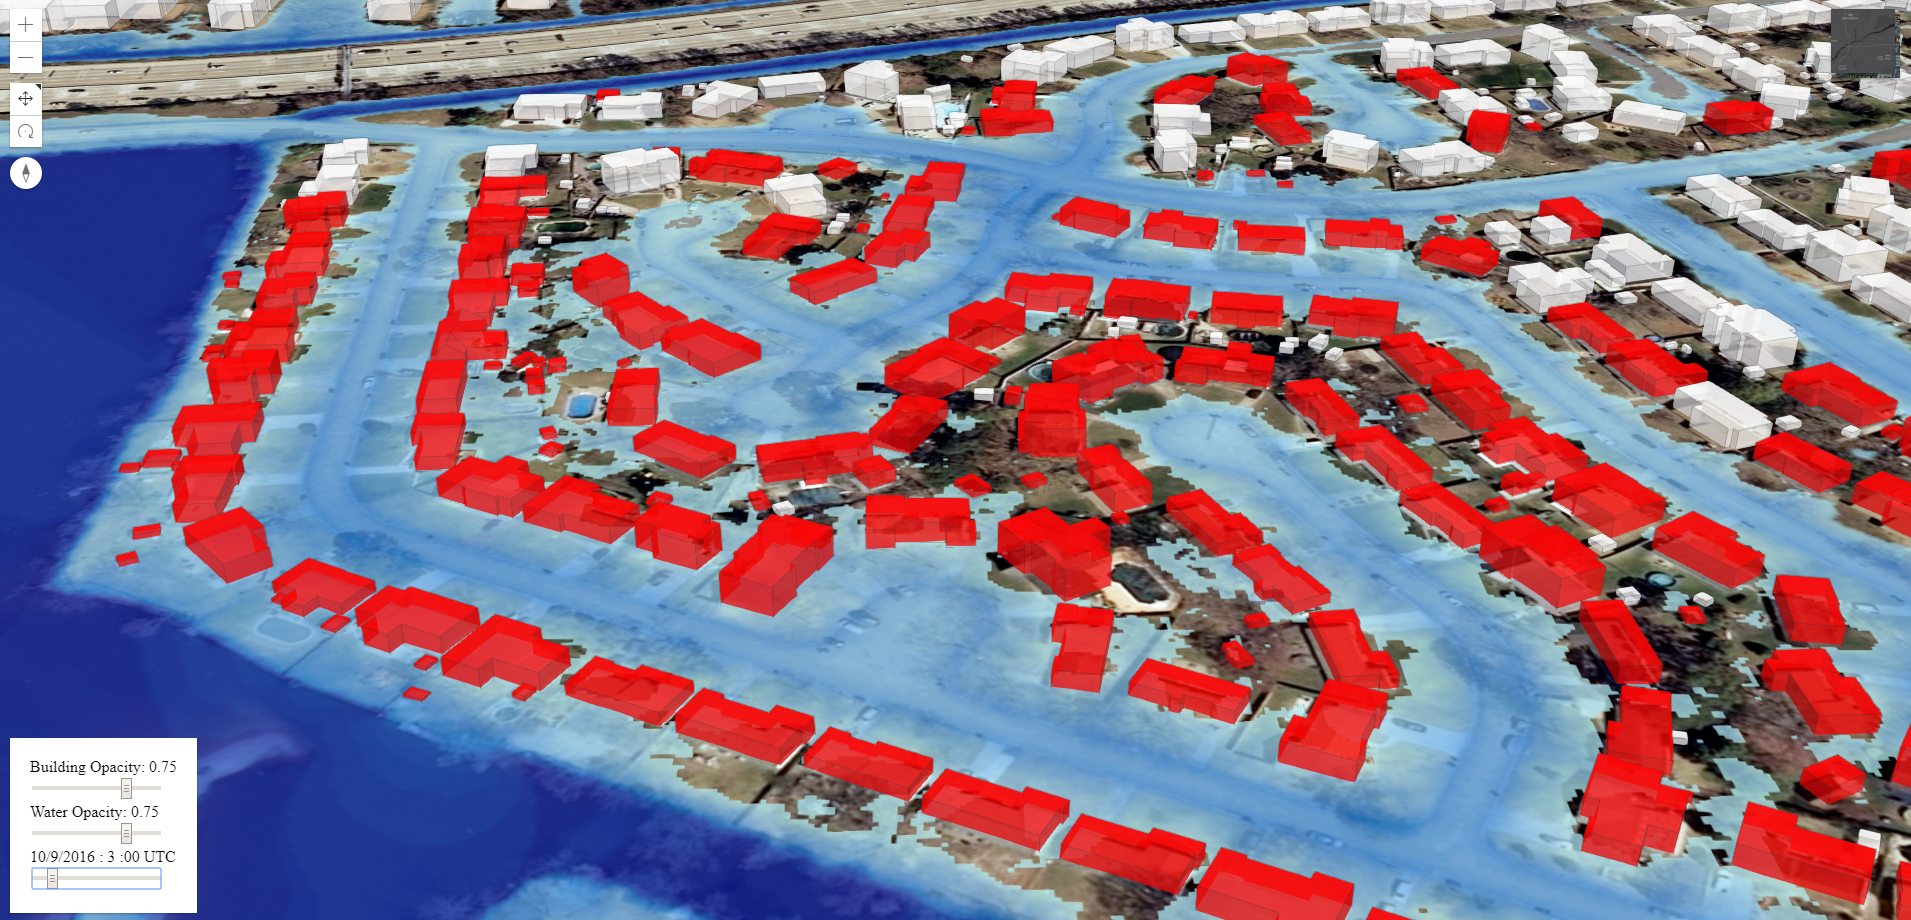
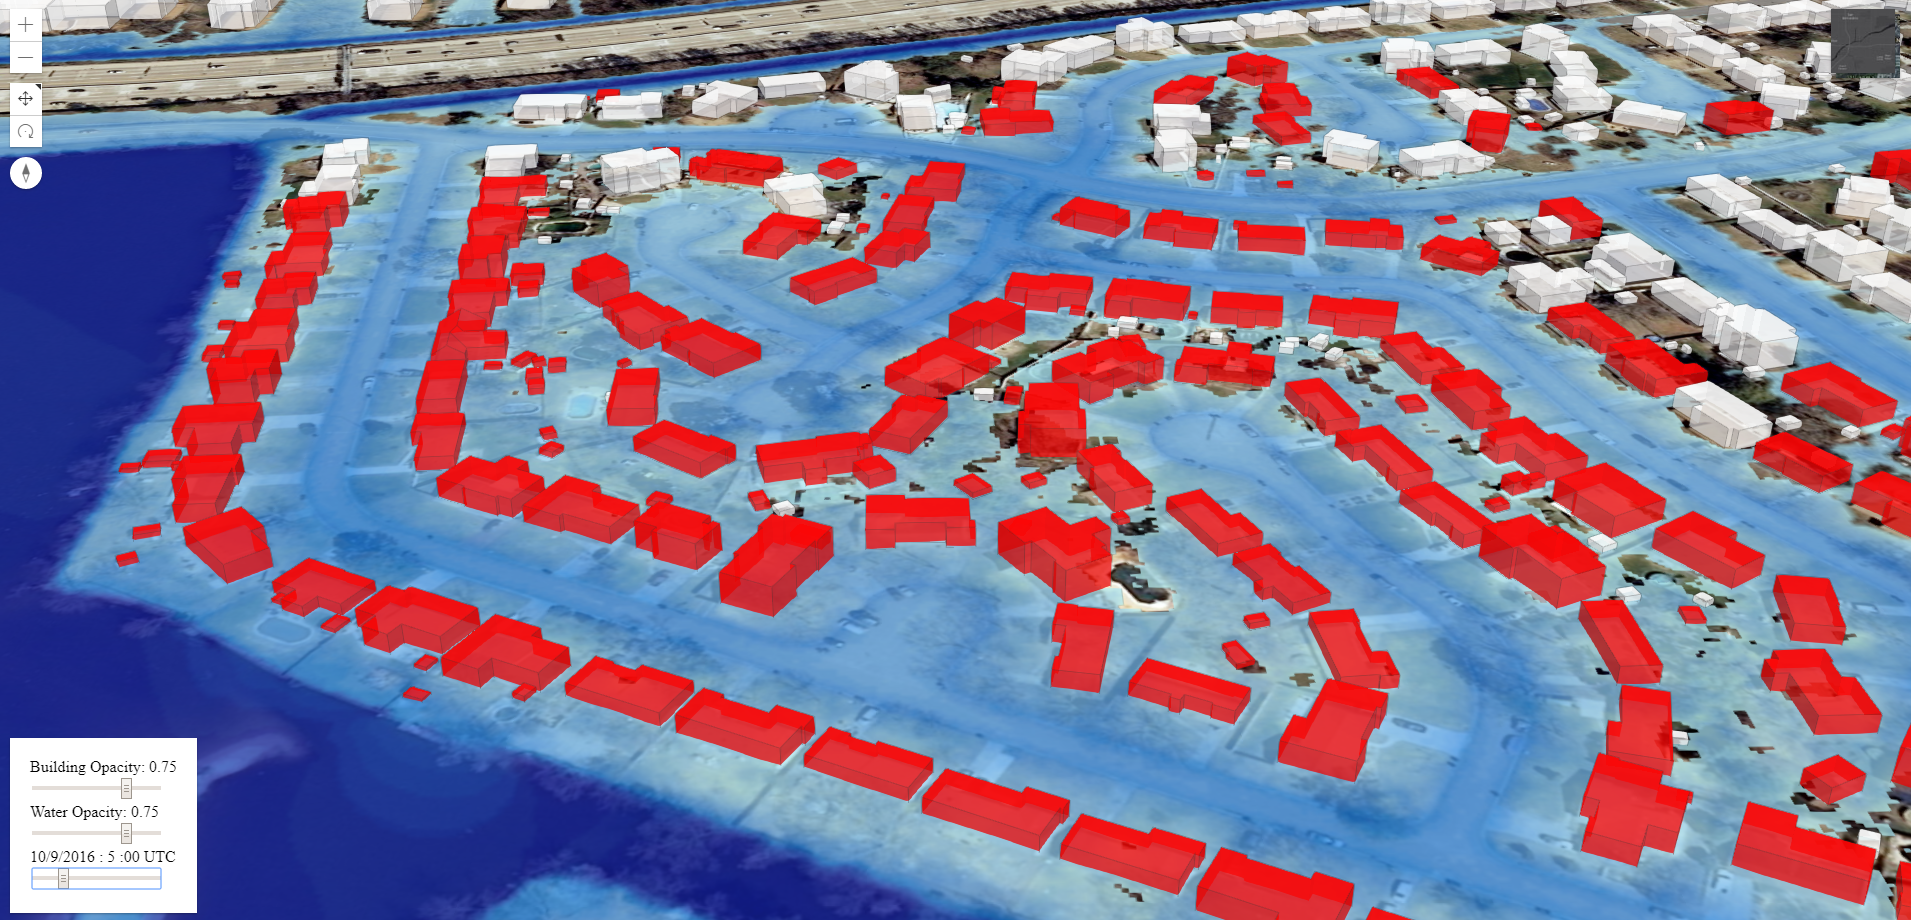
This dynamic series of flood layers feature 2016 Hurricane Matthew in inland Virginia Beach, VA, driven by Dr. Derek Loftis using VIMS/W&M's street-level hydrodynamic model from 00:00-23:00 UTC on 10/09/2016. The 3D building layers featured here were developed from raw aerial lidar by Geoff Taylor from ESRI. Building-level flood exposure is illustrated by highlighting buildings in red according to the selected time; select a highlighted 3D building to ascertain flood height adjacent to the structure (in feet).
Model Setup:
Tides & Surge: Tidal (Dirichlet) open boundary conditions were prescribed to match 3 USGS tide gauges in Virginia Beach near the edges of the domain's extent. These 3 USGS tide gauges (along with 7 others, which were permanently installed by the USGS in 2016) and 10 StormSense gauges installed in the City in 2017 have been incorporated into StormSense by Sridhar Katragadda and his colleagues at the City of Virginia Beach and into VIMS' Tidewatch tidal forecast model by Dr. David Forrest at VIMS. Water levels may also be queried through smart devices via the StormSense Alexa Skill.
Rainfall & Infiltration: Successful simulation involved spatially-varying rainfall inputs supplied by 21 rain gauges (12 from HRSD and 9 from the City of Virginia Beach). Precipitation inputs were counter-balanced with: (1) soil infiltration; allowing water to percolate through the bottom of the grid mesh at spatially-varying rates defined by 1m-resolution land cover data, and (2) 6 USGS groundwater wells similar to Loftis et al.'s publication in the Journal of Coastal Research (2016, cited below). Additionally, (3) stormwater drainage infrastructure pipelines and outflow locations were incorporated from the City's open GIS database to best represent guided subterranean fluid transport not accounted for in (1) and (2) above.
Structures & Extents: First floor elevations were not available in the region of analysis, thus highlighted buildings are simply those exposed to the model-predicted flood waters at depths greater than 3 in., and do not necessarily represent significant monetary losses, damaged, or destroyed structures. Click on a structure to ascertain its relative flood exposure and inundation depths (in ft.) at each hourly time interval of the simulation. Note: Large highlighted structures with minimal roof slope, which are not directly adjacent to accumulated flood waters may be erroneously highlighted due to the heavy rainfall accumulation collecting in puddles deeper than the 3 in. established depth threshold on their relatively flat rooves. Flood extents were validated by city street closure maps provided by Rob Jessen and drone aerial footage.
10/09/2016 @ 00:00 UTC
|
10/09/2016 @ 01:00 UTC
|
10/09/2016 @ 03:00 UTC
|
10/09/2016 @ 05:00 UTC
|
Click on a flood frame to enlarge image.
Attributions:
VIMS/W&M's street-level hydrodynamic model has been developed by Drs. Derek Loftis and Harry Wang at VIMS. Geoff Taylor at ESRI built the 3D GIS building-level impact assessment model in Virginia Beach using Esri's 3D Risk viewer v.4.7 developed at Esri. Buildings highlighted in red are those estimated to be impacted by the floodwaters and heavy rain accumulation at depths greater than 3 in. during Hurricane Matthew.
Promenent Publications, Presentations, and Reports Related to this Simulation:
Loftis, J.D., & Taylor, G. (2018). Leveraging Web 3D for Street-Level Flood Forecasts. ArcUser, 21(4): 22-25. URL
Loftis, J.D., Forrest, D., Katragadda, K., Spencer, K., Organski, T., Nguyen, C. & Rhee, S. (2018). StormSense: A New Integrated Network of IoT Water Level Sensors in the Smart Cities of Hampton Roads, VA. Marine Technology Society Journal, 52(2): 56-67. URL
Click to Access Personal Use Paper CopyThe Marine Technology Society is a not-for-profit, international, professional association. Founded in 1963, the Society believes that the advancement of marine technology and the productive, sustainable use of the oceans depend upon the active exchange of ideas between government, industry and academia. See www.mtsociety.org. |
Boon, J.D., Mitchell, M., Loftis, J.D. & Malmquist, D.M. (2018). Anthropocene Sea Level Change: A History of Recent Trends Observed in the U.S. East, Gulf, and West Coast Regions. Special Report in Applied Marine Science and Ocean Engineering (SRAMSOE). No. 467. Virginia Institute of Marine Science, College of William and Mary. URL
Loftis, J.D. , Katragadda, K., Rhee, S. & Nguyen, C. (2018). StormSense: A Blueprint for Coastal Flood Forecast Information & Automated Alert Messaging Systems. SCOPE '18 Proceedings of the 3rd International Workshop on Science of Smart City Operations and Platforms Engineering , 3(1). URL
Loftis, J.D., Mitchell, M., Atkinson, L., Hamlington, B., Allen, T.R., Forrest, D., Updyke, T., Tahvildari, N., Bekaert, D. & Bushnell, M. (2018). Integrated Ocean, Earth and Atmospheric Observations in Hampton Roads, Virginia. Marine Technology Society Journal, 52(2): 68-83. URL
Click to Access Personal Use Paper CopyThe Marine Technology Society is a not-for-profit, international, professional association. Founded in 1963, the Society believes that the advancement of marine technology and the productive, sustainable use of the oceans depend upon the active exchange of ideas between government, industry and academia. See www.mtsociety.org. For personal use only; not to be distributed in any format. For personal use only; not to be distributed in any format. |
Loftis, J.D., Wang, H., Forrest, D., Rhee, S., Nguyen, C. (2017). Emerging Flood Model Validation
Frameworks for Street-Level Inundation Modeling with StormSense. SCOPE '17 Proceedings of the 2nd International Workshop on Science of Smart City Operations and Platforms Engineering, 2(1), 13-18. URL
Loftis, J.D., Wang, H.V., DeYoung, R.J. & Ball, W.B. (2016). Using Lidar Elevation Data to Develop a Topobathymetric Digital Elevation Model for Sub-Grid Inundation Modeling at Langley Research Center, In: Brock, J.C.; Gesch, D.B.; Parrish, C.E.; Rogers, J.N., and Wright, C.W. (eds.), Advances in Topobathymetric Mapping, Models, and Applications. Journal of Coastal Research, Special Issue 76, 134-148. Coconut Creek (Florida), ISSN 0749-0208. URL