
'Catch the King' on Oct. 27-29, 2023
Model-Predicted Maximum Flooding Extents compared with Community Science Mobile App Observations for the King Tides during October 27-29, 2023, from 08:00 AM - 03:59 PM EST
"Catch the King" is a community science GPS data collection effort focused on coastal Virginia, USA, that seeks to interactively map the King Tide's maximum inundation extents. The goal is to validate and improve predictive model accuracy for future forecasting of increasingly pervasive "nuisance" flooding. The composite maximum king tide inundation forecast for October 27-29, 2023, is shown in the map on this page, generated from VIMS' Tidewatch Map. Annually, a live tidal calibration of the forecasts driven from the Center for Coastal Resources Management's SCHISM hydrodynamic model (developed by Dr. Joseph Zhang) is conducted by trained volunteers using the free Sea Level Rise mobile application (iOS / Android) developed by Wetlands Watch and Concursive.
{{youtube:large|-CpB3iI2b40, See Catch the King's Recent Media Coverage on The Weather Channel.}}
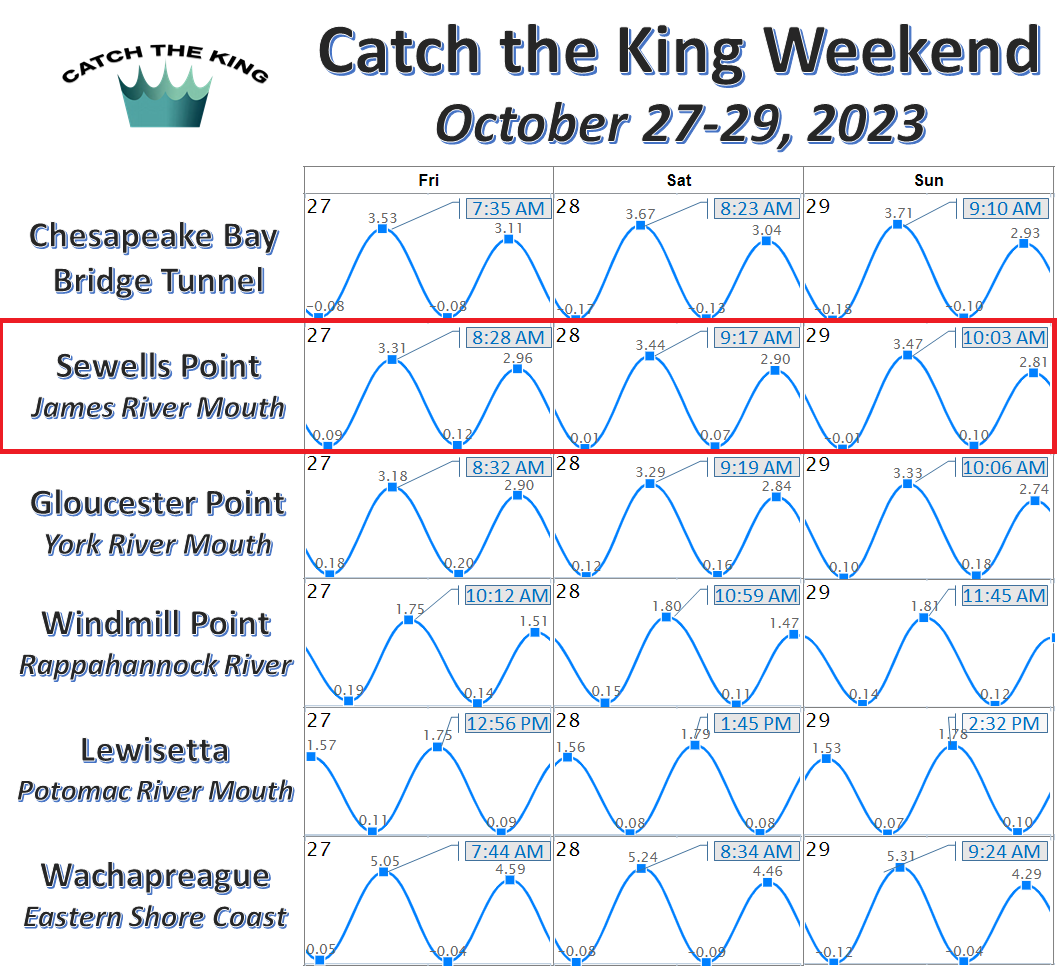
In 2023, Catch the King took place on the weekend of October 27-29, 2023, during some of the highest astronomical tides of the year, which were harmonically forecasted to be 3.26-3.48 ft. above MLLW at Sewells Point in Norfolk, VA. The king tide took place at many different times at coastal places throughout the Commonwealth of Virginia's coastal region.
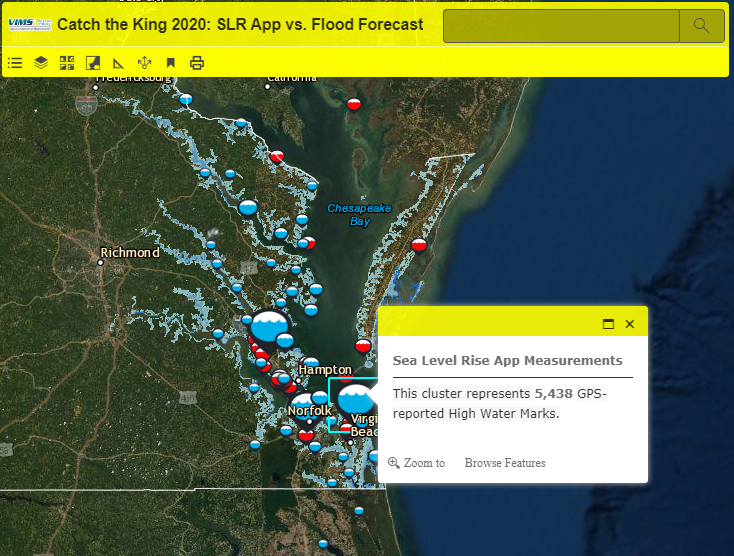
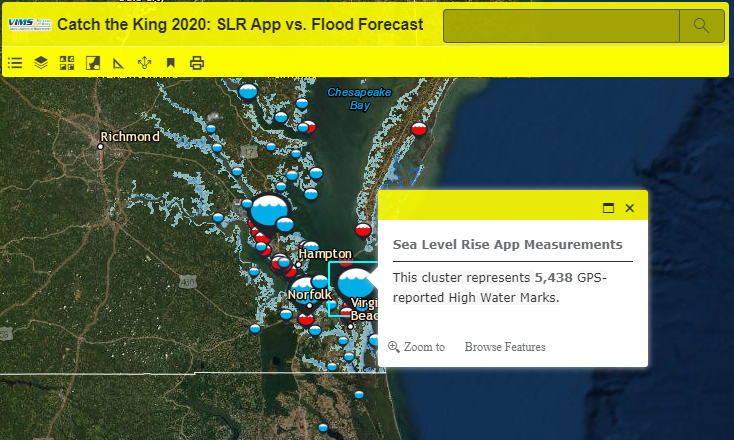
10/27-29/2023 - Catch the King Tide Data Map
Map Legend:
![]() - Blue GPS data points (over 13,000 GPS high-water marks) show areas where volunteers effectively breadcrumbed/traced the high water line by pressing the 'Save Data' button in the Sea Level Rise (SLR) App every few steps along the water's edge. These GPS data were collected during the king tide in the mornings of Oct. 27-29th, 2023. Click on a point to zoom in, disaggregate points, and view timestamps.
- Blue GPS data points (over 13,000 GPS high-water marks) show areas where volunteers effectively breadcrumbed/traced the high water line by pressing the 'Save Data' button in the Sea Level Rise (SLR) App every few steps along the water's edge. These GPS data were collected during the king tide in the mornings of Oct. 27-29th, 2023. Click on a point to zoom in, disaggregate points, and view timestamps.
![]() - Red points correspond with water level sensors in the NOAA (10), USGS (18), VIMS (2), and StormSense (28) networks, which are aggregated and ingested into VIMS' Tidewatch Forecasting Network. Before Catch the King, forecasted tidal inundation extents were displayed; and blue dots were added afterward. Observations and predictions are archived and displayed at each station location when selected. For Tidewatch Charts, current water level forecast information is available for up to 36-hrs from the present time.
- Red points correspond with water level sensors in the NOAA (10), USGS (18), VIMS (2), and StormSense (28) networks, which are aggregated and ingested into VIMS' Tidewatch Forecasting Network. Before Catch the King, forecasted tidal inundation extents were displayed; and blue dots were added afterward. Observations and predictions are archived and displayed at each station location when selected. For Tidewatch Charts, current water level forecast information is available for up to 36-hrs from the present time.
![]() - The blue flood layer is superposed with satellite imagery on this interactive map represents forecasted maximum flooding extents for the King Tide happening in Hampton Roads on 10/27-29/2022, from 8:00 AM - 3:59 PM EDT, with the Sea Level Rise App data serving as an effective validation of the model's predictions. This layer represented inundation extents predicted by VIMS' models months before the king tide event. These tidal inundation forecast results are then updated days before Catch the King to account for near-term weather-related impacts on the king tide as a comprehensive storm tide forecast using a range of blue hues corresponding with flood depths, and are advised by VIMS' hydrodynamic models and by Tidewatch.
- The blue flood layer is superposed with satellite imagery on this interactive map represents forecasted maximum flooding extents for the King Tide happening in Hampton Roads on 10/27-29/2022, from 8:00 AM - 3:59 PM EDT, with the Sea Level Rise App data serving as an effective validation of the model's predictions. This layer represented inundation extents predicted by VIMS' models months before the king tide event. These tidal inundation forecast results are then updated days before Catch the King to account for near-term weather-related impacts on the king tide as a comprehensive storm tide forecast using a range of blue hues corresponding with flood depths, and are advised by VIMS' hydrodynamic models and by Tidewatch.

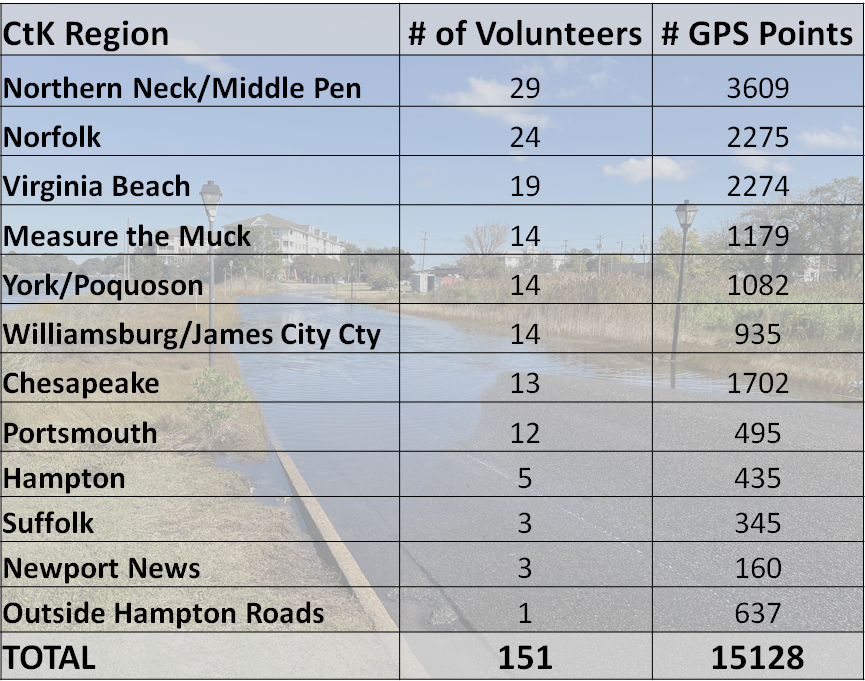
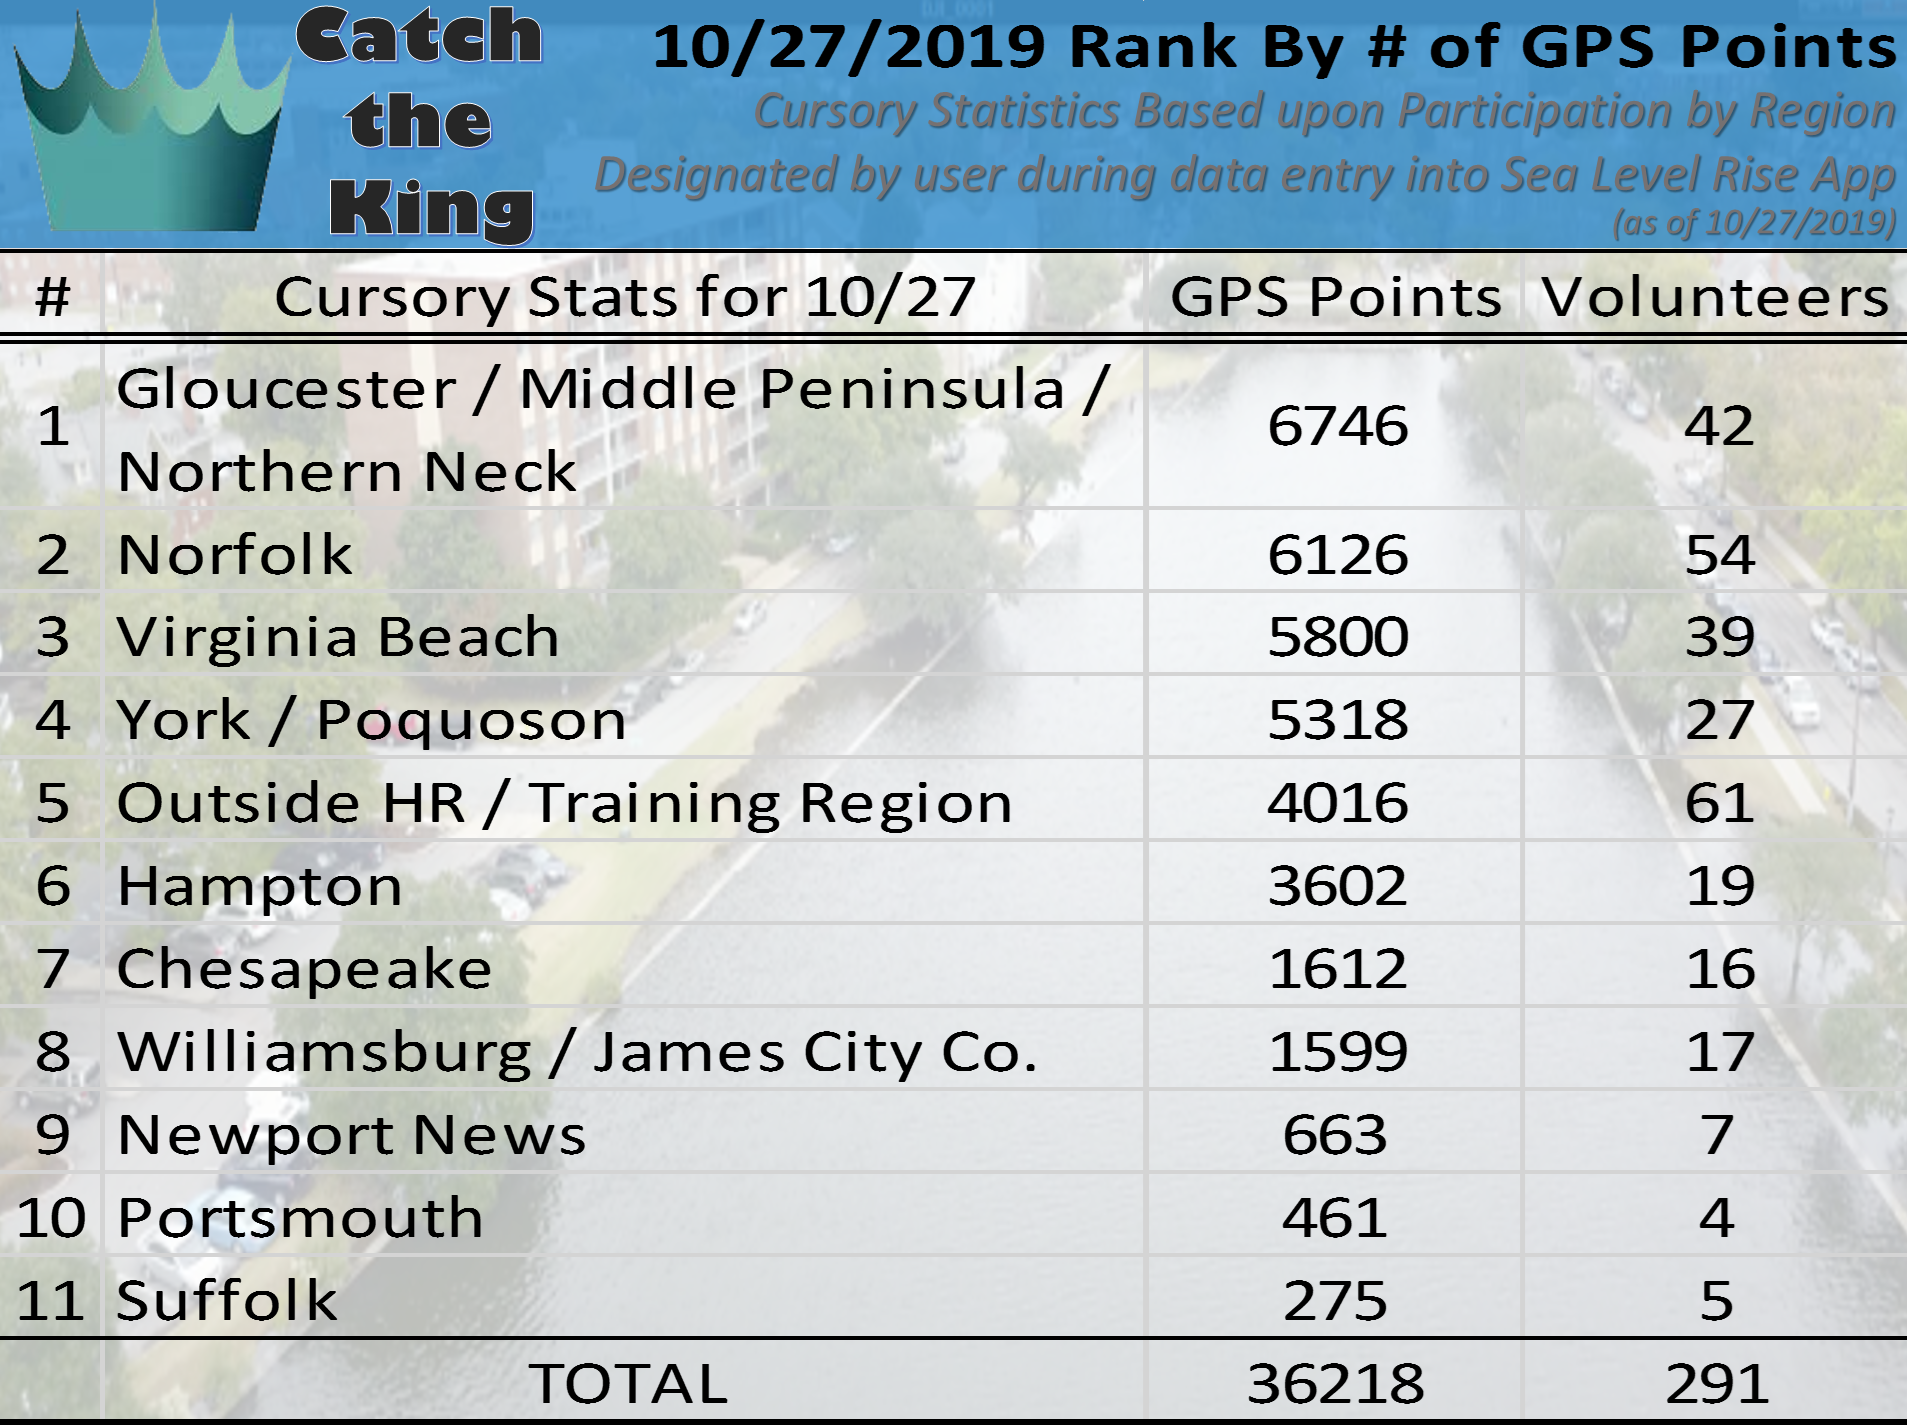
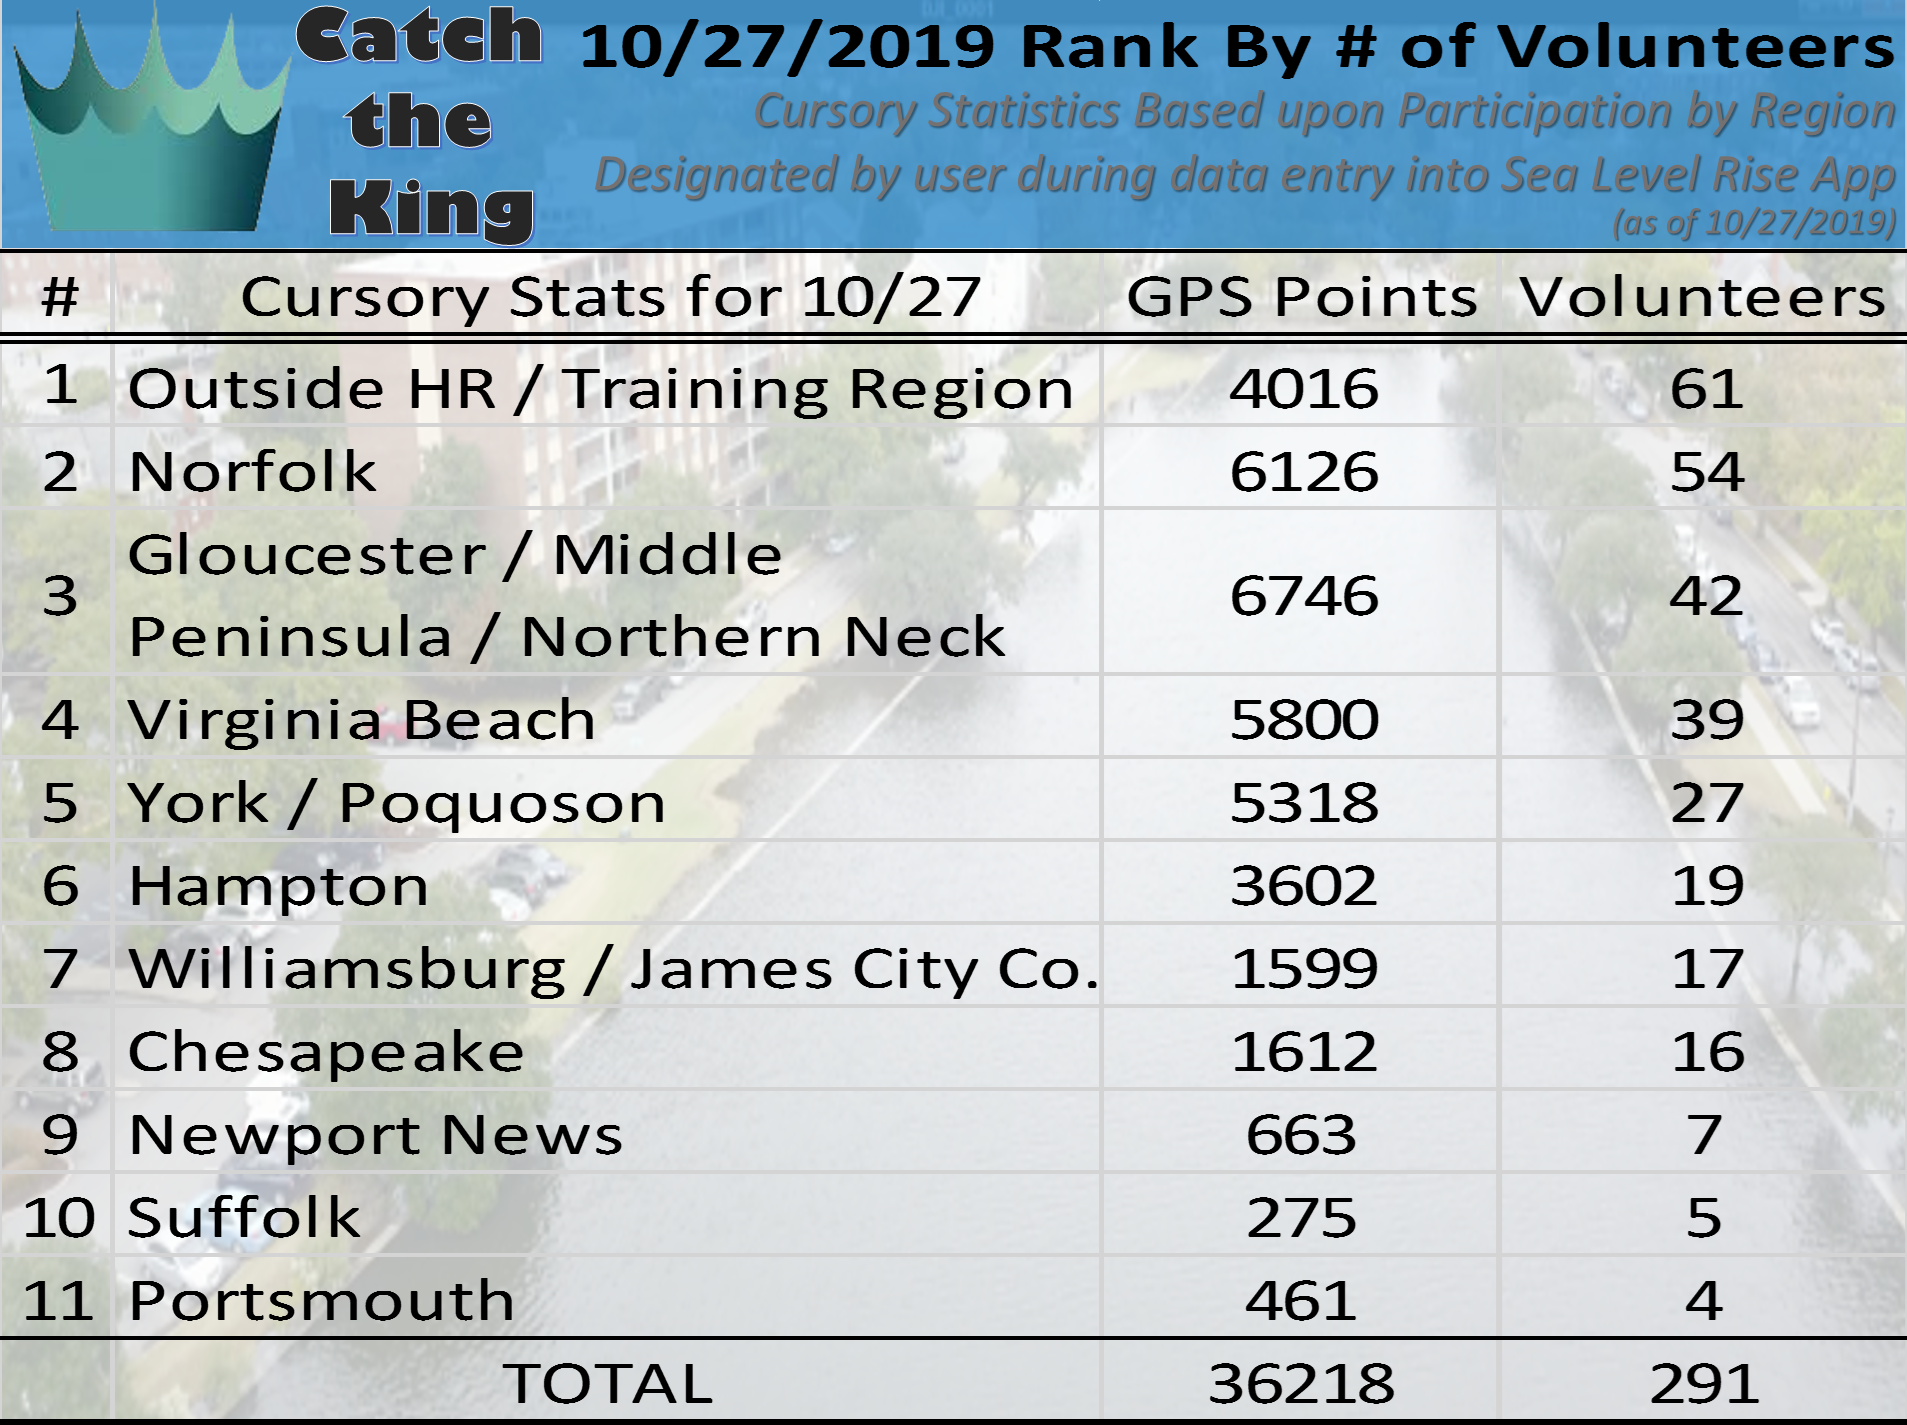
The volunteer breakdown for Catch the King in 2023 revealed that the Northern Neck region of VA collected 3,609 GPS-recorded high water marks among 29 volunteers. Many of our community scientists in this region are Master Naturalists and Master Gardeners, so a special thank you goes out to these groups of diligent volunteers who helped collect data in new places in rural tidewater VA. Volunteers in Norfolk and VA Beach came in a close second/third by collecting ~2275 high water marks each. Thank you to our dedicated volunteers for your help in mapping the king tide this year!
More Information on Catch the King and Sea Level Rise
"Catch the King" is a citizen-science GPS data collection effort centered in Hampton Roads, VA, that seeks to interactively map the King Tide's maximum inundation extents. The goal is to validate and improving predictive model accuracy for future forecasting of increasingly pervasive "nuisance" flooding. Tracking tidal flooding is important, as it gives us a tangible glimpse into the anticipated height of mean tides less than half a century from today. As shown in the interactive plot below, Norfolk in Hampton Roads, VA, has the highest rate of relative SLR acceleration on the US East Coast, as noted in the recent VIMS Report.
View our Volunteer Invitation Story Map for Catch the King:
View Full Story Map in New Window
Interested volunteers can participate in future citizen science collection events by downloading the free "Sea Level Rise" application onto their smartphone, and using the app to trace the high water line from varying locations where they observe inundation. The data will be collected and used to help scientists, educators, and community leaders better understand the risks imposed by the rising tide. To learn more about how the Commonwealth Center for Recurrent Flooding Resiliency is working to help address these issues, visit: http://www.floodingresiliency.org/.
Download Catch the King 2023 Data:
Event data will be publicly posted here (once reviewed and finalized) after Catch the King for interested parties to access and download directly.
Attributions: Volunteers of 'Catch the King' Tide 2022 collected these data using the Sea Level Rise mobile application developed by Wetlands Watch and Concursive, Inc. Catch the King 2023 was sponsored and supported by the Hampton Roads Sanitation District and AECOM, WHRO Public Media, The Virginian-Pilot, the Daily Press, and the CCRFR and orchestrated/managed by Qaren Jacklich and a dedicated team of tide captains and teachers. GPS volunteer data were shared with VIMS for public dissemination via Concursive, Inc. and some schools and volunteers directly.
Suggested citations for this viewer and these data:
Loftis, J.D., Mitchell, M., Schatt, D., Forrest, D.R., Wang, H.V., Mayfield, D., and Stiles, W.A. 2019. Validating an Operational Flood Forecast Model Using Citizen Science in Hampton Roads, VA, USA. Journal of Marine Science and Engineering. 7, 242. URL
Loftis, J.D., Katragadda, S. 2018. Crowdsourcing Hydrocorrection: How Tidewater Virginia Caught the King Tide. ESRI GIS User Conference, UC293 - Citizen Science at Work. San Diego, CA. URL
Simoniello, C., Jencks, J., Lauro, F.M., Loftis, J.D., Weslawski, J.M., Deja, K., Forrest, D.R., Gossett, S., Jeffries, T.C., Jensen, R.M., Kobara, S., Nolan, L., Ostrowski, M., Pounds, D., Roseman, G., Basco, O., Gosselin, S., Reed, A., Wills, P., and Wyatt, D. 2019. Citizen-Science for the Future: Advisory Case Studies From Around the Globe. Frontiers in Marine Science 6, p.225. URL
Loftis, J.D., Mayfield, D., Forrest, D., Stiles, W. 2018. A Geospatial Analysis of +50,000 Citizen-Science collected GPS Flood Extents and Street-Level Hydrodynamic Model Forecasts during the 2017 King Tide in Hampton Roads, VA. MTS/IEEE Oceans 2018 - Charleston, SC. URL