
Research & Advisory Service
Research Sections: Tackling Global Challenges with a Multidisciplinary Approach
Our sections are focused on contemporary problems that the Batten School of Coastal & Marine Sciences & VIMS are—and will continue to be—instrumental in solving. This flexible structure provides space for faculty, staff and students to work together in multidisciplinary teams to solve grand global challenges.
-
Natural Resources
Providing translational science for sustainable management of coastal socio-ecological systems, especially fisheries and aquaculture.
-
Coastal & Ocean Processes
Connecting global trends and local drivers to understand and address environmental change.
-
Ecosystem Health
Connecting physical, chemical, biological and socioeconomic systems to address environmental and community vulnerabilities.
Research Programs
How is the iconic blue crab faring this year? Are striped bass numbers up or down? What about seagrasses? Programs at the Batten School & VIMS—long-term, formalized research collaborations—answer questions of ecological, economic and recreational importance.
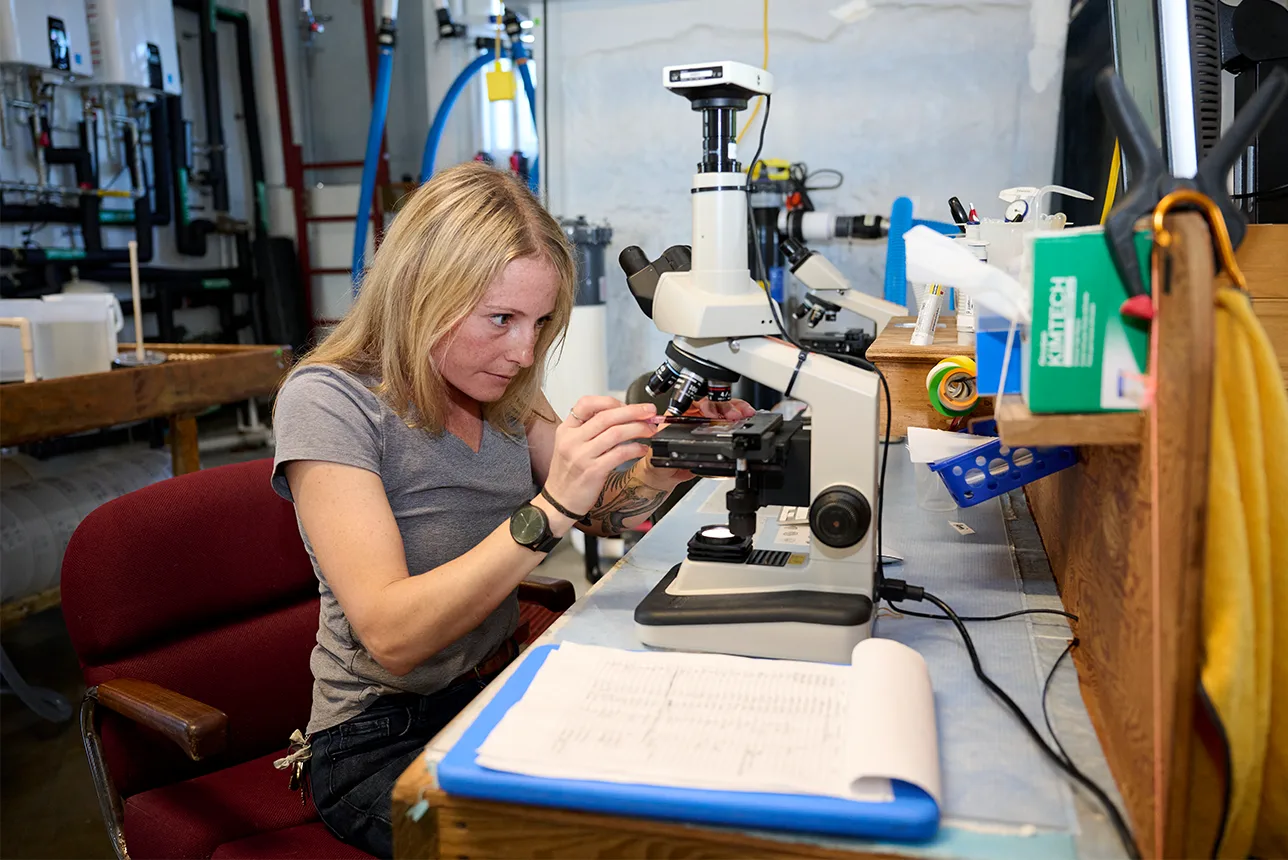
Research Labs
From aquaculture to zooplankton, faculty, staff and students in the Batten School & VIMS' lab groups tackle a wide range of issues in coastal and marine sciences.
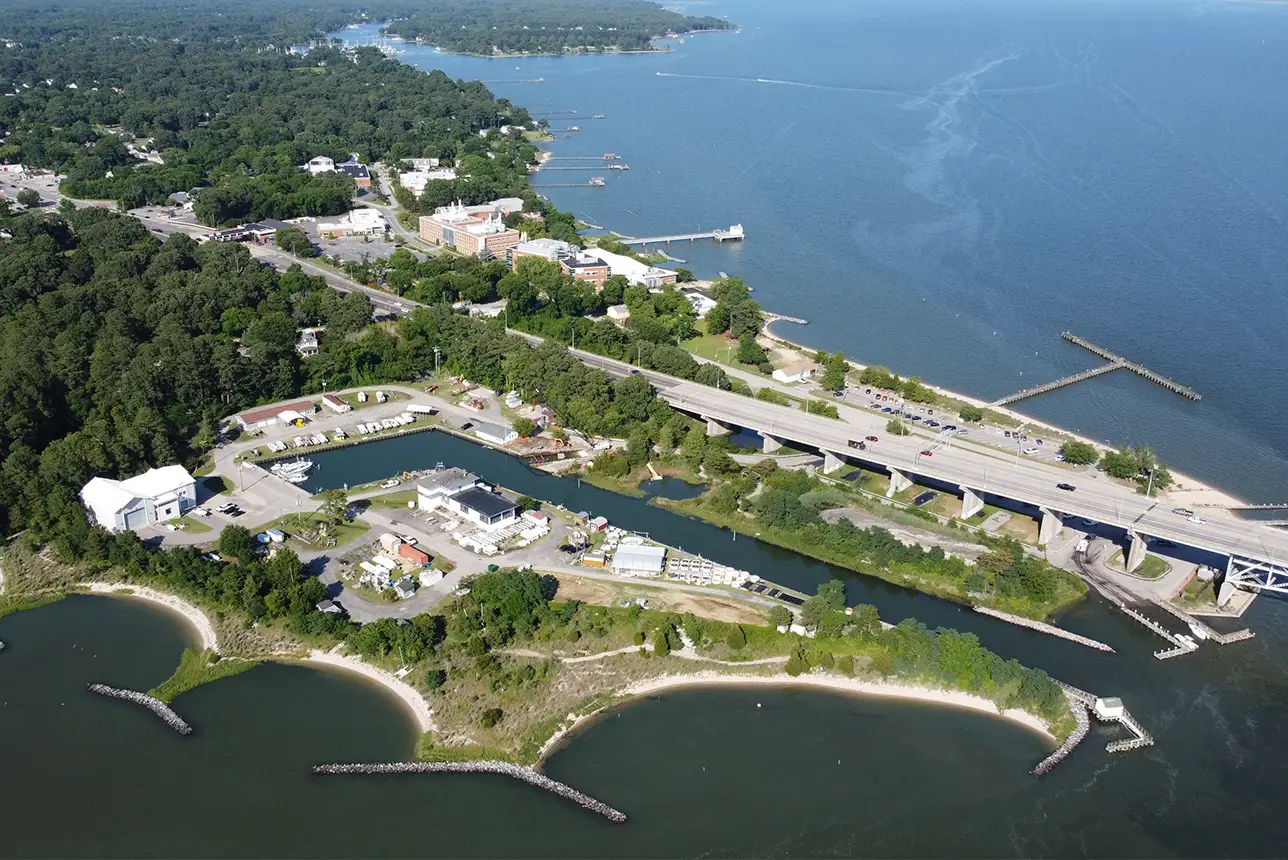
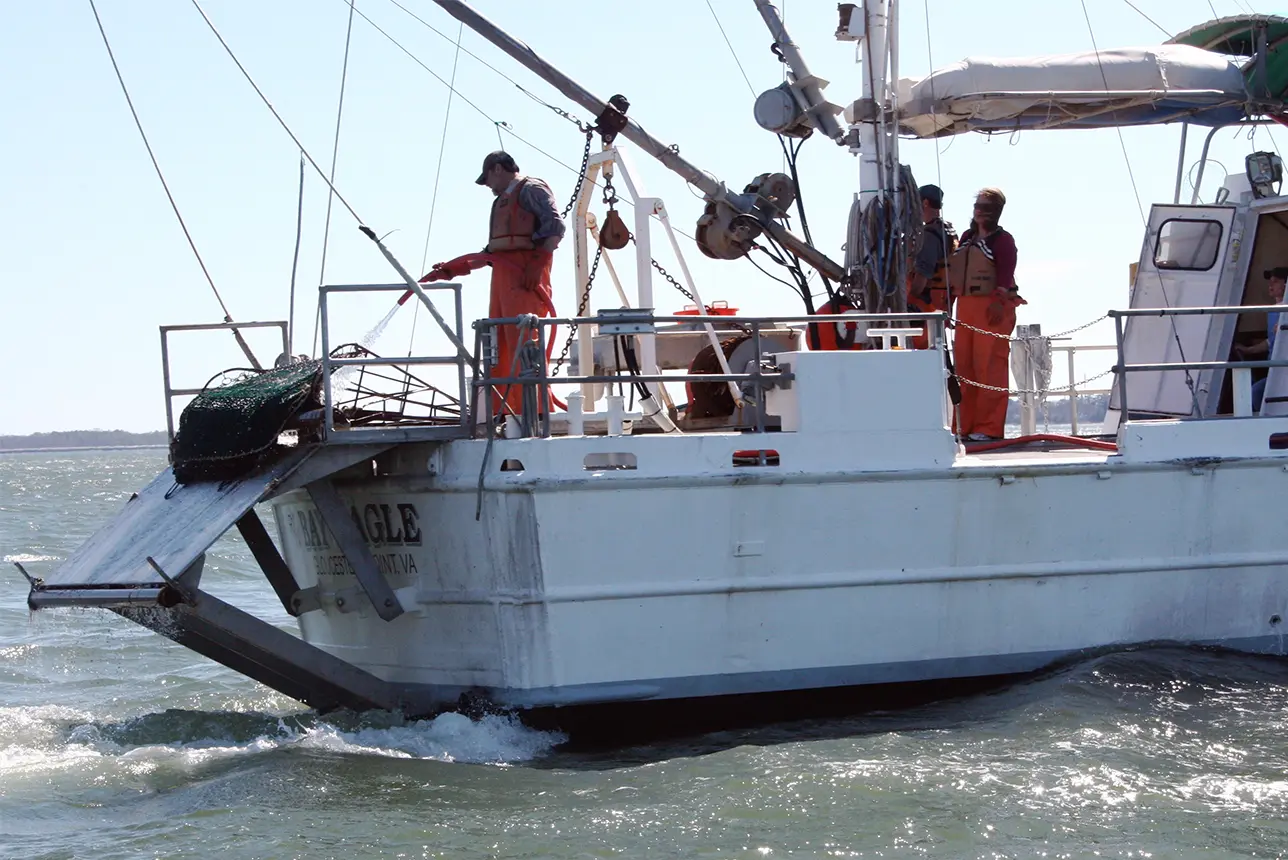
Research Facilities
The Batten School & VIMS maintain a comprehensive suite of research and educational facilities; state-of-the-art analytical instruments and field equipment; and a fleet of both large and small research vessels.
Data Products & Tools
Researchers at the Batten School & VIMS offer a number of data products—including annual forecasts and real-time monitoring tools—for use by individuals, businesses, and government agencies. While most of these products focus on Chesapeake Bay and adjacent coastal and watershed areas, a number also provide value to residents of coastal areas nationwide.
Contact Us
Office of Research & Advisory Services
Address
Watermen's Hall Gloucester Point, VA 23062