Olivia Basco, HRA Class of 2019
About Me
I aspire to be an environmental engineer, and the sea level is rising. Together, these two facts prompted me to start a project inside Hampton, Virginia, that measures the effect of sea level rise on the area. Sea-level rise caused primarily by the Gulf Stream currents, polar ice melting, and land subsidence. My project allows one to learn more about sea-level rise locally for a relatively low cost. The project consists of six flood-monitoring gauges around the city at which everyday citizens or “citizen-scientists” input the altitude measurements of flooding.
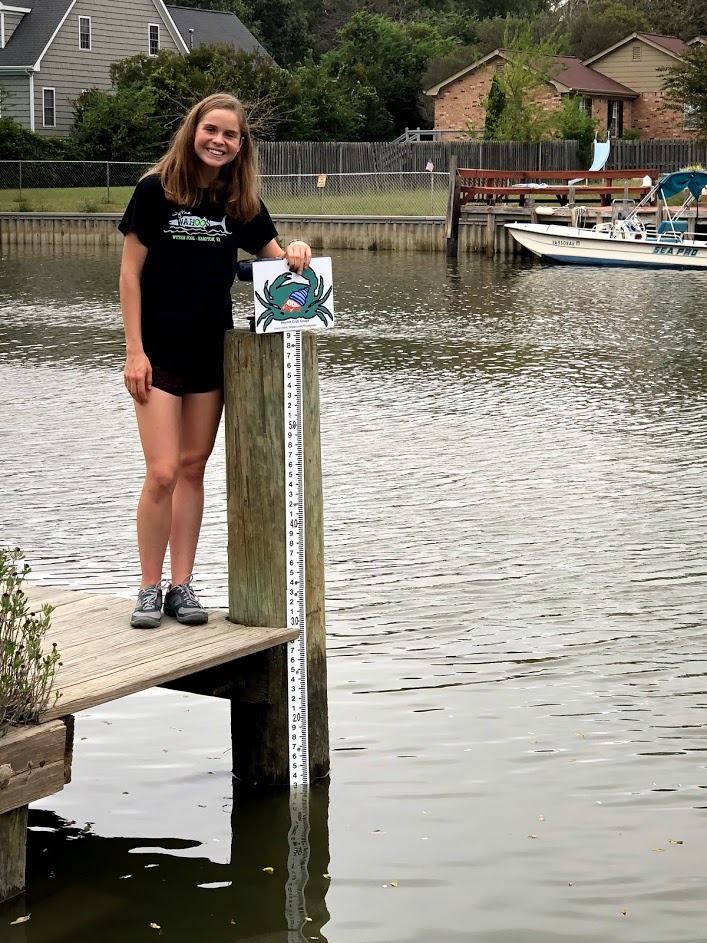
Strategically placed to attract the most participation, each site has a QR code along with simple instructions, a link to learn more, and a crab graphic I designed. Citizen-scientists hold their smartphone cameras up to the QR code in order to be directed to an online form. The online form asks a series of questions: water height (read off the gauge itself), reason for water height (tide conditions, recent storm, etc), a current photo of the gauge, the location (coordinates located on the gauge), the time (automatically sets current time), and any additional comments.
The goal is to allow citizens of Hampton to become more aware about sea-level rise and its impeding effects on our area, to get as many people involved as possible, and to collect altitude measurements of flooding in Hampton. Overtime, all the data is being collected inside a database. Once enough data is collected, a three-dimensional flood map can be created with the altitude measurements and flood mapping data collected through another app, the Sea Level Rise app. In addition, I would like to see how the water depth at each location changes overtime.
This project began last spring with a post on my neighborhood’s blog asking for volunteers to collect tidal data. I responded expressing my interest in environmental science and enthusiasm to learn more by collecting data. The woman who posted the blog put me in contact with Dr. Derek Loftis, a scientist and VIMS and professor at William & Mary. He suggested that I start a project of my own to learn more, get experience, and help my city. At the time, my school was accepting applications for the Hal Tayloe Enrichment Award, a scholarship given to students in order that they can pursue an out-of-school project pertaining to their interests. I was lucky enough to be given the award with a grant of 650$. Dr. Loftis and I wanted to keep the cost relatively low, but still be able to measure the effects of sea-level rise and involve the citizens of Hampton.
After receiving the grant, the project began. Dr. Loftis and I spoke on the phone with two scientists Marygrace Rowe and Christine Voss at UNC, who started a similar project. We asked them questions and gathered any advice they had. Next, we chose six locations to install gauges. We chose locations at which volunteers collect data using the Sea Level Rise app, in public places, and far enough away from other sensors that collect similar data. This ensures that data is collected by citizens and is useful. All of the locations are plotted on an online map found on the link located at each site (tinyurl.com/floodgauge). Then, we ordered six gauges, which are essentially rods that measure feet and inches. The gauges had to be durable, resistant to corrosion and rust, and in the price range. After the gauges arrived, I designed the signs to put with each gauge this includes a crab graphic, a QR code, simple instructions, and a link to learn more. Hampton’s mascot is the crab, so each location is a different type of crab such as the fiddler crab, the blue crab, and the horseshoe crab.
Everything was ready to be installed at this point, but first city approval was needed. This may have been the hardest part of the project consisting of never ending email chains and getting directed back to the same people over and over again; however, everyone was very supportive of the project but unsure of how to advance it. Finally, we were given approval. Shortly after, I bought the hardware needed to install each gauge, and over two days Dr. Loftis and I installed each gauge.
The next step and current step for this project is spreading the word. Hampton’s marketing department was added to the email chain at one point. They invited Dr. Loftis and I on their TV show Round Robin (view the video segment below). Now that the gauges are all installed, I am planning to go to different, local events to give a presentation about my project. Dr. Loftis is nice enough to invite me to many of his events in order to spread the word. In fact, he invited me to a tournament for our region at which engineers, economists, park rangers, and floodplain managers were all put on teams and given environmental situations to create solutions for. I got to join Dr. Loftis on his team, and our team won the tournament! Publicizing my project is one of the most important parts because it runs based off of citizen participation, and the more data collected the more data analysis possible.
Overall, I would like my project to continue providing data for the city of Hampton and rendering its citizens more aware of the rising effects of sea-level rise. From this project, I have learned how much everyone can truly do together. I would have never thought a post on the neighborhood blog would put me in contact with a college professor willing to dedicate many hours to helping me, send me on the city of Hampton’s TV show, allow me to call scientists at UNC, and meet countless other people all willing to help. I am truly grateful for this project and everyone who helped me. Finally, I am excited to get some results!