Researchers create interactive map of bay grasses
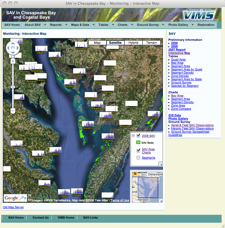
Researchers at the Virginia Institute of Marine Science (VIMS) have created an interactive map that allows web users to see the coverage of underwater grasses in Chesapeake Bay and its tributaries.
The tool, created using Google Maps™ by researchers in the Submerged Aquatic Vegetation (SAV) program at VIMS, is designed to help resource managers, scientists, and citizens better track and visualize bay-grass restoration efforts. It is freely available on-line at web.vims.edu/bio/sav/maps.html.
Underwater grasses serve many essential functions in Chesapeake Bay and other coastal ecosystems. Grasses give critical shelter to young striped bass, blue crabs and other key species; improve water clarity; add oxygen to the water; reduce shoreline erosion; and provide food for over-wintering waterfowl.
Each year, scientists with the SAV program at VIMS conduct an aerial survey and collaborate with colleagues in Virginia and Maryland in field studies of underwater grass coverage in the Bay. This information is used to gauge progress towards the Chesapeake Bay Program’s goal of restoring underwater grasses to 185,000 acres in the Bay and its tidal tributaries by 2010.
Professor Robert “JJ” Orth, head of the SAV program at VIMS, says “We’ve always been interested in providing users with timely access to maps and data for current and past annual surveys. We moved our monitoring reports, maps, and data to our web site early on, but were never fully satisfied with the access speed.”
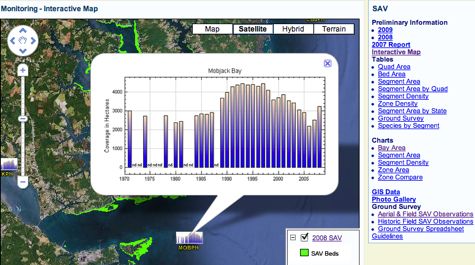
Orth says access to the new map is much faster. In addition, the map displays charts showing the coverage of underwater grasses in particular areas from 1970 until present.
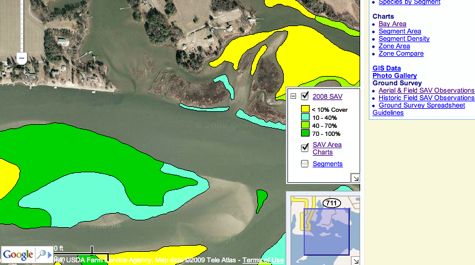
“As you zoom in, the map switches from an overall Bay chart, to zone charts, and finally to individual segment charts,” says Orth. “Zoom in even further, and the green areas denoting SAV coverage resolve into different colors that denote the density of underwater grasses in each bed.” These density data, painstakingly interpreted from aerial photography by program scientists, tell the user whether the grass coverage in a particular bed is sparse, moderately thick, or very thick.
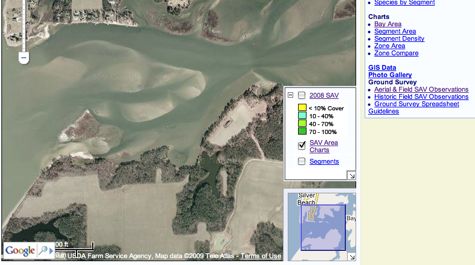
Users can also select what to display on the map, showing or hiding the colored bed areas, choosing between Google Map’s “satellite view” with aerial imagery or “map view” with roads and location names. Users can also choose to show or hide the historical charts and the boundaries of the geographic segments used to report bay-grass coverage.
The map was created using Google Maps and ESRI ArcGIS™ Server by David Wilcox, a geographic information systems analyst in the SAV program at VIMS. In the future. Orth and Wilcox expect to add additional data layers including SAV aerial imagery, historical bed areas, and field observations, along with other enhancements.
Launched in 2005, Google Maps is a free web-mapping service application that powers many map-based services on the web. Google estimates that users spend 1 million hours a day using it and its sister product, Google Earth.