Survey indicates slight decline in underwater grass abundance
Despite record-rainfall in 2018, underwater grass abundance remains strong
An annual survey led by researchers at the Virginia Institute of Marine Science mapped an estimated 91,559 acres of underwater grasses in the Chesapeake Bay and its tidal tributaries in 2019.
While this acreage is less than the previous year, it is likely that substantially more submerged aquatic vegetation (SAV) grew in the Bay than the mapped acreage suggests: frequent rain, cloudy water, and security restrictions prevented researchers from successfully collecting aerial imagery over 22% of the monitored area, including the Potomac River near the Patuxent Air Base; portions of the Susquehanna Flats; Mattaponi, Middle, Choptank, and Honga rivers; and Fishing Bay.
In 2017, these unmapped portions of the Bay supported more than 17,401 acres of grasses. Adding this value to the 2018 estimate would bring the estimated total for 2018 to 108,960 acres—a 4% increase from 2017 levels and a 59% achievement of the Chesapeake Bay Program’s 185,000-acre 2025 goal. The 2017 total was the greatest amount of underwater grasses ever recorded by VIMS’ SAV Monitoring and Restoration Program, and the first time total grass abundance surpassed 100,000 acres. VIMS scientists began monitoring the Bay in 1979.
Underwater bay grasses are critical to the Bay ecosystem.They provide habitat and nursery grounds for fish and blue crabs, serve as food for animals such as turtles and waterfowl, clear the water by reducing wave action, absorb excess nutrients, and reduce shoreline erosion.
Despite the potential decline in acreage, experts are encouraged by the estimated total of 91,559 acres, as it’s likely that the actual expanse of underwater grasses in 2018 fell somewhere between that number and the potential number of 108,960. The growth and survival of underwater grasses are sensitive to the impacts that extreme weather conditions have on Bay water quality. 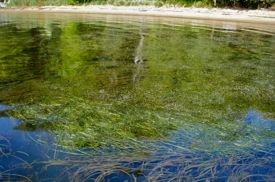 In the past, underwater grass populations have taken several years to recover from the effects of hurricanes or high-temperature events. With the record-breaking rainfall observed in most of the Chesapeake region in 2018, experts were concerned over how the grasses would fare: this slight decrease in underwater grass acreage suggests increasing resilience to such stresses, an indication that the restoration actions taken by the Chesapeake Bay Program and its many partners are working.
Dr. Robert "JJ” Orth, founder and director of the SAV program at VIMS, says “We were all encouraged by the amount of SAV in the Bay in 2018 given the conditions they had to grow and survive in. But the real test now is to see if the beds not only survived, but if they stored enough energy to support their continued growth.”
Brooke Landry, chair of the Chesapeake Bay Program SAV Workgroup, adds, “I’m so relieved to see that our SAV numbers didn’t decline dramatically in 2018... What we need to do now is to double down on our efforts to decrease nutrient and sediment pollution and give our underwater grasses a chance to continue their recovery.”
 Experts credit the presence of widgeon grass in the moderately and very salty regions of the Bay for the steady underwater grass abundance. However, widgeon grass is a “boom and bust” species whose abundance can rise and fall sharply from year to year. A widgeon-grass-dominated spike in one year can be a positive response to good conditions for growth and reproduction while survival between years is sensitive to changes in water quality such as conditions resulting from the impacts of extreme weather events.
Local highlights
Underwater grass abundance can vary from species to species and river to river. In 2018, local highlights included:
- Upper Central Chesapeake Bay: Approximately 272 acres of underwater grasses were observed throughout this region in 2017, and in 2018, this figure rose to more than 457 acres: an increase of 68%. Numerous species of grasses have been found here, including: widgeon grass, redhead grass, sago pondweed, horned pondweed, Eurasian watermilfoil, wild celery, common waterweed, curly pondweed, hydrilla, and coontail.
- Patapsco River: The Patapsco River supported more than 14 acres of grasses in 2017; in 2018, this figure rose to more than 30 acres, an increase of approximately 114%. In the mid-2000s, restoration projects in Shallow Creek at the mouth of the Patapsco River helped contribute to the increase of grasses, which continue to remain steady today.
- Upper Rappahannock River: In 2017, more than 562 acres of grasses were mapped here, and in 2018, that figure rose to 837 acres, an increase of more than 48%. Researchers have found several types of grasses in this portion of the Rappahannock, including coontail, hydrilla, naiads, common waterweed, and wild celery.
- Smith and Tangier Islands: Underwater grass abundance in Tangier Sound increased more than 18% from 2017 to 2018. More than 21,504 acres of grasses were mapped in 2017, while approximately 25,340 acres were noted in 2018. The underwater grasses that stretch from Smith Island to Tangier Island make up the largest contiguous grass bed in the Bay. Widgeon grass dominates the area, but eelgrass can also be found.
Salinity zones
VIMS tracks the abundance of underwater grasses as an indicator of Bay health for the Chesapeake Bay Program, the federal-state partnership established in 1983 to monitor and restore the Bay ecosystem. VIMS researchers estimate the acreage of underwater grasses through aerial surveys flown from late spring to early fall.
For 2018, the VIMS team continued the practice— first introduced in 2013—of categorizing abundance using 4 different salinity zones, which are home to underwater grass communities that respond similarly to storms, drought, and other growing conditions.
Between 2018 and 2019:
- Bay grass abundance in the Bay’s fresh waters (the Tidal Fresh Salinity Zone) fell 819 acres (from 19,903 acres to 19,012 acres).
- Bay grass abundance in the Bay’s slightly salty waters (the Oligohaline Salinity Zone) fell 702 acres (from 8,389 acres to 7,687 acres).
- Bay grass abundance in the Bay’s moderately salty waters (the Mesohaline Salinity Zone) increased 2,931 acres (from 61,350 acres to 64,281 acres).
- Bay grass abundance in the Bay’s very salty waters (the Polyhaline Salinity Zone) rose 2,729 acres (from 15,251 acres to 17,980 acres).
However, the slightly and moderately salty waters, as well as the fresh waters, were not fully mapped in 2018, which indicates a high probability that there were likely more acres of underwater grasses in those areas than measured.
SAV and blue crabs
Bay grass abundance is one of several factors that can impact the health and stability of the blue crab population: the loss of these grasses is a loss of nursery habitat which can increase the crabs' vulnerability by forcing young crabs to gather in the limited nurseries that remain.
Earlier this month, the annual Blue Crab Advisory Report found that the overall Chesapeake Bay blue crab population is not depleted and is not being overfished. The report includes expert analysis of data from the annual Bay-wide winter dredge survey and harvest estimates from recent years. It estimates that the overall blue crab population increased nearly 60% from 372 million in 2018 to 594 million in 2019. The commercial blue crab harvest increased about 9% during the 2018 crabbing season, as commercial operations harvested approximately 59 million pounds of blue crabs from the Bay and its tidal tributaries. Recreational crabbers harvested roughly 3.4 million pounds in 2018, similar to the previous year.
For a closer look at the abundance of underwater grasses in each of the four salinity zones, visit our interactive charts. For full details, visit the SAV home page.