VIMS updates Chesapeake Bay coastal inventory
Decades in the making, online maps offer unique tool for citizens, coastal managers
The Chesapeake Bay shoreline—rife with inlets, necks, and tributaries both large and small—stretches 11,885 miles, longer than the entire west coast of the U.S.
Researchers at the Virginia Institute of Marine Science have just finished the latest iteration of a suite of online maps that can display the condition of the Bay shoreline along its entire length—every beach, breakwater, boathouse, boat ramp, bulkhead, dock, jetty, living shoreline, marina, mud flat, oyster reef, tidal marsh, and tree-lined bank. If that weren’t enough, users of these interactive tools can also view each aquaculture site, conservation easement, oyster lease, and underwater grass bed, as well as a model-based recommendation for maximizing shoreline health at any location.
 Creating and updating these maps requires a hefty investment of time and human resources, one that has paid off in ways both expected and unforeseen. The latest updates combine digital mapping and GPS technology—with researchers from VIMS’ Center for Coastal Resources Management poring over thousands of high-resolution aerial images and motoring in small boats along each and every one of the 62,752,800 feet that comprise the Bay’s Virginia and Maryland shorelines. Their mapping of tidal wetlands began in 1972 and continued until the late 1980s. In 1990, CCRM researchers began mapping shoreline position and conditions. That work wasn’t completed until 2018.
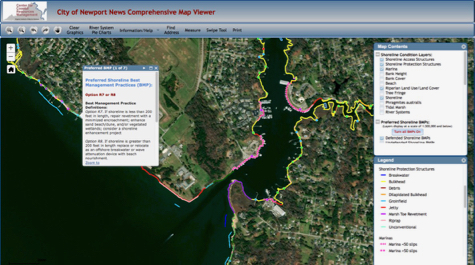
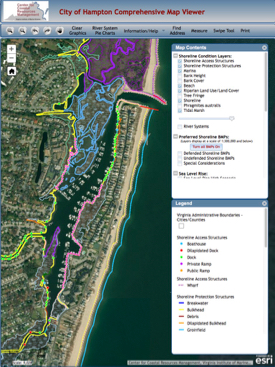
The resulting coastal inventory was the first of its kind worldwide, and now serves as a blueprint for other states with the need for shoreline management. Accessible via web pages for each of Virginia’s 44 coastal localities, these “Comprehensive Coastal Resource Management Portals” or CCRMPs incorporate major changes in mapping technology and the legal landscape during the past 50 years.
Dr. Carl Hershner, CCRM director, says the impetus for the coastal inventories began with the passage of the Tidal Wetlands Act in 1972. Alarmed by widespread dredging and filling of coastal marshes, Virginia’s General Assembly passed the legislation to prevent “despoliation and destruction” of wetlands and “to accommodate necessary economic development in a manner consistent with wetlands preservation.” Passage of Virginia’s Dunes and Beaches Act (1980) and Chesapeake Bay Preservation Act (1988) expanded concern and protection to the Commonwealth’s sandy beaches, bluffs, and coastal uplands.
“In response to the Tidal Wetlands Act,” says Hershner, “the General Assembly directed us to establish and maintain an inventory of tidal wetlands in the Commonwealth, which gave rise to our Tidal Marsh Inventory in the early ‘70s.”
When erosion of the Virginia Beach oceanfront became a major issue in the 1980s, Hershner and colleagues were again called to Richmond to advise legislators on shoreline management. Informed that the state needed an inventory of all its coastal conditions—marsh and beach—the legislature directed VIMS to add a shoreline inventory to its advisory portfolio. CCRM subsequently merged the Tidal Marsh and Shoreline inventories into a Coastal Inventory Program, the entity responsible for creating and updating today’s CCRMPs.
A challenge in mapping
Setting out with the best in 1970’s technology—topographic maps from the U.S. Geological Survey and an optical surveying instrument called a theodolite—the VIMS researchers quickly discovered the enormity of their mapping challenge.
“We did all of a mile and a half in the first year,” says Hershner, “so that clearly wasn’t going to work.” Part of their challenge was that they had to survey not only the shoreline condition—its marsh vegetation for instance—but its actual position. “We were trying to figure out exactly where it was,” says Hershner, “because we knew the USGS topo maps weren’t right, but nobody had anything better. We had high-altitude aerial imagery, but it wasn’t of high-enough resolution to really do a good job at interpreting.”
Luckily for the research team and the Commonwealth, development of the Global Positioning System during the 1980s and ‘90s added a powerful new tool to their mapping tool box. “That’s when all the GPS equipment started coming out,” says Hershner, “and we benefited from every new iteration.”
Marcia Berman joined CCRM in 1989 to direct the mapping of shoreline conditions and update the Tidal Marsh Inventory. “We were the first people at VIMS to really dive into digital mapping with GPS," she says. "We got NOAA to put a real-time base station on the roof of Watermen’s Hall as a triangulation point to make our work more accurate, and developed the first digital record of Virginia’s shoreline.”
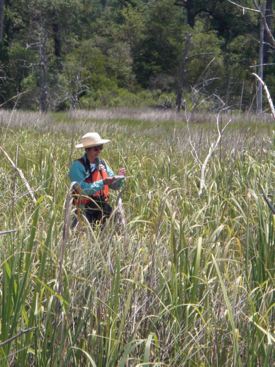
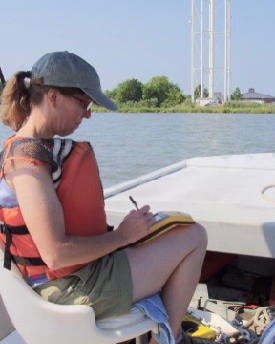
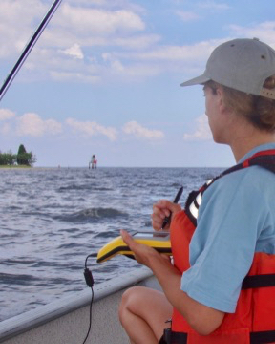
The GPS tools certainly helped, but mapping the Chesapeake Bay shoreline by boat remained a daunting task. While the researchers digitized the shoreline from high-resolution aerial imagery in the laboratory, they recorded characteristics of the shoreline in the field by boat. On a typical day, says Berman, “We would trailer a boat, drive to a ramp and launch, then motor along for 20 or 30 miles." They would always employ at least two people—a pilot and someone to collect all the information relating to the condition of the bank, shoreline structures, and land use. Not surprisingly, they also had many chats with curious property owners.
The pilot would steer the boat as close to the shore as water depth would allow, while the observer clicked one of the new handheld GPS units every few feet to map the shoreline’s many ins and outs. If shallow water, a dock, or other obstruction forced the boat further offshore, the team would have to transfer their line of GPS “bread crumbs” landward to the actual shoreline during digitization.
“The tricky thing,” says Berman, “was that the line you were creating was relative to where the boat was.” A “fancy data dictionary” allowed coding of the observed shoreline condition onto this GPS route-line. Back in the lab, post-processing corrected the boat’s bread-crumb data trail to coincide with the actual digitized shoreline position.
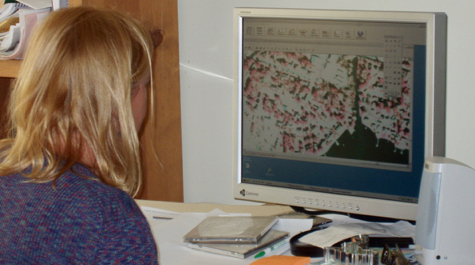
Berman says Sharon Killeen and other CCRM specialists spent as many hours in the lab as in the field. “In the early years,” she says, “they spent thousands of hours at lighted digitizing tables covered with Mylar sheets or aerial photographs, using precision cursors to register GPS coordinates and map tidal wetlands boundaries.”
“Sharon has probably digitized more tidal marshes than anybody ever,” says Berman.
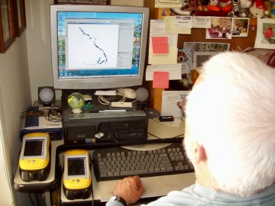
As GPS units continued to improve through the 1980s and ‘90s, so did the quality of aerial imagery. By the mid-2000s, digital imagery had gotten so detailed that it precluded the need for field mapping. “The procedures now are mostly done on the desktop,” says Hershner. “There is a field component, but most of it is done on a computer with aerial imagery, which allows us to get really precise.”
Today’s imagery is so detailed, says Berman, “we can see driveways and cars and sometimes individual boulders. If for some reason you wanted to count the number of rocks in a breakwater you could do it, while back in the early imagery you wouldn't even be able to see the breakwater.”
Inventory value
The shoreline—that narrow boundary between land and water—has long been of high value to humans and wildlife. As coastal populations continue to grow—126 million Americans now live in coastal counties—the shoreline’s value only increases, as do potential conflicts for space and use. Evidence shows that helping to maintain shoreline health and manage resource conflict is where VIMS’ CCRMPs really shine.
Hershner and Berman say that all 44 coastal localities in Virginia regularly use the inventory to make management decisions—for instance, whenever a property owner submits a permit to the local Wetlands Board seeking to build a dock or protect a shoreline, or when a county begins to update its comprehensive plan.
Ian Cheyne, a Master Gardener in Lancaster County, says “We conduct shoreline evaluations for homeowners throughout the Northern Neck and find the site very useful. It’s a great reference for shoreline analysis, best management practices, and the decision trees. The mapping information—property location, shoreline type, current protection, bank height—is a key source of information for preparing an evaluation. It’s also valuable after an evaluation to check on something we might have missed during the visit.”
Maryland was the first external entity to recognize the inventory’s value, contracting with VIMS in 1992 to map all 6,000-plus miles of its Chesapeake Bay shoreline using the techniques and tools developed in Virginia. And VIMS just earned another contract to update priority shoreline areas for its northern neighbor.
The inventory has also become increasingly popular as a blueprint for action at the national level. Says Berman, “We’ve seen recent use by the Navy, NOAA’s Coastal Zone Management program and Environmental Sensitivity Index Atlas, the EPA, the Army Corps of Engineers, the U.S. Geological Survey, the U.S. Fish and Wildlife Service’s National Wetlands Inventory; and by NGOs like The Nature Conservancy."
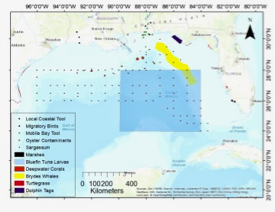 Indeed, Berman is currently partnering with NOAA on a multi-year project in the Gulf of Mexico using an inventory-based model that will soon help guide management action in Texas, Alabama, Louisiana, and Florida; just like it now does in the mid-Atlantic (the inventory approach has also been adopted by localities in Delaware and North Carolina).
“Our model can now give resource managers what we call the best management practice,” says Berman. “We developed it because of Virginia’s policy preference for living shorelines. Because we've got this comprehensive inventory, we’re able to model the best recommendation for a shoreline in the Commonwealth given that we know its bank height, vegetation, and whether it and nearby shorelines are already defended, and how they’re defended. Is there a bulkhead? A revetment? Are there wetlands? Beaches? Our geospatial model recommends what the management practice could be, and it has a preference towards an ecological approach.”