
'Catch the King' on Nov. 6, 2021
Model-Predicted Maximum Flooding Extents for the King Tide on Nov. 6, 2021 from 09:00 AM - 02:59 PM EDT
"Catch the King" is a citizen-science GPS data collection effort centered in Hampton Roads, VA, that seeks to interactively map the King Tide's maximum inundation extents. The goal is to validate and improving predictive model accuracy for future forecasting of increasingly pervasive "nuisance" flooding. The maximum king tide inundation forecast for Nov. 6, 2021 is shown in the map below. It will eventually be accompanied by citizen science GPS high water data points, and active water level sensors in the VIMS Tidewatch Network.
In 2021, Catch the King took place on Saturday, November 6th, during the highest astronomical tide of the year, which was harmonically forecasted to be 3.53 ft. above MLLW at 10:44 AM EDT at Sewells Point in Norfolk, VA. The conditions or rainfall and winds from the Northeast resulted in amplified inundation in north-facing banks of rivers in the Southern Chesapeake Bay.
11/6/2021 - Catch the King Tide Data Map
Map Legend:
![]() - Blue GPS data points will populate this map in real time as volunteers effectively breadcrumb/trace the high water line by pressing the 'Save Data' button in the Sea Level Rise (SLR) App every few steps along the water's edge. These GPS data will be collected during the king tide in the morning on Nov. 6th, 2021. Click on a point to zoom in, disaggregate points, and view timestamps.
- Blue GPS data points will populate this map in real time as volunteers effectively breadcrumb/trace the high water line by pressing the 'Save Data' button in the Sea Level Rise (SLR) App every few steps along the water's edge. These GPS data will be collected during the king tide in the morning on Nov. 6th, 2021. Click on a point to zoom in, disaggregate points, and view timestamps.
![]() - Red points correspond with water level sensors in the NOAA (10), USGS (18), VIMS (2), and StormSense (28) networks, which are aggregated and ingested into VIMS' Tidewatch Forecasting Network. Before Catch the King, forecasts will be displayed; after the event observations and predictions will be displayed and archived at each station location when selected, For Tidewatch Charts, current water level forecast information is available for up to 36-hrs from the present time.
- Red points correspond with water level sensors in the NOAA (10), USGS (18), VIMS (2), and StormSense (28) networks, which are aggregated and ingested into VIMS' Tidewatch Forecasting Network. Before Catch the King, forecasts will be displayed; after the event observations and predictions will be displayed and archived at each station location when selected, For Tidewatch Charts, current water level forecast information is available for up to 36-hrs from the present time.
![]() - The blue flood layer is superposed with satellite imagery on this interactive map represents forecasted maximum flooding extents for the King Tide happening in Hampton Roads on Saturday, 11/06/2021, from 09:00 AM - 02:59 PM EDT, with the Sea Level Rise App data serving as an effective validation of the model's predictions. This layer represented inundation extents predicted by VIMS' models months before the king tide event. These tidal inundation forecast results are then updated days before Catch the King to account for near-term weather-related impacts on the king tide as a comprehensive storm tide forecast using a range of blue hues corresponding with flood depths, and are advised by VIMS' hydrodynamic models and by Tidewatch.
- The blue flood layer is superposed with satellite imagery on this interactive map represents forecasted maximum flooding extents for the King Tide happening in Hampton Roads on Saturday, 11/06/2021, from 09:00 AM - 02:59 PM EDT, with the Sea Level Rise App data serving as an effective validation of the model's predictions. This layer represented inundation extents predicted by VIMS' models months before the king tide event. These tidal inundation forecast results are then updated days before Catch the King to account for near-term weather-related impacts on the king tide as a comprehensive storm tide forecast using a range of blue hues corresponding with flood depths, and are advised by VIMS' hydrodynamic models and by Tidewatch.
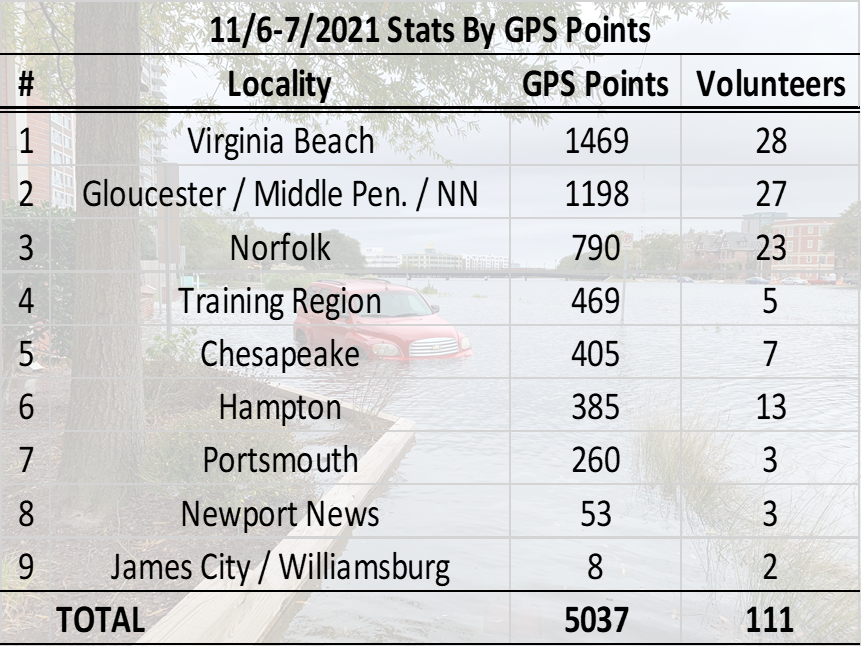
Catch the King saw more than 100 volunteers contribute their data in 2021 on Saturday, November 6th. Citizen Scientists of all ages collected 5,000+ GPS-reported high water marks and collected over 150 pictures through the Sea Level Rise app (not including images shared through the Facebook group). While this represents less volunteers and data than collected in previous years with Catch the King, we are in transition to our new free app, and we are enthusiastic about upcoming opportunities to test it later this year when it comes to an App Store near you.
More Information on Catch the King and Sea Level Rise
"Catch the King" is a citizen-science GPS data collection effort centered in Hampton Roads, VA, that seeks to interactively map the King Tide's maximum inundation extents. The goal is to validate and improving predictive model accuracy for future forecasting of increasingly pervasive "nuisance" flooding. WHRO Public Media's video and audio advertisements for the event played a significant role in been getting out the word about Catch the King 2021. Check out their video!
Tracking tidal flooding is important, as it gives us a tangible glimpse into the anticipated height of mean tides less than half a century from today. As shown in the interactive plot below, Norfolk in Hampton Roads, VA, has the highest rate of relative SLR acceleration on the US East Coast, as noted in the recent VIMS Report.
View our Volunteer Invitation Story Map for Catch the King:
View Full Story Map in New Window
Interested volunteers can participate in future citizen science collection events by downloading the "Sea Level Rise" application onto their smartphone, and using the app to trace the high water line from varying locations where they observe inundation. The data will be collected and used to help scientists, educators, and community leaders better understand the risks imposed by the rising tide. To learn more about how the Commonwealth Center for Recurrent Flooding Resiliency is working to help address these issues, visit: http://www.floodingresiliency.org/.
Download Catch the King 2021 Data:
Event data will be publicly posted here (once reviewed and finalized) after Catch the King for interested parties to access and download directly.
Attributions: Volunteers of 'Catch the King' Tide 2021 collected these data using the Sea Level Rise mobile application developed by Wetlands Watch and Concursive, Inc. Catch the King 2021 was sponsored and supported by the Hampton Roads Sanitation District and AECOM, WHRO Public Media, The Virginian-Pilot, the Daily Press, and the CCRFR and orchestrated/managed by Qaren Jacklich and a dedicated team of tide captains and teachers. GPS volunteer data were shared with VIMS for public dissemination via Concursive, Inc. and some schools and volunteers directly.
View our Comprehensive King Tide Mapping Guide below:
Suggested citations for this viewer and these data:
Loftis, J.D., Mitchell, M., Schatt, D., Forrest, D.R., Wang, H.V., Mayfield, D., and Stiles, W.A. 2019. Validating an Operational Flood Forecast Model Using Citizen Science in Hampton Roads, VA, USA. Journal of Marine Science and Engineering. 7, 242. URL
Loftis, J.D., Katragadda, S. 2018. Crowdsourcing Hydrocorrection: How Tidewater Virginia Caught the King Tide. ESRI GIS User Conference, UC293 - Citizen Science at Work. San Diego, CA. URL
Simoniello, C., Jencks, J., Lauro, F.M., Loftis, J.D., Weslawski, J.M., Deja, K., Forrest, D.R., Gossett, S., Jeffries, T.C., Jensen, R.M., Kobara, S., Nolan, L., Ostrowski, M., Pounds, D., Roseman, G., Basco, O., Gosselin, S., Reed, A., Wills, P., and Wyatt, D. 2019. Citizen-Science for the Future: Advisory Case Studies From Around the Globe. Frontiers in Marine Science 6, p.225. URL
Loftis, J.D., Mayfield, D., Forrest, D., Stiles, W. 2018. A Geospatial Analysis of +50,000 Citizen-Science collected GPS Flood Extents and Street-Level Hydrodynamic Model Forecasts during the 2017 King Tide in Hampton Roads, VA. MTS/IEEE Oceans 2018 - Charleston, SC. URL