
'Catch the King' on Oct. 18, 2020
Model-Predicted Maximum Flooding Extents for the King Tide on Oct. 18, 2020 from 09:00 AM - 02:59 PM EDT
"Catch the King" is a citizen-science GPS data collection effort centered in Hampton Roads, VA, that seeks to interactively map the King Tide's maximum inundation extents. The goal is to validate and improving predictive model accuracy for future forecasting of increasingly pervasive "nuisance" flooding. The maximum king tide inundation forecast for Oct. 18, 2020 is shown in the map below, alongside citizen science GPS high water data points, and active water level sensors in the VIMS Tidewatch Network.
10/18/2020 - Catch the King Tide Data Map
View Full Screen Map in New Window
Map Legend:
![]() - Blue GPS data points will populate this map in real time as volunteers effectively breadcrumb/trace the high water line by pressing the 'Save Data' button in the Sea Level Rise (SLR) App every few steps along the water's edge. These GPS data will be collected during the king tide in the morning on Oct. 18th, 2020. Click on a point to zoom in, disaggregate points, and view timestamps.
- Blue GPS data points will populate this map in real time as volunteers effectively breadcrumb/trace the high water line by pressing the 'Save Data' button in the Sea Level Rise (SLR) App every few steps along the water's edge. These GPS data will be collected during the king tide in the morning on Oct. 18th, 2020. Click on a point to zoom in, disaggregate points, and view timestamps.
![]() - Red points correspond with water level sensors in the NOAA (10), USGS (18), VIMS (2), and StormSense (28) networks, which are aggregated and ingested into VIMS' Tidewatch Forecasting Network. Before Catch the King, forecasts will be displayed; after the event observations and predictions will be displayed and archived at each station location when selected, For Tidewatch Charts, current water level forecast information is available for up to 36-hrs from the present time.
- Red points correspond with water level sensors in the NOAA (10), USGS (18), VIMS (2), and StormSense (28) networks, which are aggregated and ingested into VIMS' Tidewatch Forecasting Network. Before Catch the King, forecasts will be displayed; after the event observations and predictions will be displayed and archived at each station location when selected, For Tidewatch Charts, current water level forecast information is available for up to 36-hrs from the present time.
![]() - The blue flood layer is superposed with satellite imagery on this interactive map represents forecasted maximum flooding extents for the King Tide happening in Hampton Roads on Saturday, 10/18/2020, from 09:00 AM - 02:59 PM EDT, with the Sea Level Rise App data serving as an effective validation of the model's predictions. This layer represented inundation extents predicted by VIMS' models months before the king tide event. These tidal inundation forecast results are then updated days before Catch the King to account for near-term weather-related impacts on the king tide as a comprehensive storm tide forecast using a range of blue hues corresponding with flood depths, and are advised by VIMS' hydrodynamic models and by Tidewatch.
- The blue flood layer is superposed with satellite imagery on this interactive map represents forecasted maximum flooding extents for the King Tide happening in Hampton Roads on Saturday, 10/18/2020, from 09:00 AM - 02:59 PM EDT, with the Sea Level Rise App data serving as an effective validation of the model's predictions. This layer represented inundation extents predicted by VIMS' models months before the king tide event. These tidal inundation forecast results are then updated days before Catch the King to account for near-term weather-related impacts on the king tide as a comprehensive storm tide forecast using a range of blue hues corresponding with flood depths, and are advised by VIMS' hydrodynamic models and by Tidewatch.
2020 Results
Check out our Virtual Volunteer Thank You and Data Review Session from November 12, 2020:
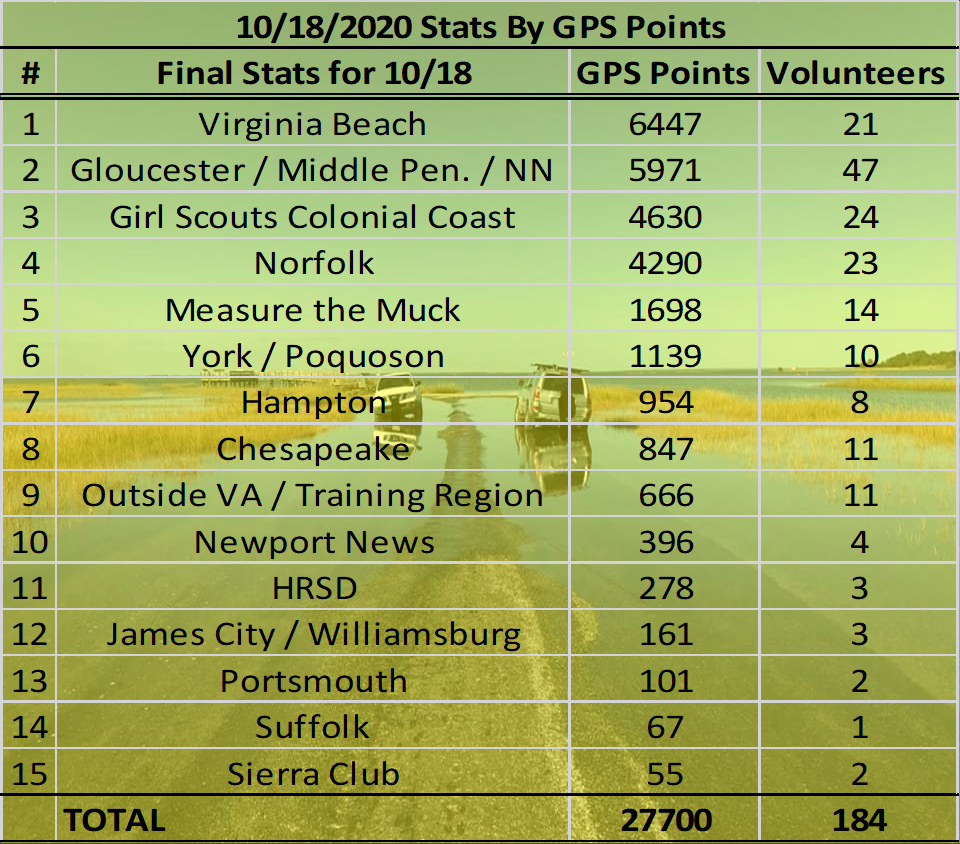
With consideration towards minimizing the spread of COVID-19, like many volunteer programs, Catch the King did not directly engage in any in-person training events at public parks and schools around Hampton Roads, as we have done 25-35 times, annually, in the years past. Instead, training videos were shared via YouTube, and app interface tutorials within the "Help Catch the King Tide" public Facebook Group were leveraged to indierctly engage with our seasoned tide mappers. While this year was not a growth year, over 175 citizen scientists mapped nearly 27,000 high water marks this year, and collected more data in more places across VA's Coastal Plain and new data in many new areas (especially in the Rappahannock and Potomac River Basins).
* Background Picture by Olivia LeaHanne near New Point Comfort Lighthouse, Mathews, VA
We appreciate our many tide mappers, adept tide captains, and avidly involved civic organizations, including the Hampton Roads Sanitation District, Master Naturalists, Master Gardeners, Sierra Club, and many other engaged groups that aided this endeavor this year. A major shout out goes to the Girl Scout Council of Colonial Coast for your vigilance in mapping the king tide in your communities- 24 of you measured 4,630 high water marks!
In 2020, Catch the King took place on Sunday, October 18, during the highest astronomical tide of the year, which was harmonically forecast to be 3.59 ft. above MLLW at 10:53 AM at Sewells Point in Norfolk, VA. In reality, 5 mph NE wind on October 18th coupled with an extra high water level in the prior days leading up to the event amplified the observed water level to 4.13 ft. The water level was slightly higher on Saturday, October 17th at 4.65 ft. at Sewells Point in Norfolk, owing to a sustained wind speed of 15 mph from the NE for over 12 hours.
More Information on Catch the King and Sea Level Rise
"Catch the King" is a citizen-science GPS data collection effort centered in Hampton Roads, VA, that seeks to interactively map the King Tide's maximum inundation extents. The goal is to validate and improving predictive model accuracy for future forecasting of increasingly pervasive "nuisance" flooding. WHRO Public Media's video and audio advertisements for the event played a significant role in been getting out the word about Catch the King 2020. Check out their video!
Tracking tidal flooding is important, as it gives us a tangible glimpse into the anticipated height of mean tides less than half a century from today. As shown in the interactive plot below, Norfolk in Hampton Roads, VA, has the highest rate of relative SLR acceleration on the US East Coast, as noted in the recent VIMS Report.
View our Volunteer Invitation Story Map for Catch the King:
Interested volunteers can participate in future citizen science collection events by downloading the "Sea Level Rise" application onto their smartphone, and using the app to trace the high water line from varying locations where they observe inundation. The data will be collected and used to help scientists, educators, and community leaders better understand the risks imposed by the rising tide. To learn more about how the Commonwealth Center for Recurrent Flooding Resiliency is working to help address these issues, visit: http://www.floodingresiliency.org/.
Download Catch the King 2020 Data:
Event data will be publicly posted here (once reviewed and finalized) after Catch the King for interested parties to access and download directly.
Attributions: Volunteers of 'Catch the King' Tide 2020 collected these data using the Sea Level Rise mobile application developed by Wetlands Watch and Concursive, Inc. Catch the King 2020 was sponsored and supported by the Hampton Roads Sanitation District and AECOM, WHRO Public Media, The Virginian-Pilot, the Daily Press, and the CCRFR and orchestrated/managed by Qaren Jacklich and a dedicated team of tide captains and teachers. GPS volunteer data were shared with VIMS for public dissemination via Concursive, Inc. and some schools and volunteers directly.
View our Comprehensive King Tide Mapping Guide below: