Data Uses
Fisheries data collected by the NEAMAP Nearshore Trawl Survey has been requested by stock assessment scientists and used in a variety of analytical applications. Because of the relatively short time series of abundance data available from this program, however, data users mainly have focused on the incorporation of the biological information collected by this survey to date. Specifically, the National Marine Fisheries Service (NMFS) and/or the Mid-Atlantic FisheryManagement Council (MAFMC) have requested NEAMAP data on bluefish, black sea bass, butterfish, scup, skates (all species) spiny dogfish, summer flounder, and winter flounder. With the exception of butterfish and skates, all of these species are assessed and managed in conjunction with the Atlantic States Marine Fisheries Commission (ASMFC). Besides incorporating data on fishes, NMFS has also requested catch and biological data on Atlantic sea scallop for incorporation into the assessment for this species. In addition to the species listed above, alewife, Atlantic croaker, blueback herring, spot, and weakfish data collected by NEAMAP have been requested by the ASMFC.
In nearly each instance where the incorporation of abundance data was not possible, the assessment scientists expressed their intent to include these data in future assessments (when the time series has become more established). These statements indicate that the lack of inclusion of the NEAMAP abundance data to date is merely a function of the length of the survey history, and not a reflection of the data quality. It is also anticipated that, as this survey continues to develop, the program will begin to support more complex ecosystem-based analyses. The NEAMAP survey design, along with all data collection and processing protocols, were approved through the peer review process in December 2008.
External Uses of Data Generated by the NEAMAP Mid-Atlantic/Southern New England Nearshore Trawl Survey, 2007-2021
Support of Stock-Assessment Activities (NMFS & ASMFC)
Data provided to & incorporated into past assessments
*updated datasets provided as needed (typically annually); data categories below are those
requested by assessment leads
- American lobster – Abundance, distribution, length, & sex
- Atlantic croaker – Abundance, distribution, length, sex, maturity, & age
- Atlantic mackerel – Abundance, distribution, & length
- Atlantic menhaden – Predator diet data for inclusion in ERP assessment; fecundity data
- Atlantic sturgeon – Abundance data for ESA listing and subsequent re-evaluation
- Black sea bass – Abundance, distribution, length, sex, maturity, & age
- Bluefish – Abundance, distribution, length, & age
- Butterfish – Abundance, distribution, length, sex, maturity, & age
- Longfin squid – Abundance, distribution, & length
- River herring (Alewife & Blueback) – Abundance, distribution, length, sex, & maturity
- Scup – Abundance, distribution, length, sex, maturity, & age
- Shortfin squid – Abundance, distribution, & length
- Spot – Abundance, distribution, length, sex, maturity, & age
- Summer flounder – Abundance, distribution, length, sex, maturity, & age
- Weakfish – Abundance, distribution, length, sex, maturity, & age
- Windowpane flounder – Abundance, length, & age
- Winter flounder – Abundance, distribution, length, sex, maturity, & age
Data provided to but not incorporated* into an assessment
*Typically due to short time series of data available relative to benchmark timing, NOT because
of data quality. Will be re-evaluated in next benchmark/research track for each.
- Atlantic sea scallop – Abundance, distribution, & length
- Black drum – Abundance, distribution, length, sex, maturity, & age
- Horseshoe crab – Abundance, distribution, length, sex, & maturity
- Red drum – Abundance, distribution, length, sex, maturity, & age
- Skate complex (Clearnose, Little, & Winter) – Abundance, distribution, & length
- Smooth dogfish – Abundance, distribution, length, sex, & maturity
- Spiny dogfish – Abundance, distribution, length, sex, maturity, & diet
- Striped bass – Length, sex, maturity, & age
- Tautog – Abundance, distribution, length, sex, & maturity
State Conservation Equivalency
- Scup – State of New York
- Summer founder – State of New York & Commonwealth of Virginia
Support of External Research Investigations
Biological Sample Requests
*Collected/conducted at sea to support external institutions
- Boston University - population genetics of little skate.
- Dauphin Island Sea Lab - population genetics of sheepshead.
- Florida State University – satellite tagging of smooth dogfish.
- Georgetown University – neonate spiny dogfish collections to evaluate production of squalamine in support of pediatric medical research.
- NOAA Fisheries - tagging studies on coastal sharks & Atlantic sturgeon.
- Northeast Fisheries Science Center - began recording sex & maturity data on longfin inshore squid at request of Northeast Fisheries Science Center in 2013.
- Northeast Fisheries Science Center – collected yellowtail flounder ovaries for investigation on reproductive biology and fecundity.
- Northeast Fisheries Science Center – developed methods to age windowpane flounder using sectioned otoliths in collaboration with the Northeast Fisheries Science Center.
- Northeast Fisheries Science Center - initiated efforts to quantify the behavior of fishes (e.g., Longfin squid and flatfishes) relative to the NEAMAP trawl.
- Old Dominion University - prevalence and severity of Mycobacterium infection in the coastal migratory population of striped bass.
- Seton Hall University - contaminant analysis of Atlantic menhaden.
- Smithsonian Environmental Research Center –acoustic tagging to investigate movement ecology of several large coastal shark (LCS) and small coastal shark (SCS) species.
- South Carolina Department of Natural Resources - population genetics of Atlantic croaker, black drum, kingfish, & spot.
- Texas A&M University - population genetics northern puffer, northern searobin, striped searobin.
- University of California, Santa Cruz - population genetics of alewife & blueback herring.
- University of Madrid & Cornell University - population genetics of monkfish.
- University of Maryland – diet investigation of black sea bass based on stable isotope analysis.
- University of Maryland - delineation of population structure of bats (the mammals) along the coast.
- Virginia Marine Resources Commission - population genetics of tautog.
- Virginia Marine Resources Commission – supported efforts to quantify black-gill disease and population dynamics in the northern part of this species’ range in collaboration with VMRC and southern institutions.
Data Requests/Collaborations
* NEAMAP Data have been provided to more than 30 external organizations since the inception of the survey
- Atlantic States Marine Fisheries Commission – ageing exchange for alewife & blueback herring; provided age & length data to all partner agencies associated with this exchange.
- Atlantic States Marine Fisheries Commission - ageing exchange for Atlantic croaker & spot; provided age & length data to all partner agencies associated with this exchange.
- Atlantic States Marine Fisheries Commission– ageing exchange for Atlantic menhaden; provided age & length data to all partner agencies associated with this exchange.
- Atlantic States Marine Fisheries Commission - ageing exchange for black sea bass; provided age & length data to all partner agencies associated with this exchange.
- Atlantic States Marine Fisheries Commission – ageing exchange on scup; provided age & length data to all partner agencies associated with this exchange.
- Atlantic States Marine Fisheries Commission – ageing exchange on summer flounder; provided age & length data to all partner agencies associated with this exchange.
- Biodiversity Research Institute - provided catch, distribution, length, & hydrographic data on forage species to support an investigation of seabird foraging ecology in the coastal ocean.
- Block Island Wind Farm, Atlantic Shores Wind, Dominion Wind, Kitty Hawk Wind - provided catch & distribution data on all NEAMAP species to support environmental assessments of these wind lease areas.
- Coonamesset Farm & UMass Dartmouth, School of Marine Science & Technology (SMAST) – provided catch & distribution data on winter flounder to support a bycatch reduction study.
- Georgia Department of Natural Resources – catch, distribution, and hydrographic data associated with invertebrate species to develop a loggerhead sea turtle demographic model.
- Marine Stewardship Council – provided catch, distribution, & length data to support the evaluation of this stock and fishery for certification.
- Maryland Department of Natural Resources – provided data on reproductive stage of striped bass to support an investigation meant to quantify reproductive potential of the coastal migrant population.
- Massachusetts Division of Marine Fisheries - Provided bottom temperature data to enable the agency to complete an investigation of channeled whelk life history.
- Massachusetts Department of Marine Fisheries, Maine Department of Marine Resources, & Northeast Fisheries Science Center - Provided catch and distribution data on several NEAMAP species to identify and quantify possible shifts in species distributions in Northeast waters (data sharing among all partners). Also intend to use these data to evaluate catchability differences among surveys.
- Mid-Atlantic Fishery Management Council – provided catch, distribution, and hydrographic data on scup to support an investigation of the abundance and distribution of this species.
- Mid-Atlantic Fishery Management Council - Provided diet data on all NEAMAP species for which diet data exist to the to support the Forage Amendment/designation of Ecosystem Components process.
- Mid-Atlantic Fishery Management Council - Provided data on several managed species collected by NEAMAP to assist efforts to reclassify Essential Fish Habitat.
- New York Department of Environmental Conservation – catch and distribution of American lobster and horseshoe crab to evaluate range of occupancy and abundance trends.
- NMFS Pascagoula Laboratory– provided catch, distribution, and length data on Atlantic angel shark to support efforts to quantify suitable habitat for this species.
- NMFS Sandy Hook Laboratory – provided catch, distribution, length, and hydrographic data on butterfish to support delineation of preferred habitat.
- Northeast Fisheries Science Center, Apex Predator Program– Provided NEAMAP catch data on coastal sharks for an investigation designed to compare trends in abundance.
- Northeast Fisheries Science Center– provided data on distribution of longfin inshore squid egg ‘mop’ catches to evaluate reproductive timing and distribution.
- Northeast Fisheries Science Center – provided diet data on striped bass to quantify the predatory impact of this species in response to a Congressional inquiry.
- Northeast Fisheries Science Center - Provided catch and length data on all NEAMAP species to support NOAA Northeast Regional Marine Fish Habitat Assessment (NHRA).
- Northeast Fisheries Science Center - Provided catch and length data on all NEAMAP species collected in the vicinity of five Wind Energy Areas to support manuscript development & publication.
- Northeast Fisheries Science Center / Mid-Atlantic Fishery Management Council - Provided indices of abundance on trophic guilds to support the annual Mid-Atlantic State of the Ecosystem reports.
- Northeast Fisheries Science Center / Northeast Regional Council - Provided catch data on all NEAMAP species in support of efforts to quantify fish distributions.
- Northeast Fisheries Science Center & Open Ocean Research – provided catch, distribution, length, and hydrographic data on Illex squid to support an investigation of fishery footprint.
- Rhode Island Department of Environmental Management– Provided catch, distribution, size, and hydrographic data on Jonah & rock crab to support efforts to quantify this relatively new fishery.
- Rutgers University & Northeast Fisheries Science Center – provided catch, distribution, length, and hydrographic data on black sea bass, longfin squid, and spiny dogfish to support development of habitat models for these species.
- Smithsonian Institution– provided catch, distribution, and length data on Atlantic cutlassfish to support investigation of population structure.
- Southeast Area Monitoring & Assessment Program - Expanded diet sampling and data generation to support a coastwide trophic model in collaboration with SEAMAP.
- State University of New York (SUNY) – provided catch, distribution, length, and hydrographic data on summer flounder & black sea bass to support an investigation of habitat use.
- The Nature Conservancy & Rhode Island Department of Environmental Management – provided catch, distribution, length, & hydrographic data on windowpane flounder to support an investigation of the distribution of windowpane flounder in the nearshore waters of Southern New England.
- University of Maryland – provided catch, distribution, length, and diet data on Atlantic menhaden to evaluate ecosystem-based reference points for this species.
- University of Maryland– provided catch, distribution, length, & hydrographic data on forage species to support an investigation of forage resources in the coastal ocean.
- UMass Dartmouth, School of Marine Science & Technology (SMAST) – provided catch and distribution data on windowpane flounder to inform the SMAST Bycatch Avoidance System.
- UMass Dartmouth, School of Marine Science & Technology (SMAST) – provided catch and distribution data on yellowtail flounder to inform the SMAST Bycatch Avoidance System.
- UMass Dartmouth, School of Marine Science & Technology (SMAST) & Cornell Cooperative Extension - Provided data on NEAMAP Trawl Performance to support efforts to develop comparable trawl surveys for wind-lease areas in the Northeast.
- University of New Hampshire – provided alewife & blueback herring catch, distribution, length, and age data to support efforts to improve the assessment of these species.
- University of Rhode Island – provided Atlantic menhaden data to doctoral student to support development of an improved multispecies model for this fishery.
- University of Rhode Island - Provided catch, distribution, and hydrographic data on all NEAMAP species collected in Block Island Sound & Rhode Island Sound to guide efforts related to marine spatial planning. (i.e., Rhode Island Ocean SAMP)
- Virginia Marine Resources Commission & New York Department of Environmental Conservation – provided catch, distribution, and length data on summer flounder to support investigations related to quota reallocation.
- Virginia Marine Resources Commission – ASMFC Compliance Reports for bluefish, scup, black sea bass, and summer flounder.
- Virginia Polytechnic Institute and State University (Virginia Tech) – provided catch, distribution, length, and hydrographic data on weakfish to investigate spatial autocorrelation in trawl survey data.
|


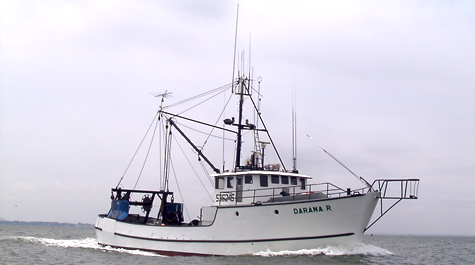 F/V Darana R captained by Jimmy Ruhle
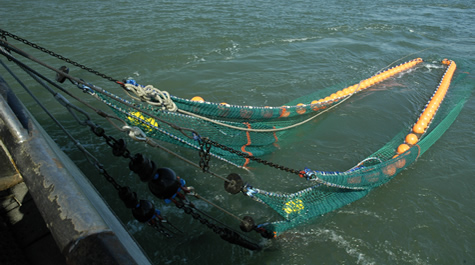 NEAMAP trawl net
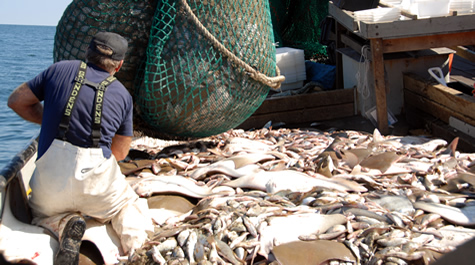 Unloading a large NEAMAP catch
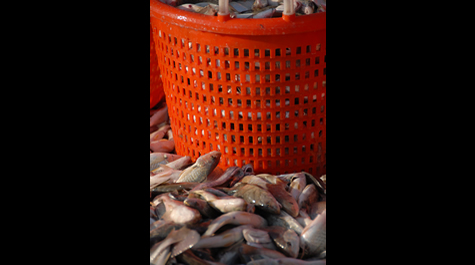 Basket of fish from a NEAMAP tow
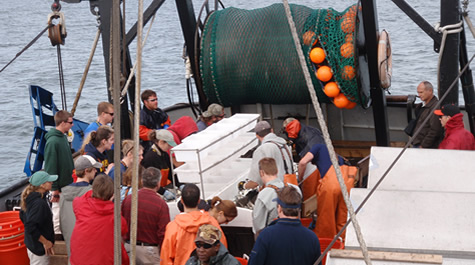 NEAMAP demonstration tow NEAMAP personnel welcome interested parties to participate in short 2-3 hour cruises to experience sampling aboard the F/V Darana R, during the Fall (Sept./Oct.) and Spring (April/May) surveys. Previous demo tows have taken place out of Hampton, VA, Montauk, NY, and Port Judith, RI. If you are interested in participating, please continue to check this page for updated information and contact Jim Gartland at (804) 684-7546, jgartlan@vims.edu, or Chris Bonzek at (804) 684-7291, cfb@vims.edu.


 After the completion of each tow, the catch is sorted by species and modal size groups. For species of management interest, a subsample from each size group i selected for detailed processing. Experience shows that a subsample of 3-5 individuals (3 for very common species, 5 for all others) per species-size group per tow is sufficient for this full processing.
