
2022 Preliminary SAV Executive Summary
The 2022 distribution of submerged aquatic vegetation (SAV) in Chesapeake Bay and its tributaries was mapped from aerial multispectral digital imagery and satellite imagery. The aerial imagery was acquired between May and October 2022, with a resolution of 24 cm, encompassing 180 flight lines.
Due to a number of challenges, additional imagery was acquired from Maxar, Planet Labs, and Spot Image in order to provide a more complete dataset for Chesapeake Bay. These imagery sources and their locations are detailed below:
-
Due to turbid conditions, WorldView 2 satellite imagery acquired from Maxar through the NGA NextView program was used to supplement the aerial imagery for the Susquehanna, Bush, Gunpowder, and Middle rivers, the western shore of Chesapeake Bay from Spesutie Narrows to Back Creek as well as the eastern shore of Chesapeake Bay from the Sassafrass River to Fairlee Creek.
-
Aerial imagery was not acquired for portions of the Potomac River, from Broad Creek to Belmont Bay. WorldView 2 satellite imagery, PlanetScope satellite imagery from Planet Labs, and Pleaides imagery from Spot Image were used to map these areas.
-
WorldView 2 satellite imagery, PlanetScope imagery, and Pleaides imagery were used to supplement our aerial imagery for portions of the Potomac River from Occoquan Bay to Potomac Creek. WorldView 2 satellite imagery was used to supplement our aerial imagery for portions of the Potomac River from Nanjemoy Creek to Wicomoco Creek.
-
WorldView 2 satellite imagery was used to supplement our aerial imagery for portions of the Rappahannock River north of Portobago Bay.
-
Lastly, due to turbid conditions, WorldView 2 satellite imagery was used to supplement our aerial imagery for portions of the eastern shore of Pocomoke Sound from Beasley Bay to Chesconessex Creek.
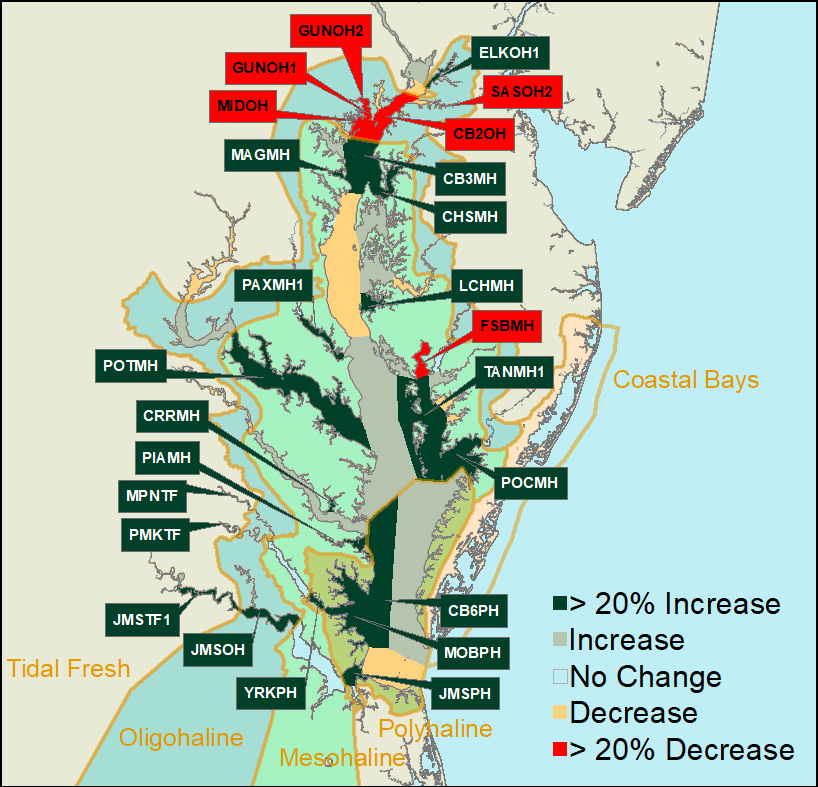
Chesapeake BayFor 2022, 30,942 hectares (76,462 acres) of SAV were mapped in Chesapeake Bay and its tributaries. Although the Chesapeake Bay and its tributaries were fully mapped for 2022, weather conditions prevented acquisition of imagery in 2021 for a portion of the Mattaponi and Pamunkey rivers. In order to ensure a valid analysis of change in SAV distribution and abundance with 2021, all direct comparisons to previous years in this report are restricted to only those regions that were mapped in both years. If a region was not mapped in 2021, comparisons are given using area totals from 2020 instead. The area that was not fully mapped in 2021 supported 27 hectares of SAV in 2020 (66 acres, 0.10% of the Bay total). Notable changes in SAV distribution were measured between 2022 and 2021. SAV increased 12% from 27,528 ha (68,025 ac) to 30,910 ha (76,383 ac) in 2021 in the regions mapped for both years. SAV increased in two salinity zones (Mesohaline, and Polyhaline) and decreased in the other two salinity zones (Tidal Fresh, Oligohaline). In 2022, SAV increased in 42, decreased in 25, and remained unvegetated in 26 of the 93 CBP segments.
[update this]SAV increased in the Mesohaline and Polyhaline zones, where SAV continued to recover from recent declines in some areas. The Mesohaline zone showed a 28% increase from 2021 (2,768 hectares, 6,840 acres), mainly driven by the 1,487 hectare increase in the Tangier Sound segments. The Polyhaline zone showed a 17% increase from 2021 (1,145 hectares, 2,828 acres), including 946 hectares from the Mobjack Bay segment. The Tidal Fresh zone stayed essentially the same with a small decrease (29 hectares, 73 acres) while the Oligohaline zone showed a 15% decrease (501 hectares, 1,239 acres). The increases in the Mesohaline and Polyhaline zone largely reflect recovery following the SAV crash in 2019. Those losses in 2019 were largely due to declines in widgeongrass which is prone to boom and bust cycles of expansion and retraction. For example, in 2018, the Mesohaline and northern Polyhaline salinity zones widgeongrass increased and eelgrass was observed by the survey for the first time in an extensive region east of Tangier Island, but these gains were reversed in 2019. The subsequent decline we observed in 2019 mirrors a similar rapid increase in widgeongrass in 2001 and 2002 that was followed by about a 50% decline in 2003. |
Tidal Fresh Bay Salinity ZoneIn the Tidal Fresh Bay Zone (19 CBP segments), 7,764 hectares (19,185 ac) of SAV were mapped for 2022. However, portions of the Mattaponi and Pamunkey rivers, representing 27 hectares (66 ha, 0.35% of the zone total) were not mapped for 2021. Comparing the same mapped regions between 2021 and 2022, SAV decreased 0.38% from 7,761 hectares (19,179 ac) in 2021 to 7,732 hectares (19,106 ac) in 2022.
Six of the 19 segments remained unvegetated in 2022. |
Oligohaline Bay Salinity ZoneIn the Oligohaline Bay Zone (25 CBP segments), SAV decreased 15% from 3,393 hectares (8,384 ac) in 2021 to 2,891 hectares (7,145 ac) in 2022.
|
Mesohaline Bay Salinity ZoneIn the Mesohaline Bay Salinity Zone (41 CBP segments), SAV increased 28% from 9,749 hectares (24,091 ac) in 2021 to 12,517 hectares (30,932 ac) in 2022.
Thirteeen of the 41 segments remained unvegetated in 2022. |
Polyhaline Bay Salinity ZoneIn the Polyhaline Bay Zone (8 CBP segments), SAV increased 17% from 6,625 ha (16,371 ac) in 2021 to 7,770 ha (19,200 ac) in 2022.
One of the 8 segments remained unvegetated in 2022. |