
High Tides | Sep 26 - Oct 02
Help Us Map Tidal Inundation Extents
Select a Tide Monitoring Site
Determining the estimated time of the king tide's peak at a location near you is made easy by selecting from one of 10 VA Long-Term Tide Sensors or one of 112 VA Tidal Harmonic Prediction Sites.
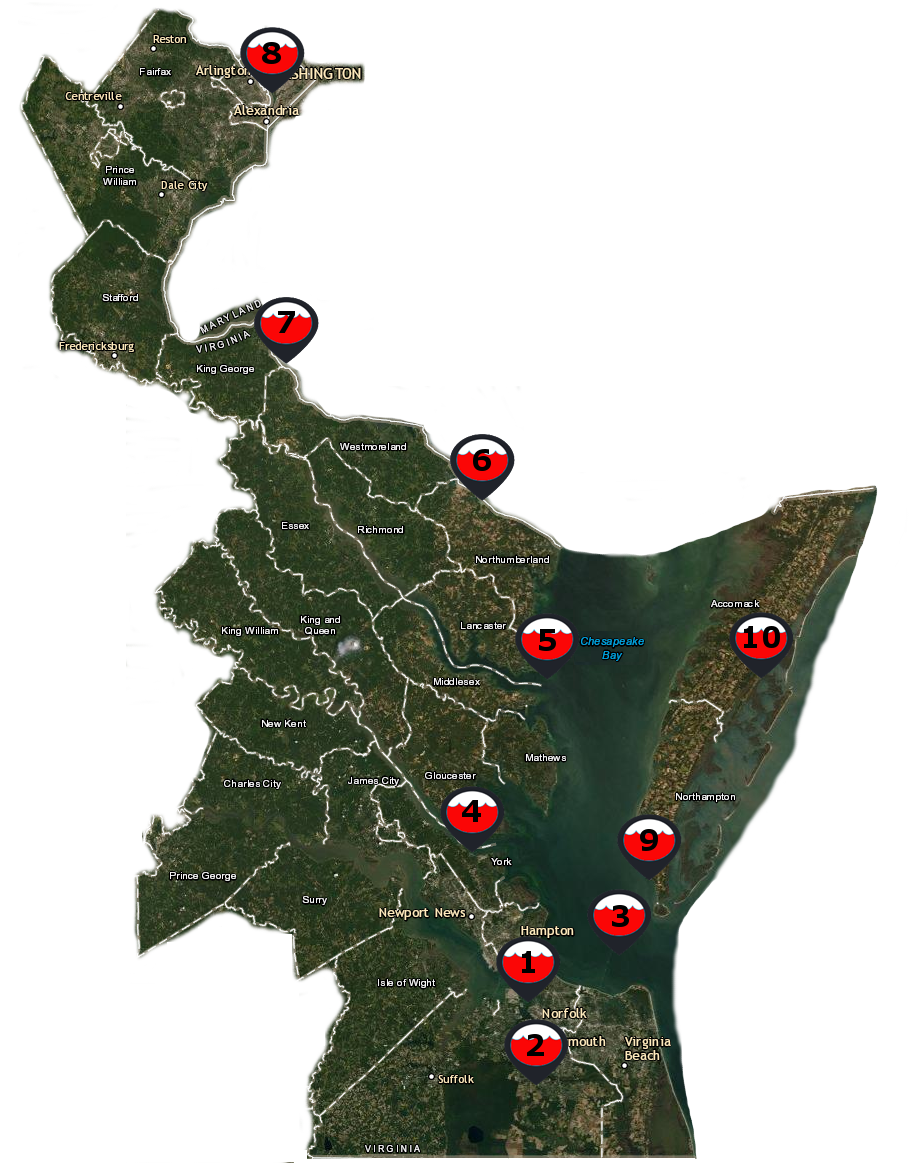
Click on one of the Tide Station Links below to access one of the National Oceanic and Atmospheric Administration's (NOAA) long-range interactive tide prediction charts. NOAA maintains 10 tide monitoring stations in VA. Refer to the map and click on the numbered station in the list below that is nearest to you to view the dates and times for the predicted tidal peaks for your area:
- Sewells Point, VA
- Money Point, VA
- Chesapeake Bay Bridge Tunnel, VA
- Gloucester Point, VA
- Windmill Point, VA
- Lewisetta, VA
- Dahlgren, VA
- Washington, DC
- Kiptopeke, VA
- Wachapreague, VA
Tidal Harmonic Prediction Stations
NOAA's tide predictions are estimated in 2 categories in 112 areas throughout VA, Harmonic and Subordinate.
- Harmonic prediction sites are those with tidal Harmonic constants estimated by models and tidal datums surveyed. Tide predictions for Harmonic sites are generated directly from the Harmonic constants and have higher confidence than nearby "Subordinate" sites.
- Subordinate tidal predictions do not have tidal harmonic constants available. Tide predictions for subordinate sites are generated by referencing high/low tide predictions for a nearby designated harmonic site, and then making time and height adjustments to correct the high/low predictions at the subordinate site.
Select a site on NOAA's map near you to select a site to help map the king tide:
How These Charts Work
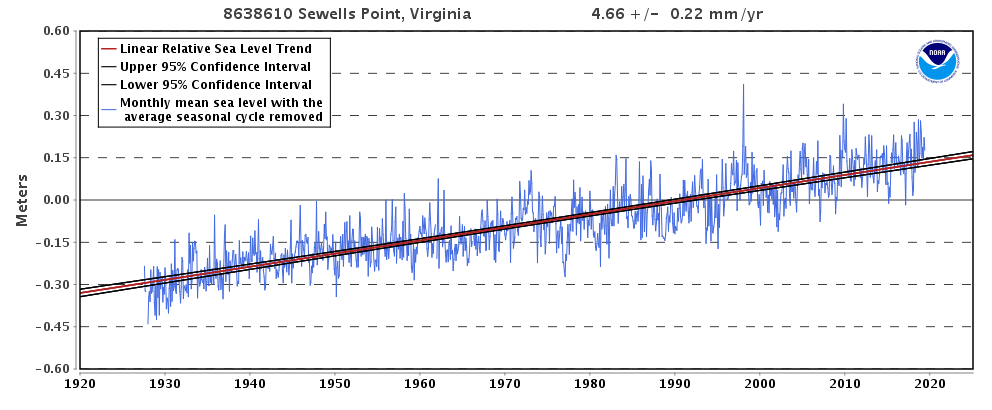
NOAA's tide prediction charts use harmonic analysis prediction algorithms to estimate impacts of tides months, decades, or even centuries in advance. For example, check out this king tide tidal harmonic prediction for Sewells Point, VA, in the year 2100. This prediction method deconstructs the gravitational influences on Earth's oceans by the sun and moon with the assumption that none of these object's orbits are altered. Thus, the 2100 king tide harmonic prediction doesn't seem particularly dramatic because this estimate doesn't account for the 4.66mm/yr average annual increase in sea level NOAA has documented at Sewells Point over the last 90+ years. This represents an increase in eustatic sea level of 1.53 ft. in the past 100 years, and extrapolation of this trend suggests that it will continue to cause sea levels to rise by this much again (at a minimum) by the year 2100!
This increase has been documented by the Intergovernmental Panel on Climate Change and NOAA, and thus it is important to note that NOAA's tidal harmonic predictor doesn't consider that the sea level is rising due to steric expansion of warming oceans, increases in overall ocean volume due to displacement through glacial ice melt, and weather-driven fluctuations in local sea level. To see these effects modeled through NOAA's Sea Level Rise Viewer in Virginia by Sea Level, or to view these Sea Level Scenarios developed by VIMS' CCRM by year, click these URLs to view one of these geospatial flood maps.
Furthermore, ocean dynamics attributed to changes in the gulf stream and land subsidence due to groundwater withdrawal and settling of non-terrigenous materials in the Chesapeake Bay impact crater have been shown in a recent VIMS report to have significantly changed the rate of sea level rise since 1969 to reveal a significantly accelerating (non-linear) quadratic curve for recent sea levels in Virginia. This curve shows a projected increase in mean sea level since 1992 of .175 m (0.56 ft.) so far, and projects an increase in 1.6 ft. by 2050, a trend representing nearly double the rate previously quoted by the year 2100!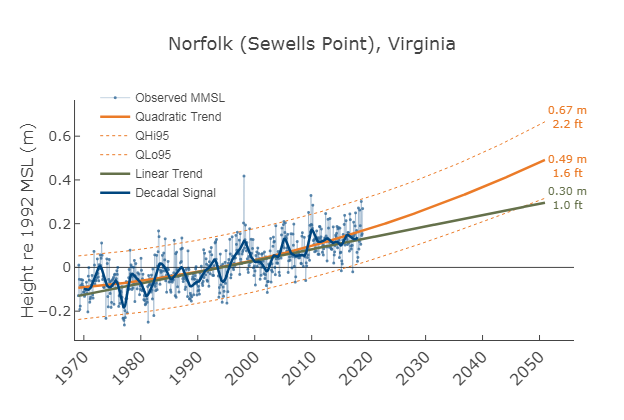
Thus, mapping Virginia's tidal extremes helps to validate VIMS' flood forecast models in the Commonwealth while providing a unique annual data set of flood monitoring data. More data aids in improving models for far-term sea level rise, near-term hydrodynamic models for flooding, and geospatial models for traffic interruptions due to tidal conditions. You can register to volunteer for this year's Catch the King mapping events through WHRO!
NOAA Tidal Projections for September 2019 High Tides (by Station)
1. Sewells Point | Central Hampton Roads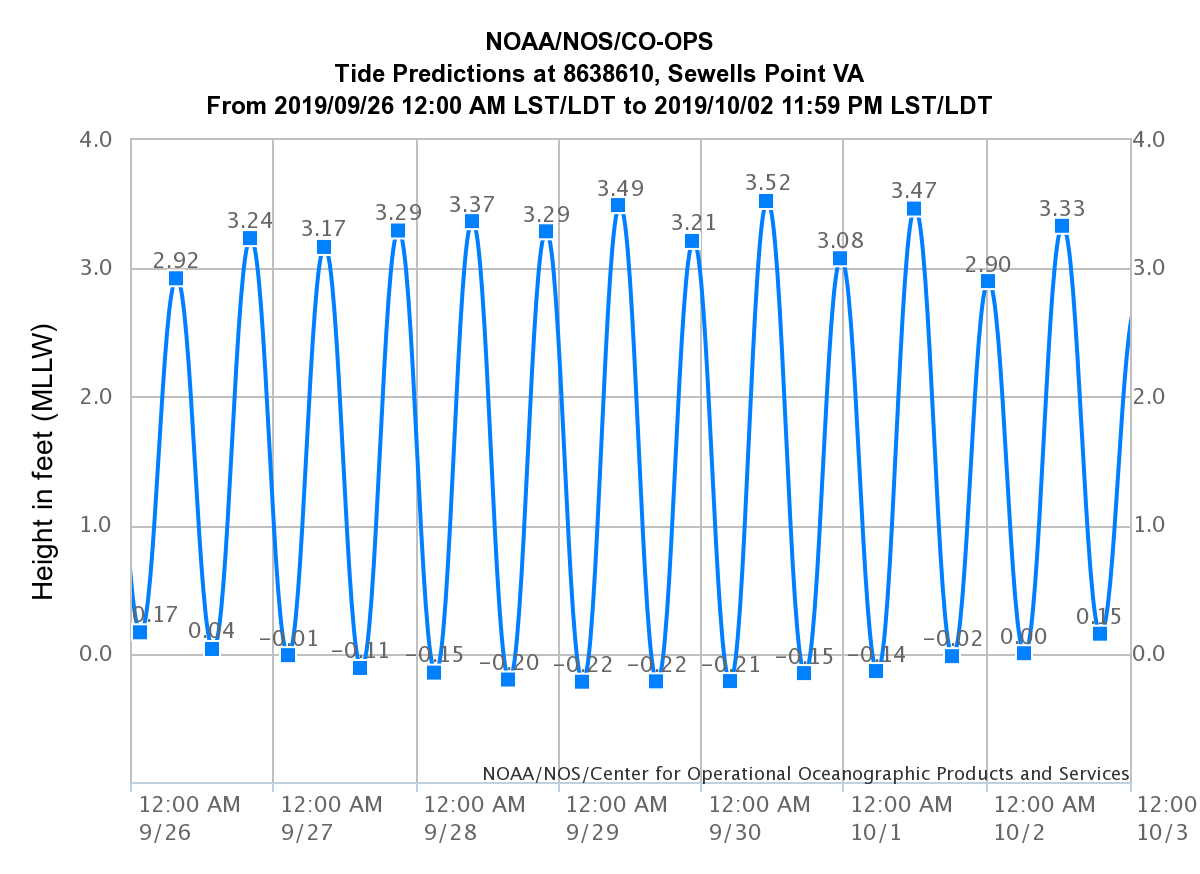
Click on the chart to view the dates and times for the predicted peak tides for this site. If it is within 36 hours in advance of these tidal peaks, you can view the Tidewatch Chart for this station with wind-driven surge guidance included in the forecast.
2. Money Point | Southern Hampton Roads
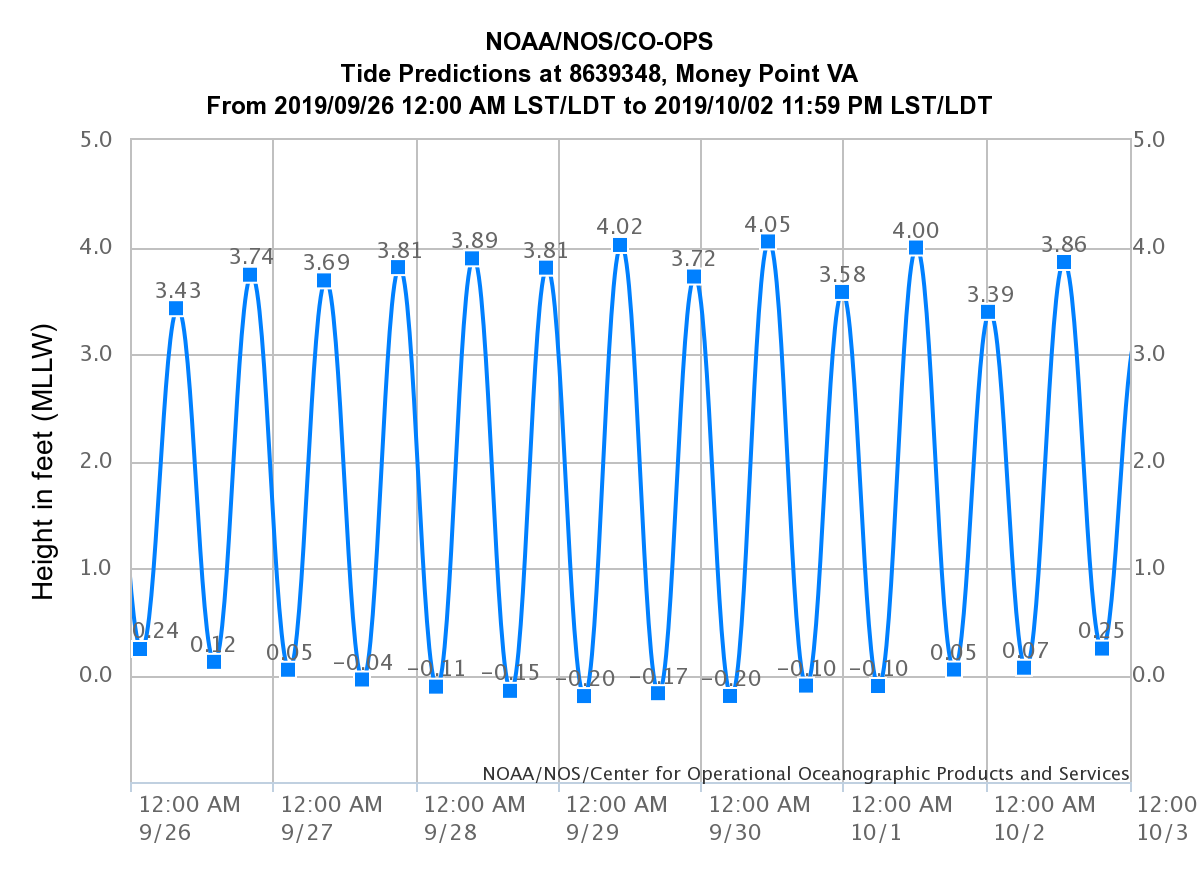
Click on the chart to view the dates and times for the predicted peak tides for this site. If it is within 36 hours in advance of these tidal peaks, you can view the Tidewatch Chart for this station with wind-driven surge guidance included in the forecast.
3. Chesapeake Bay Bridge Tunnel | Eastern Hampton Roads
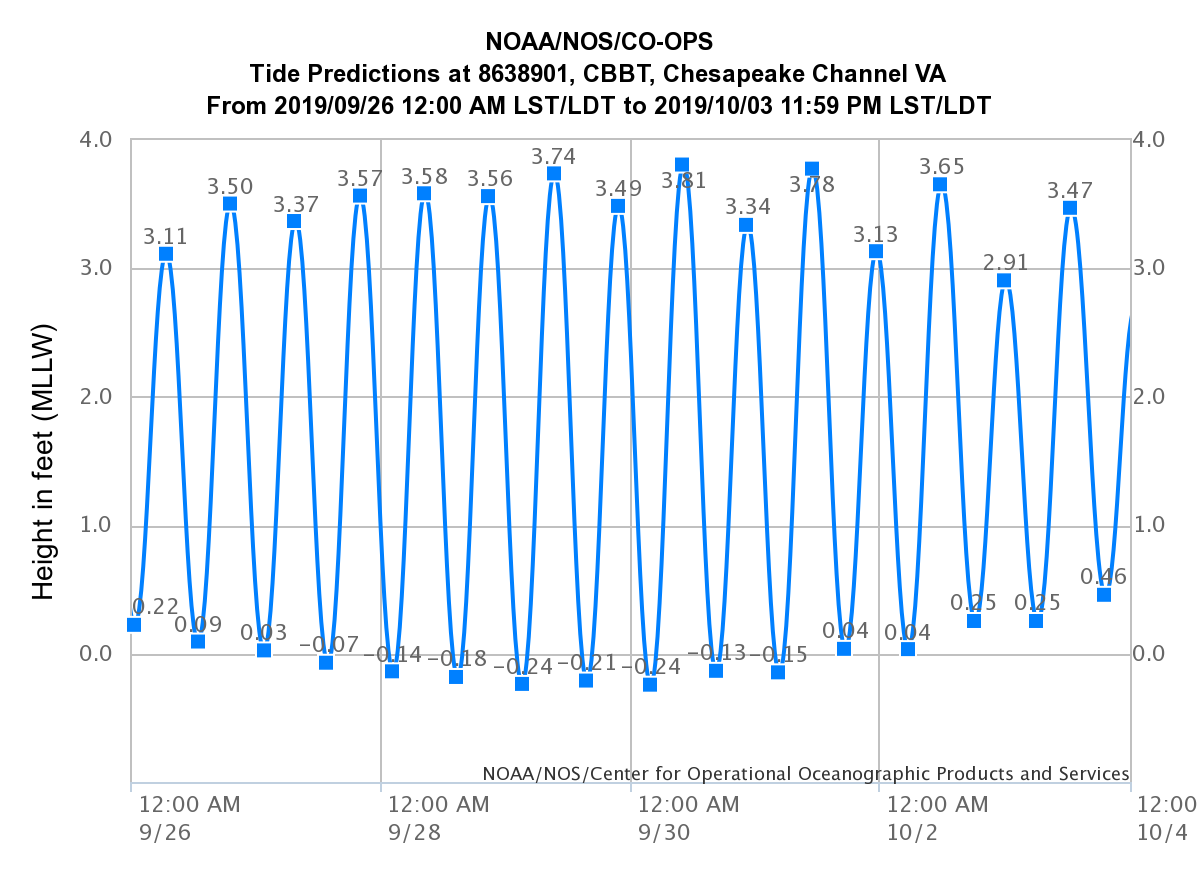
Click on the chart to view the dates and times for the predicted peak tides for this site. If it is within 36 hours in advance of these tidal peaks, you can view the Tidewatch Chart for this station with wind-driven surge guidance included in the forecast.
4. Gloucester Point / Yorktown USCG | Northern Hampton Roads
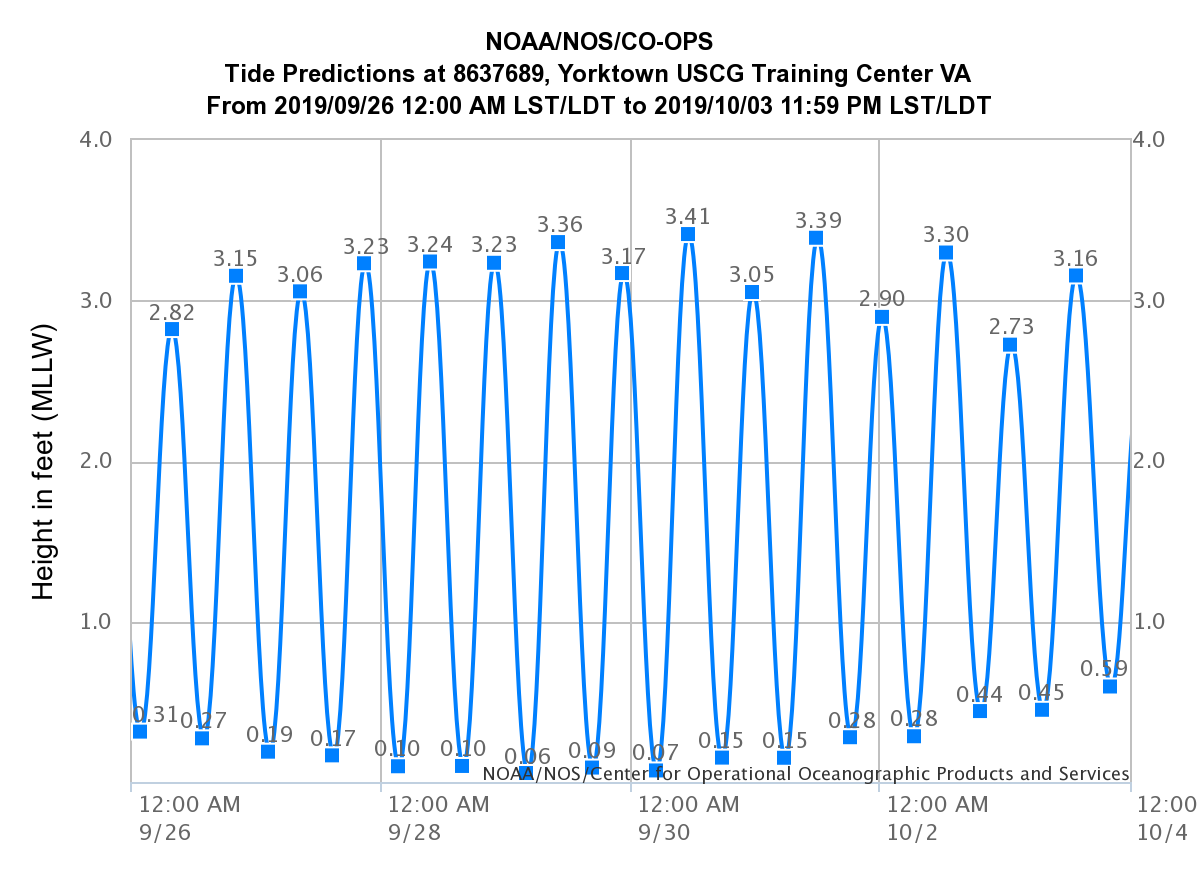
Click on the chart to view the dates and times for the predicted peak tides for this site. If it is within 36 hours in advance of these tidal peaks, you can view the Tidewatch Chart for this station with wind-driven surge guidance included in the forecast.
5. Windmill Point | Middle Peninsula / Rappahannock River Mouth
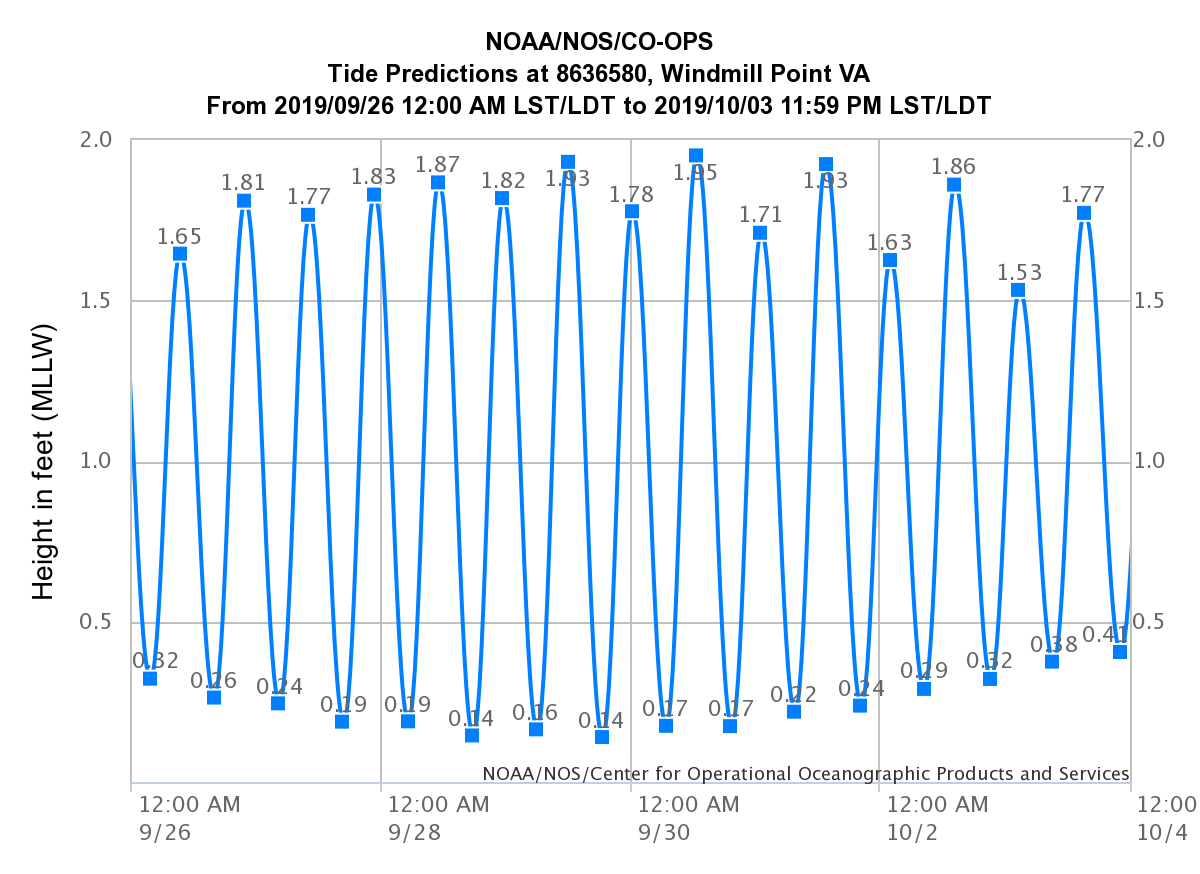
Click on the chart to view the dates and times for the predicted peak tides for this site. If it is within 36 hours in advance of these tidal peaks, you can view the Tidewatch Chart for this station with wind-driven surge guidance included in the forecast.
6. Lewisetta | Northern Neck / Potomac River Mouth
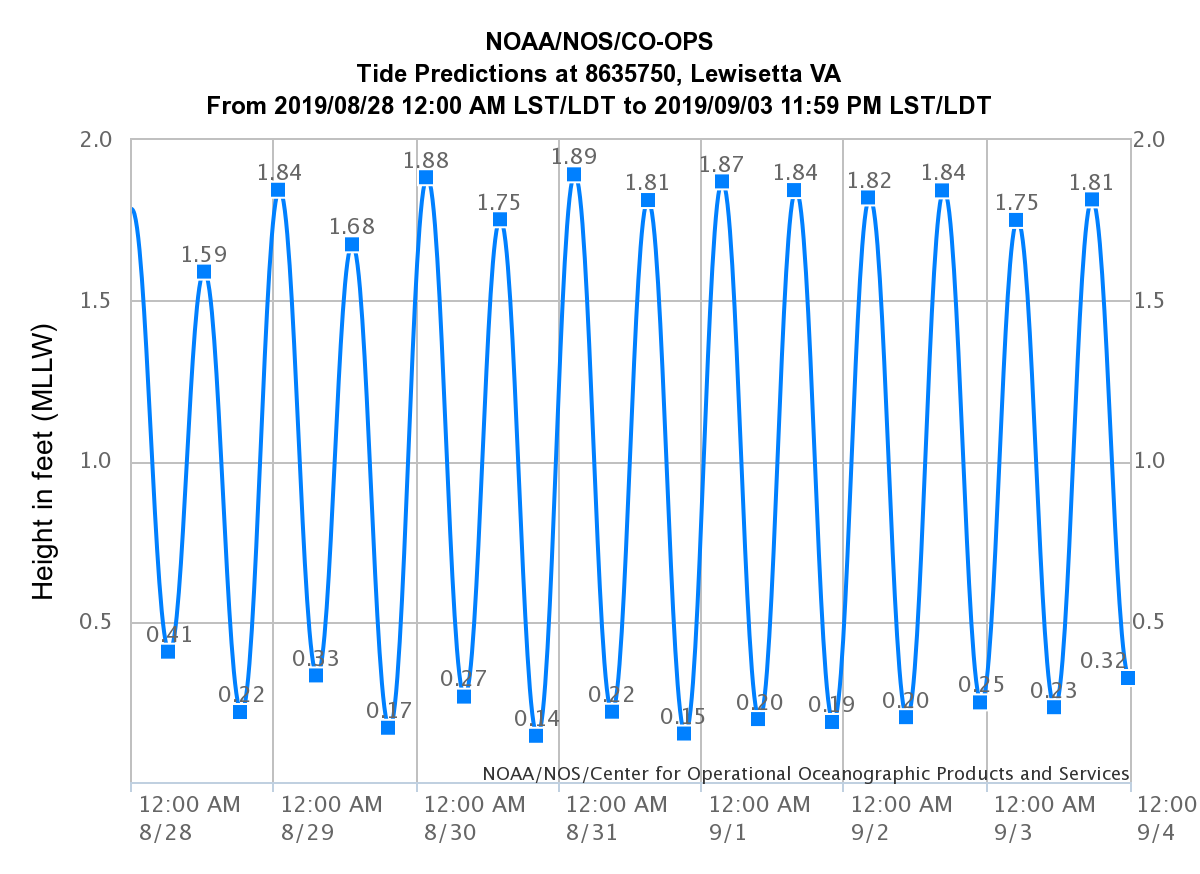
Click on the chart to view the dates and times for the predicted peak tides for this site. If it is within 36 hours in advance of these tidal peaks, you can view the Tidewatch Chart for this station with wind-driven surge guidance included in the forecast.
7. Dahlgren | Northern Neck / Central Tidal Potomac
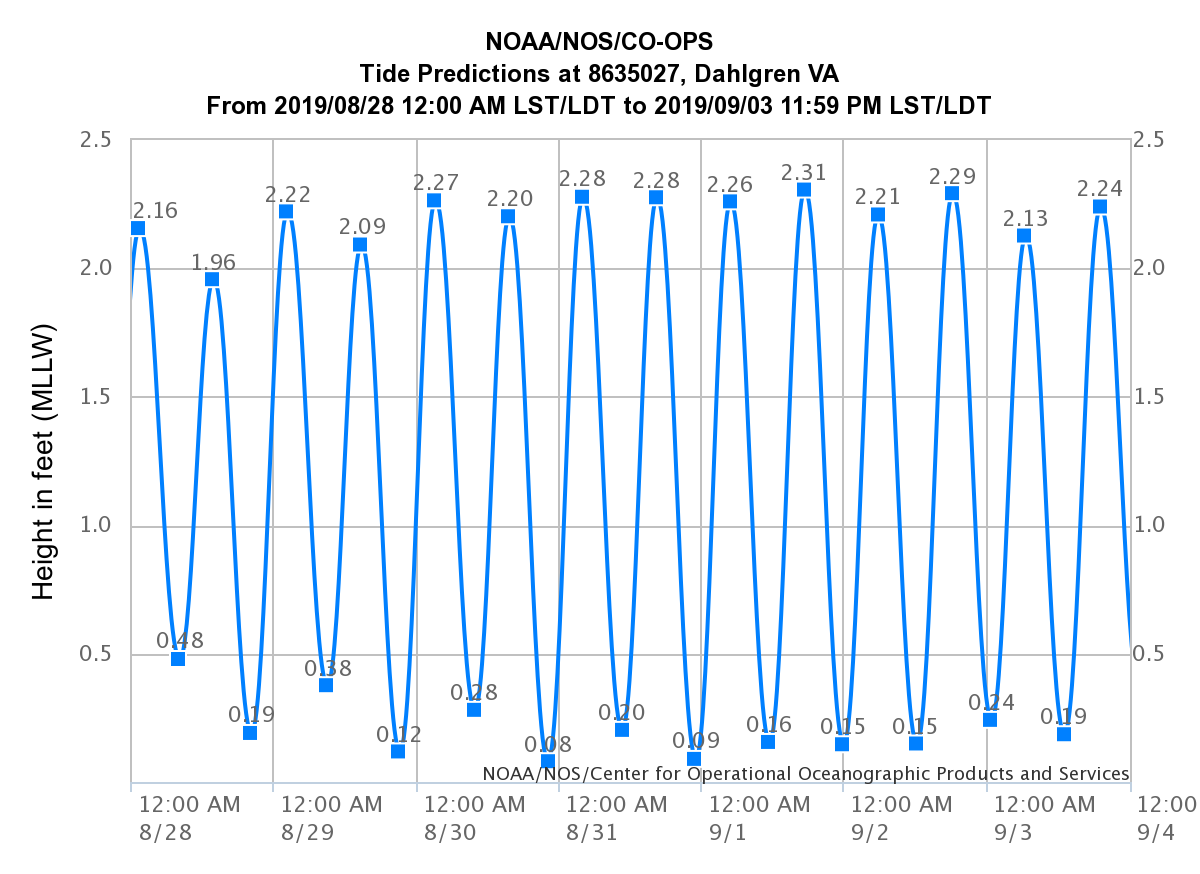
Click on the chart to view the dates and times for the predicted peak tides for this site.
8. Washington DC | Northern Tidal Potomac / Alexandria & Arlington
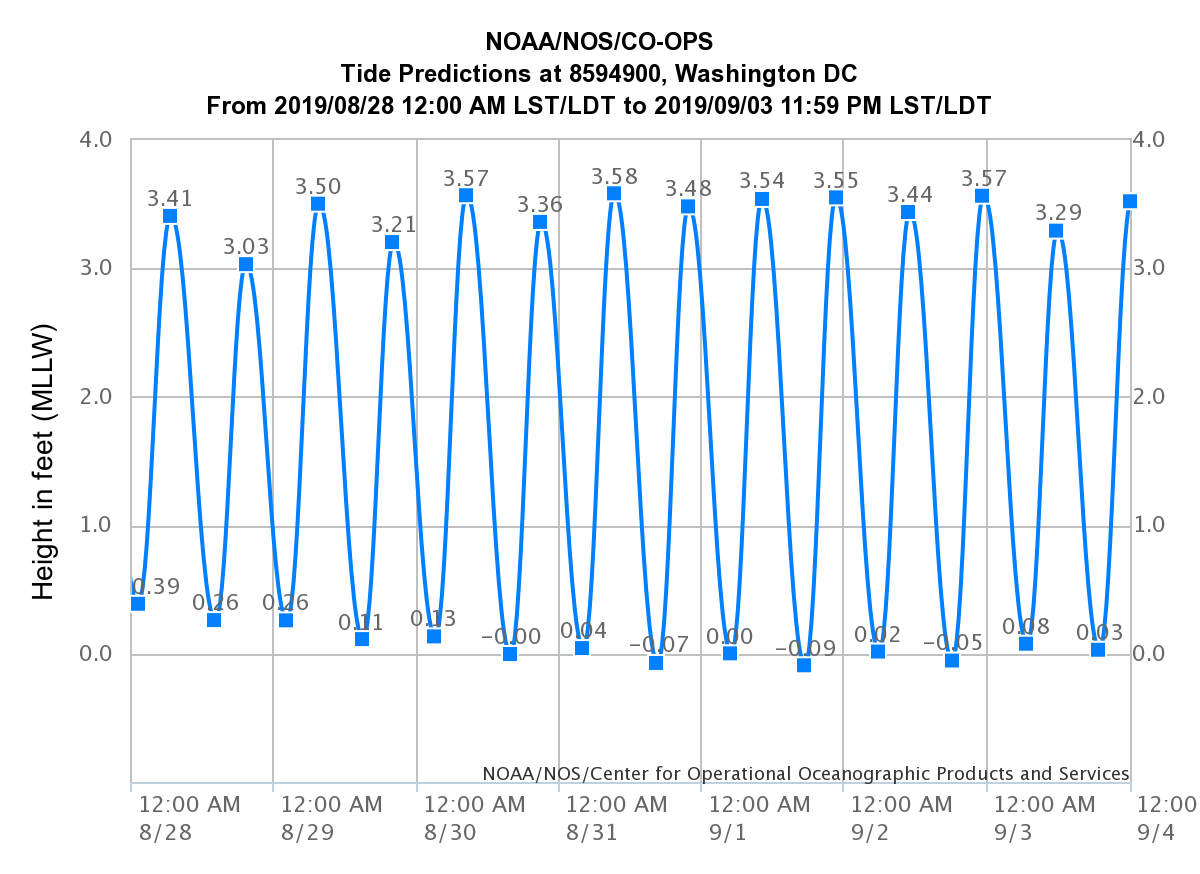
Click on the chart to view the dates and times for the predicted peak tides for this site.
9. Kiptopeke | VA Eastern Shore Southwestern Bank
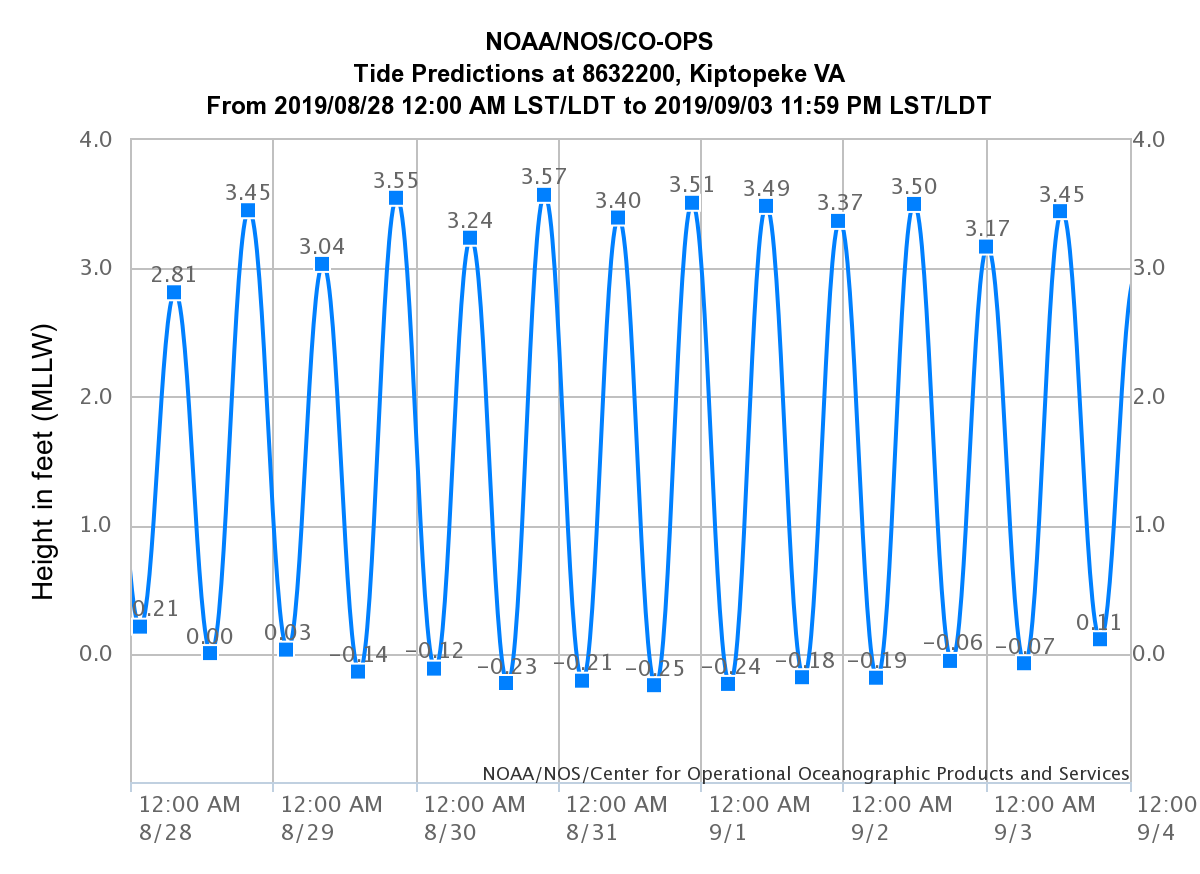
Click on the chart to view the dates and times for the predicted peak tides for this site. If it is within 36 hours in advance of these tidal peaks, you can view the Tidewatch Chart for this station with wind-driven surge guidance included in the forecast.
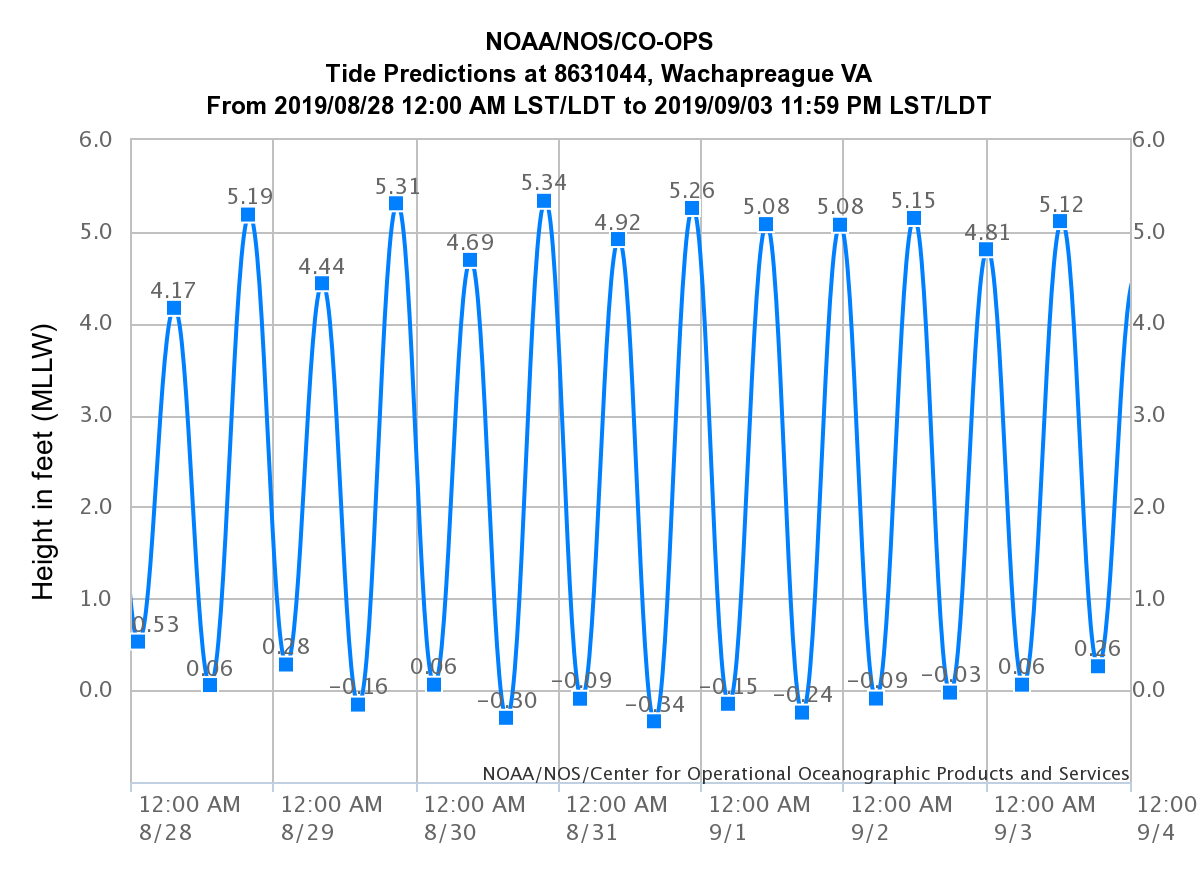
10. Wachapreague | VA Eastern Shore Northeastern Bank