

2012 SAV Executive Summary
The 2012 distribution of submerged aquatic vegetation (SAV) in Chesapeake Bay and its tributaries was mapped from black and white aerial photographs. These were taken between May and October 2012, at a scale of 1:24,000, encompassing 167 flight lines.
Chesapeake Bay
For 2012, 19,503 hectares (48,195 acres) of SAV were mapped in Chesapeake Bay and its tributaries.
Although the Chesapeake Bay and its tributaries were fully mapped for 2012, SAV signatures in a number of regions in 2011 were masked by excess turbidity present months after the passage of Hurricane Irene and Tropical Storm Lee, preventing those regions from being fully mapped for 2011. The regions that were not mapped are contained within nine CBP segments, including the Middle, Upper and Western Branch of the Patuxent River; the Middle and Upper Potomac River; Piscataway Creek; and the Anacostia River. In order to ensure a valid analysis of change in SAV distribution and abundance with 2011, all direct comparisons to previous years in this report are restricted to only those regions that were mapped in both years. If a region was not mapped in 2011, comparisons are given using area totals from 2010 instead.
Notable changes in SAV distribution were measured between 2012 and 2011. SAV decreased 21% from 23,346 ha (57,690 ac) to 18,477 ha (45,658 ac) in the regions mapped for both years.
SAV decreased in all three (Upper, Middle, and Lower) geographic zones delineated for Chesapeake Bay. In 2012, SAV increased in 17, decreased in 47, and remained unvegetated in 29 of the CBP segments.
Segment Comparison Map
|
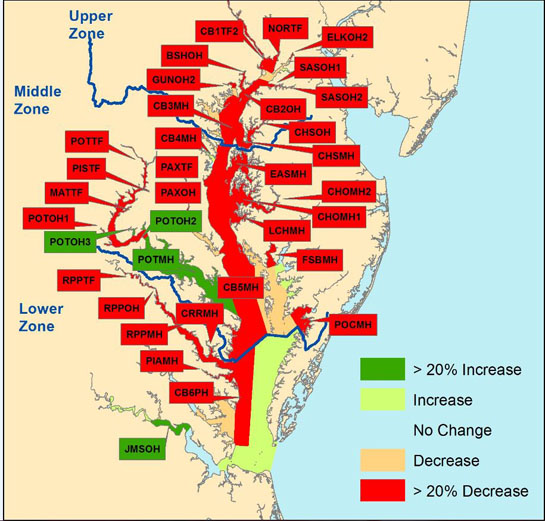
The 4,869 ha decrease in baywide SAV coverage in 2012 follows a 6,710 ha decrease in 2011 and reflects reduced SAV abundance at a level last reported for the Bay in 1986. The 2012 decrease was the result of a strong decline in the Upper (1,700 ha) and Middle (2,739 ha) Bay zones and a lesser decline in the Lower Bay Zone (430 ha). Losses in the Upper and Middle Bay zones most likely reflect the effects of Hurricane Irene and Tropical Storm Lee that kept turbidity high in these regions from September to late October 2011 and deposited a large amount of sediment in the system.
While these losses are alarming, two areas showed notable resilience and expansion. The large bed at the head of the Bay on the Susquehanna Flats, although diminished, remained robust and very dense. In addition, SAV continued to increase in the mainstem Tidal Freshwater and Oligohaline segments of the James River.
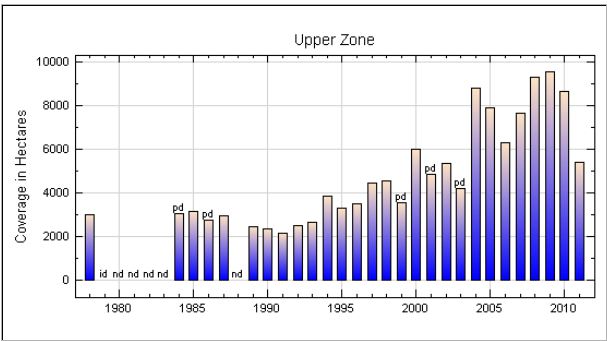
Upper Bay Zone
In the Upper Bay Zone (21 CBP segments extending south from the Susquehanna River to the Chester and Magothy rivers), SAV decreased 32% from 5,377 ha (13,287 ac) in 2011 to 3,677 ha (9,087 ac) in 2012.
None of the 21 segments increased by at least 20% and by at least 5 ha from 2011 totals.
| Eleven of the 21 segments decreased by at least 20% and by at least 5 ha from 2011 totals: |
|---|
| ▼ 29%, Northern Chesapeake Bay Segment 2 (CB1TF2), 3431 ha (2011) vs. 2438 ha (2012) |
| ▼ 52%, Northeast River (NORTF), 44 ha (2011) vs. 21 ha (2012) |
| ▼ 100%, Elk River Segment 2 (ELKOH2), 12 ha (2011) vs. 0 ha (2012) |
| ▼ 30%, Upper Chesapeake Bay (CB2OH), 170 ha (2011) vs. 119 ha (2012) |
| ▼ 38%, Sassafras River Segment 1 (SASOH1), 171 ha (2011) vs. 107 ha (2012) |
| ▼ 90%, Sassafras River Segment 2 (SASOH2), 38 ha (2011) vs. 4 ha (2012) |
| ▼ 57%, Bush River (BSHOH), 113 ha (2011) vs. 48 ha (2012) |
| ▼ 61%, Gunpowder River Segment 2 (GUNOH2), 361 ha (2011) vs. 140 ha (2012) |
| ▼ 43%, Upper Central Chesapeake Bay (CB3MH), 311 ha (2011) vs. 176 ha (2012) |
| ▼ 39%, Lower Chester River (CHSMH), 115 ha (2011) vs. 70 ha (2012) |
| ▼ 100%, Middle Chester River (CHSOH), 7 ha (2011) vs. 0 ha (2012) |
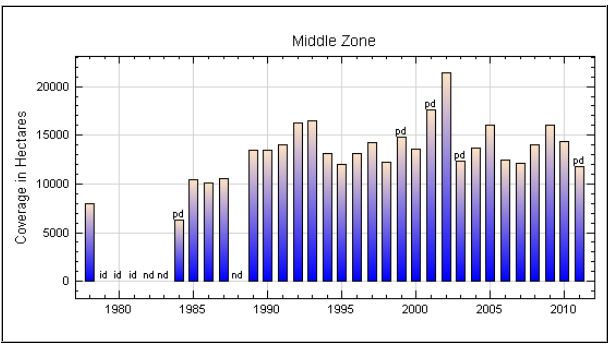
Middle Bay Zone
In the Middle Bay Zone (44 CBP segments extending south from the Bay Bridge to the Rappahannock River and Pocomoke Sound, and including the Potomac River), 9,922 hectares (24,518 ac) of SAV were mapped for 2012. Portions of the zone, including the Middle, Upper and Western Branch of the Patuxent River; the Middle and Upper Potomac; Piscataway Creek; and the Anacostia River, representing 1,027 ha of SAV in 2012 (2,538 ac, 10% of the zone total) were not mapped for 2011. If a region was not mapped in 2011, comparisons are given using area totals from 2010 instead. Comparing the same mapped regions between 2011 and 2012, SAV decreased 24% from 11,634 hectares (28,749 ac) in 2011 to 8,895 hectares (21,980 ac) in 2012.
| Three of the 44 segments (or mapped portions) increased by at least 20% and by at least 5 ha from 2011 totals: |
|---|
| ▲ 92%, Lower Potomac River (POTMH), 149 ha (2011) vs. 287 ha (2012) |
| ▲ 36%, Middle Potomac River Segment 2 (POTOH2), 55 ha (2010) vs. 76 ha (2012)** |
| ▲ 350%, Middle Potomac River Segment 3 (POTOH3), 33 ha (2010) vs. 150 ha (2012)** |
| Fourteen of the 44 segments (or mapped portions) decreased by at least 20% and by at least 5 ha from 2011 totals: |
|---|
| ▼ 100%, Middle Central Chesapeake Bay (CB4MH), 28 ha (2011) vs. 0 ha (2012) |
| ▼ 86%, Eastern Bay (EASMH), 661 ha (2011) vs. 92 ha (2012) |
| ▼ 73%, Mouth of the Choptank River (CHOMH1), 1144 ha (2011) vs. 306 ha (2012) |
| ▼ 59%, Lower Choptank River (CHOMH2), 18 ha (2011) vs. 7 ha (2012) |
| ▼ 76%, Little Choptank River (LCHMH), 193 ha (2011) vs. 46 ha (2012) |
| ▼ 64%, Lower Central Chesapeake Bay (CB5MH), 845 ha (2011) vs. 307 ha (2012) |
| ▼ 59%, Fishing Bay (FSBMH), 63 ha (2011) vs. 26 ha (2012) |
| ▼ 20%, Lower Pocomoke River (POCMH), 701 ha (2011) vs. 559 ha (2012) |
| ▼ 76%, Middle Patuxent River (PAXOH), 27 ha (2010) vs. 7 ha (2012)** |
| ▼ 80%, Upper Patuxent River (PAXTF), 60 ha (2010) vs. 12 ha (2012)** |
| ▼ 36%, Middle Potomac River Segment 1 (POTOH1), 1,145 ha (2011) vs. 734 ha (2012) * |
| ▼ 3%, Upper Potomac River (POTTF), 2,316 ha (2010) vs. 1,092 ha (2012)** |
| ▼ 24%, Mattawoman Creek (MATTF), 285 ha (2011) vs. 218 ha (2012) |
| ▼ 52%, Piscataway Creek (PISTF), 212 ha (2010) vs 102 ha (2012)** |
Seventeen of the 44 segments remained unvegetated in 2012.
* Segment comparison restricted to areas mapped in both 2011 and 2012
** Segment comparison restricted to areas mapped in both 2010 and 2012
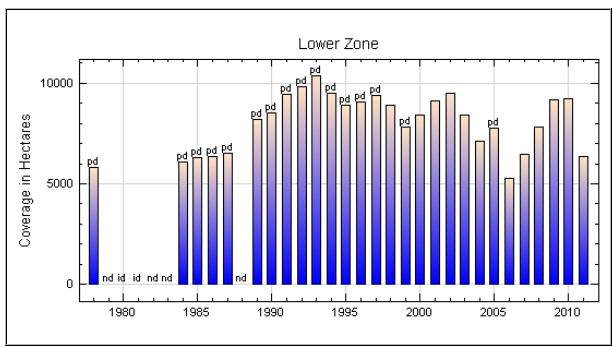
Lower Bay Zone
In the Lower Bay Zone (28 CBP segments covering the region south from the Rappahannock River and Pocomoke Sound regions to the mouth of the Bay), SAV decreased 7% from 6,335 ha (15,654 ac) in 2011 to 5,905 ha (14,591 ac) in 2012.
| One of the 28 segments increased by at least 20% and by at least 5 ha from 2011 totals: |
|---|
| ▲ 110%, Middle James River (JMSOH), 13 ha (2011) vs. 27 ha (2012) |
| Six of the 28 segments decreased by at least 20% and by at least 5 ha from 2011 totals: |
|---|
| ▼ 39%, Western Lower Chesapeake Bay (CB6PH), 131 ha (2011) vs. 80 ha (2012) |
| ▼ 48%, Lower Rappahannock River (RPPMH), 316 ha (2011) vs. 165 ha (2012) |
| ▼ 45%, Corrotoman River (CRRMH), 74 ha (2011) vs. 41 ha (2012) |
| ▼ 72%, Middle Rappahannock River (RPPOH), 9 ha (2011) vs. 3 ha (2012) |
| ▼ 71%, Upper Rappahannock River (RPPTF), 121 ha (2011) vs. 35 ha (2012) |
| ▼ 48%, Piankatank River (PIAMH), 79 ha (2011) vs. 41 ha (2012) |
Ten of the 28 segments remained unvegetated in 2012.
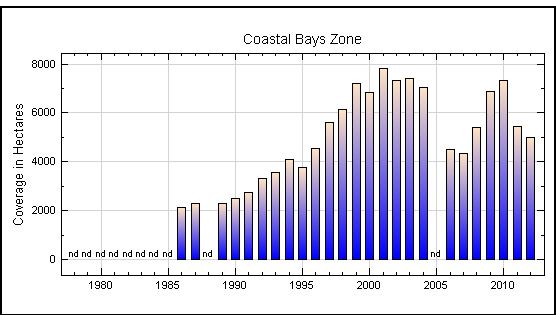
Delmarva Peninsula Coastal Bays Zone
In the Delmarva Peninsula Coastal Bays Zone (Assawoman, Isle of Wight, Sinepuxent, Chincoteague, and Southern Virginia coastal bays), SAV decreased 8% from 5,445 ha (13,455 ac) in 2011 to 4,988 ha (12,326 ac) in 2012.
| Four of the five segments increased since 2011: |
|---|
| ▲ 289%, Assawoman Bay (AAWPH) 16 ha (2011), vs. 62 ha (2012) |
| ▲ 334%, Isle of Wight Bay (IOWPH) 13 ha (2011), vs. 57 ha (2012) |
| ▲ 1%, Sinepuxent Bay (SPXPH) 505 ha (2011), vs. 512 ha (2012) |
| ▲ 6%, Southern Virginia Coastal Bays (SVCPH) 1,769 ha (2011), vs. 1,878 ha (2012) |
| One of the five segments decreased since 2011: |
|---|
| ▼ 21%, Chincoteague Bay (CHNPH), 3,142 ha (2011) vs.2,478 ha (2012) |