

'Catch the King' Tide
App-Observed King Tide Extents vs. Nov. 5th Forecast of Predicted Maximum Flooding Extents, 08:00-11:59 AM EDT
"Catch the King" was a citizen science GPS data collection effort centered in Hampton Roads, VA, that sought to map the King Tide's maximum inundation extents with the goal of validating and improving predictive models for future forecasting of increasingly pervasive "nuisance" flooding. GPS data points were collected by volunteers to effectively breadcrumb/trace the high water line by pressing the 'Save Data' button in the Sea Level Rise App every few steps along the water's edge during the high tide on the morning of Nov. 5th, 2017.
Response from the event's dedicated volunteers, fueled by the local media partners' coverage leading up to the event, and over 35 separate volunteer training events held all over Hampton Roads resulted in 510 known participants collecting 53,006 time-stamped GPS maximum flooding extent measurements and 1,126 geotagged photographs of the King Tide flooding during the event.
In the months following the event, 187 people emailed Dr. Loftis with additional GPS data points missing from the original event as a few volunteers noticed their data missing from the map as he presented it and as it was published in The Virginian-Pilot and Daily Press and among other media sources nationally. These data were collected through separate, concomitant, private events established with the Sea Level Rise app on November 5th, 2017, and are included to total 59,718 data points and 1582 photographs from 722 individual volunteers. Click the collapsible arrows below for an infographic or video breakdown of these statistics.
"Catch the King" Participation Statistics...ranked by locality where the greatest number of High Water Marks were collected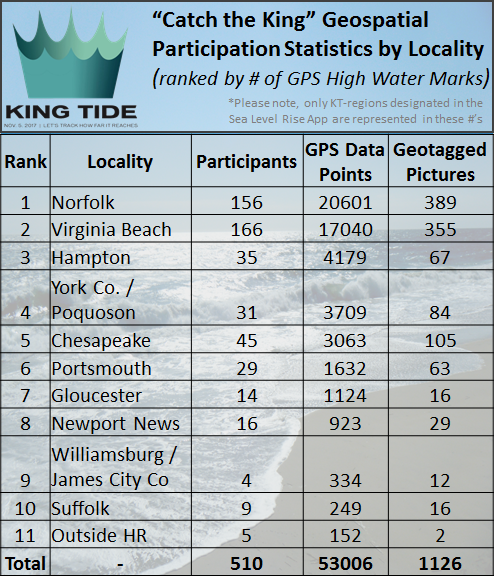
|
"Catch the King" Data Presentation Video |
Map of Citizen Science SLR App Observations vs. Model-Predicted Maximum Flooding Extents
GPS high water mark data appear on the embedded map above as blue dots. Red points correspond with Tidewatch and StormSense water level sensors. This interactive map presents forecasted maximum flooding extents for the King Tide on Sunday, 11/05/2017, from 08:00-11:59 AM EDT, with the Sea Level Rise App data serving as an effective validation of the model's predictions. Evaluate the comparison for yourself using the measuring tools and print your own maps using the embedded interactive map's toolbar. Inundation forecast results are depicted using a range of blue hues correponding with flood depths, and are advised by VIMS' hydrodynamic models and by Tidewatch.
Interested volunteers can participate in future citizen science field data collection events like this one by downloading the "Sea Level Rise" application onto their smartphones, and using the app to trace the high water line from varying locations where they observe inundation. The data will be collected and used to help scientists, educators, and community leaders better understand the risks imposed by the rising tide. To learn more about how the Commonwealth Center for Recurrent Flooding Resiliency is working to help address these issues, visit: http://www.floodingresiliency.org/.
To see these data on the App's website, visit: https://searisingsolutions.com/king-tide-2017-mapping.shtml.
To download a copy of these GIS data, click one of the designated areas to download ALL or a subset of the dataset from that city/county/region (updated 08/14/2018):
| ALL King Tide Data | Virginia Beach | Norfolk |
| Williamsburg & James City Co. |
Chesapeake | Hampton |
| Gloucester & Mathews | Newport News | Portsmouth |
| Outside Hampton Roads | York & Poquoson | Suffolk |
Attributions: Volunteers of 'Catch the King' Tide 2017 collected these data using the Sea Level Rise mobile application developed by Wetlands Watch and Concursive, Inc. Catch the King 2017 was sponsored and supported by The Virginian-Pilot, the Daily Press, WHRO Public Media, and WVEC News 13, and the CCRFR and orchestrated/managed by Qaren Jacklich and a dedicated team of tide captains. GPS Volunteer data were shared with VIMS for public dissemination via Concursive, Inc. and many volunteers directly.