

Extratidal Water Levels
What is an Extratidal High Water or Low Water?
In tidal areas, an observed water level that exceeds the vertical limits of the predicted tide for a given location is called an extratidal water level. An extratidal high water is one that rises higher than the highest predicted tide and an extratidal low water is one that falls lower than the lowest predicted tide at that location.
The predicted or astronomical tide is the daily change in water level produced by the gravitational interactions of the earth, moon, and sun. Mathematical formulas allow the times and heights of the astronomical high and low tides to be predicted years in advance for the familiar Tide Tables. The highest water level that a given formula can ever predict is called Highest Astronomical Tide (HAT) and the lowest level it can predict is called Lowest Astronomical Tide (LAT). Both are used as tidal datums in the United Kingdom and elsewhere but are not among the datums officially recognized in the United States, where Mean Higher High Water (MHHW), Mean Lower Low Water (MLLW), and Mean Sea Level (MSL) are among the tidal datums in use (see http://tidesandcurrents.noaa.gov/).
Since no predicted tide should ever be higher than HAT or lower than LAT, it follows that observed water levels that do either one are extratidal by definition. Since some predicted tides rise above MHHW and some fall below MLLW, no similar definition exists for these datums.
How do water levels become extratidal?
Water levels can become extratidal in two ways. A storm surge can push water levels higher than expected due to the effects of wind stress; a storm can also raise water levels due to a drop in barometric pressure. Water levels can also become extratidal through a sea-level anomaly—a measure of the difference between short-term and long-term mean sea level. Sea level is dynamic and continually changing so understanding this difference is very important.
How is sea-level defined and referenced?
In the U.S., the National Oceanic and Atmospheric Administration (NOAA) defines long-term mean sea level (MSL) as the average over the National Tidal Datum Epoch (NTDE), a specific 19-year interval that presently includes the years 1983 through 2001 (other countries have their own definitions). Short-term usually refers to monthly mean sea level (mmsl), another statistic that NOAA tracks. Tracking the difference between mmsl and MSL over a single year reveals important seasonal changes where mmsl is higher than MSL in some months and lower than MSL in others. Over tens of years, there are important decadal changes to reckon with and finally, there is sea-level rise as time marches on.
Time doesn’t have to march very far before we encounter sea-level anomalies that matter. We don’t want to see a large positive sea-level anomaly (mmsl elevated well above MSL) just as a hurricane is approaching the coast where we live. That’s because the storm surge that comes with it will add to the mean water level that exists at the time—not the average that NOAA has worked up from measurements made more than a decade ago (The NTDE is updated roughly every 20 years or as needed). This brings up another problem: like storm surge, the daily rise and fall in water level that we call the tide adds or subtracts from time-local sea level, not 1983-2001 MSL. To deal with these problems, a 30-day running mean, m30, has been substituted for the usual calendar month in deriving time-local mmsl. The definition of sea level anomaly is then modified to become the difference m30-MSL (positive or negative) and m30 becomes the reference for the astronomic tide as in the graphs at www.vims.edu/tidewatch .
The astronomic tide used here is actually a least-squares harmonic fit to the observed water level over the 30 days used for m30, the running mean. As such, it’s not quite the same as the predicted tides in the NOAA tide tables since it represents an oscillation around m30 and not around MSL. Its main purpose is to explain water-level change occurring at tidal frequencies right now and not to make future predictions.
You may occasionally notice in the Tidewatch graphs that some of the astronomic highs exceed the tidal datum of HAT (or that some of the astronomic lows fall below LAT). This happens because of the sea-level anomaly, as described above.
Sea-Level Anomalies
In effect, the sea level anomaly is a correction that needs to be applied to tide predictions to account for short-term change in sea level. The formula for making this correction is:
Astronomic Tide = Predicted Tide + Sea Level Anomaly
Having this correction allows another important formula to be written:
Storm Surge = Observed Water Level – Astronomic Tide
In words, the residual difference between observed and astronomic furnishes an estimate of the actual storm surge or meteorological tide recorded at a water level station—as opposed to storm surge predicted by a computer model. Computer models are fine but occasionally we should ask: who or what verifies their predictions? Weather events can cause meteorological tides to go up or down, giving us extratidal water levels that go below the tidal datum LAT as well as above the tidal datum HAT.
The sea-level anomaly, as we have defined it, represents a slow-acting, gradual change—usually small but going on all the time. In contrast, the storm surge caused by a tropical storm or hurricane is often large and sudden, producing highly destructive storm tides after combining with the astronomic tide (worst case: spring tides, astronomic high near the storm-surge peak with sea level elevated). As this game of roulette unfolds, the storm-tide problem for coastal residents begins as water levels go extratidal and it gets bigger with every foot above HAT.
Advantages of referring to Extratidal High Water
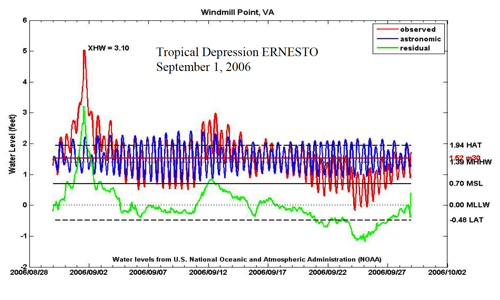
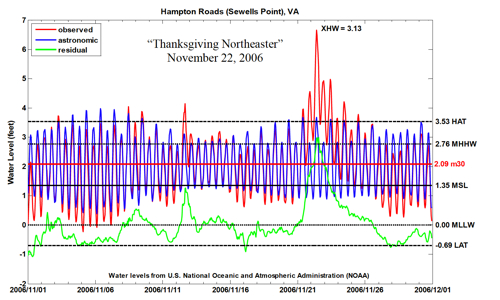
Extratidal High Water (XHW)—the height in feet or meters above HAT datum—offers special advantages in comparing storm tides between locations with different tidal ranges (e.g., diurnal range = MHHW-MLLW difference).
If we compare the storm tide below for Windmill Point, VA (range=1.39 ft) to a similar one at Hampton Roads (range=2.76 ft), we see XHW values that are about the same, yet the observed peak at Windmill Point is only 5 feet above MLLW as compared to 6.7 feet above MLLW at Hampton Roads. Nevertheless, the residents at Windmill Point experienced the pain of flooding as much, or more, than the people in Hampton Roads during these two events! Only XHW is a true index of flooding severity at these two locations.
 |
 |