

Researchers issue first-annual sea-level report cards
Interactive graphs project sea-level changes to 2050 for 32 U.S. localities
Researchers at William & Mary’s Virginia Institute of Marine Science are launching new web-based “report cards” to monitor and forecast changes in sea level at 32 localities along the U.S. coastline from Maine to Alaska. They plan to update the report cards in January of each year, with projections out to the year 2050.
 The lead on the project, VIMS emeritus professor John Boon, says the report cards are designed to add value by providing sea-level updates that are more frequent and localized than those generated by NOAA or other scientific bodies. Boon and colleagues also take a statistical approach that incorporates evidence for recent acceleration in the rate of sea-level change at many U.S. tide-gauge stations.
Boon and his team furthermore stress their use of relative sea-level measurements—changes in water level relative to the land surface on which people live and work—rather than the absolute sea-level measures used in many global models and predictions. Relative sea level is increasing in Virginia and other East and Gulf coast areas due to both rising water and sinking land.
Joining Boon on the project are Ph.D. student Molly Mitchell and assistant research scientist Derek Loftis. Mitchell is lead author on the 2012 sea-level report requested by Virginia’s General Assembly, while Loftis helps direct StormSense, a project to monitor and model coastal flooding in and around Hampton Roads. Boon created VIMS’ popular Tidewatch network and has literally written the book on the analysis of tides and tidal currents.
The value of an annual, localized report card
Because long-term changes in sea level are incremental in nature— typically a few millimeters per year—researchers have traditionally felt little need to issue frequent forecasts of sea-level changes. Moreover, many sea-level projections are global in scope, with a forecast horizon of 2100—far enough off to allow for readily discernible linear change. Thus the IPCC’s oft-reported prediction of 65 centimeters (2.1 feet) of global sea-level rise by the end of the century.
The VIMS team has purposefully taken a more localized and timely approach, one designed to add maximum value for coastal residents, businesses, and government agencies.
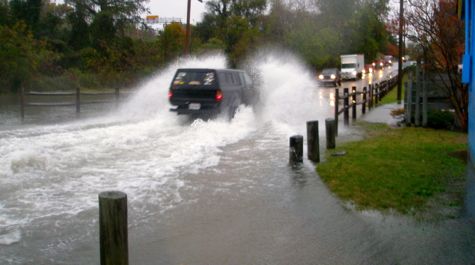
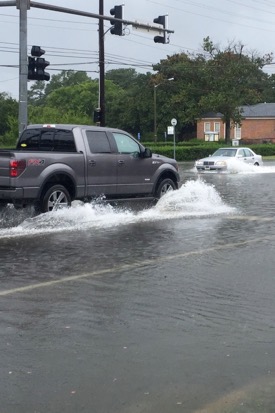
 Says Boon, “Our report cards show what sea level has been doing recently, what’s happening now at your locality. Numerous studies show that local rates of sea-level rise and acceleration differ substantially from the global rates published by the IPCC and NOAA—a key result because local rates of relative sea-level rise give a direct indication of the extent to which homes, buildings, and roads are at risk of flooding.”
The team’s decision to use a subset of available tide-gauge data also runs counter to the traditional approach taken by researchers at NOAA, the agency that operates the nation’s official network of tidal stations.
“NOAA should be commended for their care in ensuring the continuity, consistency, and availability of the nation’s long-term tidal datasets,” says Boon. “But at the same time, a longer record isn’t always better, especially when there’s evidence of recent non-linear changes in the rate of sea-level rise like we see along the U.S. East Coast.”
An earlier analysis by Boon showed that this non-linear change or acceleration began in 1987, at the center of a 36-year sliding window beginning in 1969—thus setting the start date for the VIMS report cards. This is decades after many U.S. tide-gauge stations began operation.
Mitchell explains further, “If you cross a threshold in terms of something like sea-level rise, what came before—say a tide-gauge record that began in 1900—is biased in terms of seeing where you’re going. We think the ice sheets are melting faster today than they ever have before, and if that's true then the previous 90 years of data won’t accurately predict the future.”
The difference between the linear rates used in NOAA’s sea-level forecasts and the non-linear, accelerating rates used in VIMS’ report cards is much more than a statistical subtlety—it leads to sharply different forecasts of our sea-level future.
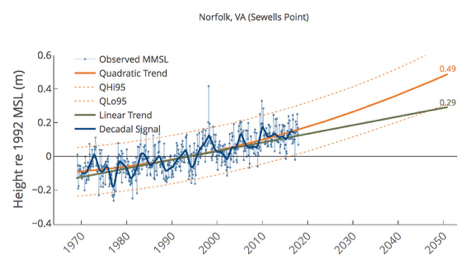
A good example can be found in VIMS’ backyard, using data from NOAA’s Sewells Point tide gauge in Norfolk, Virginia. Extending NOAA’s linear sea-level projections to mid-century indicates that sea level here will be 0.29 meters (11.42 inches) higher by 2050, while the VIMS forecast—using a non-linear, accelerating rate—is 0.49 meters, or 19.3 inches. That extra 20 centimeters (8”) of sea-level rise would have major implications for the low-lying region.
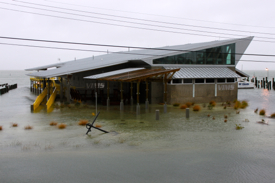
 The VIMS team moreover cautions that sea level is likely to experience short-term variations in the future just as it does today. Thus, coastal residents and planners in Virginia and other areas likely to experience significant sea-level increases by 2050 must also account for storm surges and other transient forces raising sea level even higher than the projected mean rise value.
Visit our report card webpage for full-size, interactive versions of all 32 report cards.
Anatomy of a Sea-Level Report Card
VIMS’ Sea-Level Report Cards have three components: the projection of sea-level height to the year 2050, a display of recent trends in the rates of sea-level change, and an explanation of processes affecting sea level at each locality.
The report card website, www.vims.edu/sealevelreportcard, explains the data and statistical approaches used in the 2050 projections.
The trend charts help users keep track of changes in the rate of sea-level rise and acceleration at each locality (or sea-level fall and deceleration in some places)—as these will very likely change from year-to-year due to hurricanes and other short-term weather events, as well as longer-term, decade-scale processes such as the El Niño-Southern Oscillation or the North Atlantic Oscillation. A projection to 2050 made during an upturn in a decadal signal will be higher than it would be if the decadal signal was nearing or at a low.
The final report card component explains for each locality and region (U.S. East, Gulf, or West coast) the long-term processes that force changes in the mass, volume, and regional distribution of seawater; changes in shoreline elevation; or both. Complex interactions among these processes can lead to significant differences in sea-level trends in different regions, or in some cases at localities relatively near each other. Alternatively, these interactions can result in similar sea-level trends in areas that lie far apart.
Full details of VIMS’ Sea-Level Report Cards are provided in an accompanying technical report—Anthropocene Sea Level Change: A History of Recent Trends Observed in the U.S. East, Gulf & West Coast Regions—available through the Hargis Library at VIMS. The report also provides management recommendations. The team plans to add these to their report cards in the near future.
The "Anthropocene"—from the Greek “anthropo” (human) and “cene” (recent)—is a newly coined term that recognizes a growing view among scientists that humanity’s influence on Earth’s environmental processes warrants adding a new epoch to the geologic time scale. If formally adopted, the term would supersede the current Holocene epoch, which began about 12,000 years ago with the melting of the Pleistocene ice sheets.
“The Anthropocene is a time of rapid change when we should really be keeping a close eye on sea level,” says Boon.